

Abstract
Methods for haplotyping and DNA copy-number typing of single cells are paramount for studying genomic heterogeneity and enabling genetic diagnosis. Before analyzing the DNA of a single cell by microarray or next-generation sequencing, a whole-genome amplification (WGA) process is required, but it substantially distorts the frequency and composition of the cell’s alleles. As a consequence, haplotyping methods suffer from error-prone discrete SNP genotypes (AA, AB, BB) and DNA copy-number profiling remains difficult because true DNA copy-number aberrations have to be discriminated from WGA artifacts. Here, we developed a single-cell genome analysis method that reconstructs genome-wide haplotype architectures as well as the copy-number and segregational origin of those haplotypes by employing phased parental genotypes and deciphering WGA-distorted SNP B-allele fractions via a process we coin haplarithmisis. We demonstrate that the method can be applied as a generic method for preimplantation genetic diagnosis on single cells biopsied from human embryos, enabling diagnosis of disease alleles genome wide as well as numerical and structural chromosomal anomalies. Moreover, meiotic segregation errors can be distinguished from mitotic ones.
Introduction
During meiosis, homologous recombination creates novel combinations of parental alleles, resulting in genetic diversity in the offspring and acting as a driving force in evolution.1 As a result, each zygote has a unique genetic constitution. In order to study and identify homologous recombination in a genome as well as to track the transmission of disease alleles in a conceptus, it is imperative to haplotype,2 i.e., assign genetic variants to one or both homologous chromosomes. Furthermore, numerical and structural chromosome anomalies can occur during gametogenesis and are common in human embryogenesis,3,4 but the nature, mechanism, and consequence of this chromosome instability still remain largely elusive.5 As such, there is a huge interest in the analysis of both haplotypes and DNA copy number of human single cells, particularly human gametes, zygotes, and blastomeres of embryos.3,6–10 In turn, this knowledge can be applied in the clinic to avoid the transmission of genetic disorders and to improve the success of in vitro fertilization (IVF).
Although genotyping of haploid cells, like spermatozoa, produces a direct readout of the haplotype,6–9 reconstructing the haplotype of a diploid cell has proven to be more challenging. Microfluidic separation of intact homologous chromosomes from a single cell and subsequent genotyping of chromosome-specific amplification products requires metaphase cells, which makes the technology inapplicable to a majority of primary diploid cells.11 Alternatively, methods for family-based haplotyping of diploid cells are available, but these traditionally rely on discrete SNP-genotype calls (AA, AB, BB),12 which are prone to error. This is because the underlying copy-number state of the SNP is ignored and because the abundant WGA artifacts in single-cell assays produce false homozygous and heterozygous SNP calls.13,14
Various methods for DNA copy-number profiling of single cells have been developed and rely on transforming probe intensities of microarrays3,10,15–17 or next-generation sequence read counts18–21 into DNA copy numbers. However, it remains challenging to sift genuine copy-number changes from potential WGA artifacts in single cells.22,23 Whereas deletions can be confirmed by loss of heterozygosity across SNPs over a longer distance,15 discrete SNP-genotype calls nor regular SNP B-allele fractions can effectively validate duplications in single cells.20 Additionally, resolving the mitotic and meiotic origin as well as the parental origin of DNA anomalies in single cells, or determining the ploidy of the cell, is not straightforward.17,24
Although in theory the analysis of SNP B-allele fractions (BAFs)—i.e., the frequency with which a SNP variant allele occurs in the dataset of a DNA sample—should enable the determination of haplotypes and their underlying copy-number state, this has remained impossible at the single-cell level because single-cell analyses require WGA, a process known to introduce (stochastic) allelic distortions due to amplification artifacts.22,23 This poses daunting challenges for decrypting biologically meaningful information from SNP BAF data scrambled by technical noise.
Here, we developed a method that determines haplotypes as well as the copy number and segregational origin of those haplotypes across the genome of a single cell via a process we termed haplarithmisis (Greek for haplotype numbering). This latter process deciphers SNP B-allele fractions of single cells and is integrated in a broader computational workflow for single-cell haplotyping and imputation of linked disease variants (siCHILD) containing several modules for single-cell SNP data analysis. We apply this method to individual lymphocytes as well as blastomeres derived from human IVF embryos and demonstrate the determination of haplotypes carrying disease alleles in single-cell genomes. In addition, the method advances and facilitates the detection of genuine DNA copy-number changes in single cells, and also reveales their parental and mechanistic origin.
Material and Methods
siCHILD
siCHILD is a computational workflow (Figure S1) for single-cell genome-wide haplotyping and copy-number typing of the haplotypes in a cell, allowing the determination of the inheritance of linked disease variants as well as the detection of the parental and mitotic/meiotic origin of haplotype anomalies in the cell. It consists of five modules, which are further detailed below, and uses as input discrete genotype calls (AA, AB, BB), B-allele frequencies, and logR values of SNPs along with phased parental SNP genotypes. siCHILD is developed in R.
Module 1: Quality Control of Single-Cell SNP Data
To identify cells with substandard WGA, we perform quality control (QC) on the single-cell discrete SNP genotypes and logR values. After hybridization of single-cell WGA products on Illumina SNP arrays, discrete SNP genotypes are determined with GenCall (see below). Furthermore, for a particular SNP, the logR is the base 2 logarithm of the summed normalized SNP probe intensity values observed for each allele in the sample versus the expected summed intensity values derived from a set of normal samples (e.g., for a single cell the logR of a SNP is ).25 These logR values are exported from GenomeStudio (Illumina).
Discrete SNP genotypes of single cells are first investigated for rates of NoCall, allele-drop-out (ADO), and allele-drop-in (ADI) by using the parental genotypes, which are derived from DNA samples extracted from millions of white blood cells. For instance, for a SNP with paternal AA and maternal BB genotypes, a cell of a conceptus is an obligate heterozygote AB; thus, detecting an AA or BB genotype for this SNP in the cell represents an ADO event. Similarly, the detection of an AB genotype in a cell of a conceptus for a SNP with paternal AA and maternal AA genotypes denotes an ADI event. These events are quantified via the formulas specified in Table S1.
However, such Mendelian errors in SNP genotypes might not only reflect the quality of WGA or putative contamination of the sample with exogenous DNA, but might also reveal chromosomal DNA copy-number and copy-neutral anomalies present in the cell, e.g., ADO across a full chromosome might indicate a monosomy or a uniparental isodisomy, and NoCall across a full chromosome might indicate a nullisomy. Hence, to evaluate single-cell SNP genotypes for ADO, ADI, and NoCall events and their pattern of occurrences across the cell’s genome, (1) ADO, ADI, and NoCall events are visualized genome wide for inspection, and (2) single-cell SNP genotypes are subjected to unsupervised hierarchical clustering (R package pvclust), allowing us to further evaluate kinship of cells as well as large-scale DNA copy-number aberrations within cells on the basis of SNP genotypes. Substandard single-cell SNP genotypes deposited on unexpected branches of the cluster graph are excluded from further analysis.
Substandard WGA products might also demonstrate higher standard deviations (SD) of the single-cell logR values genome wide. However, higher standard deviation of logR values across the genome might also result from acquired numerical aberrations of chromosomes in the cell, due to chromosome instability of the cell type. To distinguish among both possibilities, we first determined the SD in logR per chromosome and subsequently summed these chromosome-specific SDs per cell to a single cumulative standard deviation (CSD) value per cell. For QC filtering, a mixture model of two normal distributions was fitted to the bimodal density function of the single-cell CSD values across all cells. Cells within 90% of the main low CSD distribution were retained for further analysis.
Module 2: Single-Cell Haplarithmisis
Haplarithmisis uses single-cell SNP BAFs and phased parental genotypes to determine genome-wide haplotypes, the copy-number state of the haplotypes, as well as the parental and segregational origin of putative haplotype anomalies in the cell.
Haplarithmisis applies the following eight steps. (1) The parental genotypes are phased via an available SNP genotype derived from a close relative. In this study, we applied either grandparents (option 1) or a sibling (option 2). We applied both options for families that underwent preimplantation genetic diagnosis (PGD). Specifically, for families PGD002, PGD004, PGD005, PGD006, PGD008, PGD012, PGD018, and PGD020, an affected sibling’s genotype was used as a seed for parental genotype phasing, and in families PGD014, PGD016, and PGD022, a grandparental genotype was applied. For family PGD021, genotypes of both the affected sibling and the paternal grandparents were available as seeds for parental genotype phasing. (2) The informative SNP loci are identified. A SNP locus is defined informative when one parent is heterozygous and the other parent is homozygous for this SNP. (3) The informative SNPs are categorized as paternal or maternal. An informative SNP is defined “paternal” when the father’s genotype is heterozygous and the mother’s genotype is homozygous. Similarly, an informative SNP is defined “maternal” when the mother’s SNP genotype is heterozygous and the father’s SNP genotype is homozygous. (4) These maternal and paternal informative SNP loci are subcategorized on the basis of phased parental SNP genotype combinations (Figure 1). If the father’s SNP genotype is AB and the mother’s SNP genotype is AA, or if the father’s SNP genotype is BA and the mother’s SNP genotype is BB, these SNP loci are labeled “P1” in the paternal informative SNP category. If the father’s SNP genotype is AB and the mother’s SNP genotype is BB, or if the father’s SNP genotype is BA and the mother’s SNP genotype is AA, these SNP loci are labeled “P2” in the paternal informative SNP category. In the maternal informative SNP category, SNP loci are labeled “M1” and “M2” according to similar rules. (5) The SNP BAF values of the single cell are distributed into a paternal or maternal category according to the informative parental SNP genotypes defined in step 3, and further into four parental subcategories (P1, P2, M1, M2) according to the informative phased parental SNP genotypes defined in step 4. Hence, paternally informative single-cell BAF values are derived from those SNPs belonging to subcategories P1 and P2, and maternally informative single-cell BAF values are derived from those SNPs belonging to subcategories M1 and M2. The phased parental genotypes that define single-cell SNP BAF values in P1 and P2 have been specified such that when the cell inherits homolog 1 (H1) of the father (and either H1 or H2 of the mother), P1 SNP BAFs have values of either 0 or 1 (corresponding to homozygous AA and BB genotypes in the cell, respectively) and P2 SNP BAFs have a value of 0.5 (corresponding to heterozygous genotypes in the cell). In contrast, when the cell inherits homolog 2 (H2) of the father (and either H1 or H2 of the mother), P1 SNP BAFs have a value of 0.5 (corresponding to heterozygous genotypes in the cell) and P2 SNP BAFs have a value of either 0 or 1 (corresponding to homozygous AA and BB genotypes in the cell, respectively). A similar rationale applies to single-cell SNP BAFs in the M1 and M2 subcategories. Note that the parental H1 and H2 are defined on the basis of their phased genotype (Figure 1). (6) The single-cell BAF values are subsequently mirrored around the 0.5 axis for those SNPs where either parent has a heterozygous SNP call BA after phasing. Therefore, if the cell inherited H1 of the father (and either H1 or H2 of the mother), P1 SNP BAFs will now have a value of 0 and P2 SNP BAFs will continue to have a value of 0.5. In contrast, when the cell inherited H2 of the father (and either H1 or H2 of the mother), P1 SNP BAFs will have a value of 0.5, but P2 SNP BAFs will now have a value of 1. A similar rationale applies to single-cell SNP BAFs in the M1 and M2 subcategories. (7) Subsequently, per subcategory (P1, P2, M1, M2), these single-cell BAF values for consecutive SNPs in the genome are segmented by piecewise constant fitting (PCF, using a penalty parameter gamma set to 10 in this study26). The resulting segments define the blocks of SNP alleles, derived from paternal H1 and H2 or from maternal H1 and H2, that co-occur on the same inherited chromosome, or in other words the haplotype blocks. Indeed, the loci where P1 and P2 SNP BAF segments jump from values 0 and 0.5 to values of 0.5 and 1, respectively, represent the sites of homologous recombination between the paternal H1 and H2 (Figure 1). A similar rationale applies to M1 and M2 SNP BAF segments. (8) These segments and the underlying processed SNP BAF values are visualized into two separate “haplarithm” plots, one for each parental chromosome. In the paternal haplarithm plot, segmented P1 and P2 profiles are depicted in blue and red, respectively. Similarly, segmented M1 and M2 are shown in blue and red, respectively, in the maternal haplarithm plot. These plots, containing segmented P1, P2, M1, and M2 patterns, reveal not only the parental haplotypes and the sites of homologous recombination, but also haplotype imbalances in single cells along with their parental and mechanistic origin (Figures 1 and 2). Indeed, when the cell has acquired, for example, a duplication of a paternal H1 segment, P1 SNP BAFs have an expected value of 0 and P2 SNP BAF values have an expected value of ∼0.33 across the duplication in the cell. In contrast, for the same duplication in the cell, M1 and M2 SNP BAFs have expected values of 0 and ∼0.67 when maternal H1 was inherited by the cell, or values of ∼0.33 and 1 when maternal H2 was inherited by the cell, respectively. Hence, haplarithmisis has two inherent attractive features: (1) parity within each parental haplarithm profile, i.e., the length of P1 and P2 segments should be approximately equal whereby their breakpoints delineate paternal homologous recombination sites (similarly for M1 and M2 segments), and (2) reciprocity between parental profiles, i.e., the differences between P1 and P2 SNP BAF values (dPat) after segmentation as well as the differences between M1 and M2 SNP BAF values (dMat) after segmentation are in a reciprocal manner characteristic for specific copy-number anomalies of a haplotype (dPat = ∼0.33 and dMat = ∼0.67 in the example of the duplication of a paternal H1 segment). Haplarithmisis can also reveal numerical chromosome anomalies that are meiotic in nature. For instance, when a cell inherited both paternal H1 and H2 (along with either maternal H1 or H2), then P1 SNP BAFs have an expected value of ∼0.33 and P2 SNP BAFs have an expected value of ∼0.67 across the region where both paternal and one maternal homologs are present in the cell.
Figure 1.
The Principles of Haplarithmisis
The sequence of actions applied for deciphering haplotypes and concomitantly copy number, parent-of-origin, and segregational origin information from single-cell SNP BAF values. The figure illustrates how maternal and paternal haplarithm plots arise for a cell that contains a normal disomy with one homologous recombination on each inherited chromosome. Parental homologs 1 and 2 (H1 and H2, respectively) are defined on the basis of their phased genotype. Pairwise breakpoints in the segmented M1 and M2 single-cell SNP BAF values pinpoint maternal homologous recombination sites, likewise for P1 and P2 in the paternal haplarithm plot. Additionally, the positioning of M1-M2 and P1-P2 segments is expected to be at 0, 0.5, or 1 on the y axis for a disomic copy number.
Figure 2.
Unique Haplarithm Patterns for Different Chromosomal Anomalies
The segmented M1 and M2 single-cell BAF values, as well as the distance between M1 and M2 values, changes according to the copy-number anomaly, the affected parental allele, and the meiotic I (MI), meiotic II (MII), or mitotic origin of the anomaly. Pairwise P1-P2 and M1-M2 breakpoints in the haplarithm profiles delineate sites of homologous recombination (i.e., the parity feature of haplarithmisis). Separately, the distance between P1 and P2 values (dPat) changes in a reciprocal manner with the M1-M2 distance (dMat) denoting copy number, parent-of-origin, and segregational origin of haplotypes (i.e., the reciprocity feature of haplarithmisis). Shown are expected haplarithm patterns for a nullisomy (A), a maternal monosomy (B), a normal disomy (C), a maternal MI UPD (D), a maternal MII UPD (E), a maternal mitotic UPD (F), a maternal MI trisomy (G), a maternal MII trisomy (H), a maternal mitotic trisomy (I), a maternal mitotic trisomy with three identical chromosomes (J), and a balanced tetrasomy (K).
Module 3: Single-Cell Haplotyping via Discrete SNP Genotype Calls
For genome-wide haplotype reconstruction of a single cell via discrete SNP genotypes, the genotypes of both parents as well as that of a close relative (e.g., a sibling or the grandparents) are required. In the current workflow two options are considered: (1) if grandparental DNA samples are available, their SNP genotypes will be used to phase the parental genotypes and subsequently the cell’s genotype is haplotyped by applying phasing rules on informative SNPs; (2) if DNA of a sibling is available, his or her SNP genotype will be applied to phase the parental SNP genotypes and subsequently the haplotypes of the single-cell SNP genotypes are determined by applying phasing rules on informative SNPs.
Because of allelic amplification bias and errors (e.g., ADO and ADI) after WGA, as well as the error-prone interpretation of SNP probe intensities by genotyping algorithms (e.g., Figure S4), individual SNP genotypes and thus SNP haplotype calls within a cell contain errors. To remove these random artifacts and to determine the SNP haplotype blocks within a cell, we designed a 1D median filter (1D-MF) that walks across the raw single-cell haplotypes for the informative SNPs genome wide and considers the raw haplotype state from multiple informative SNPs in a variable window (Wk, see below). Because 1D median filters preserve edges while removing noise,27–29 the locations of the homologous recombination sites in the reconstructed haplotypes of the cell are preserved. The 1D median filter window (Wk) for each chromosome “k” is defined as:
where Wk represents a chromosome k-specific window. W1 is the window specific for chromosome 1, containing 22 informative single-nucleotide polymorphic markers. nPMk is the total amount of informative single-nucleotide polymorphic markers for chromosome k (nPM1 is the total amount of informative SNPs for chromosome 1), and the division (nPMk/nPM1) is rounded to the nearest integer value.
Subsequently, the algorithm compares the single-cell haplotype blocks resulting from the 1D median filter with the raw SNP haplotypes of the cell and determines whether the majority of the SNPs (>60%) in the raw SNP haplotypes are assigned to the same allele as in the 1D-MF SNP-haplotype block. Otherwise the haplotype block from the 1D median filter is penalized and will not be deduced.
Using single-cell haplotyping, the inheritance of Mendelian disease variants linked with neighboring SNPs in a haplotype can be inferred for a single blastomere biopsied from an embryo. When the SNPs of the parents are phased using a sibling’s genotype (see option 2 above), the haplotypes of the blastomere must be compared with the sibling’s haplotypes, and the sibling’s phenotype must be taken into account along with the mode of inheritance of the Mendelian disorder (autosomal dominant, autosomal recessive, X-linked recessive) to infer the inheritance of the Mendelian disease variant(s). For instance, if the father and a sibling are affected with an autosomal-dominant disorder due to a mutation in a gene at a particular locus, and if the blastomere of an embryo—derived of the same couple—is detected to carry the same paternal haplotype as the affected sibling on that locus, the embryo inherited the causal disease variant.
For inferring the inheritance of disease variants in blastomeres of human embryos, we interpreted 1D-MF-derived haplotypes of single cells and visually confirmed the call as well as the diploid nature of the locus (see below) with haplarithm profiles.
Module 4: Supervised Copy-Number Typing of Single-Cell Haplotypes by Integrating SNP logR Values with Haplarithmisis
In this module, the SNP logR values are normalized for %GC-bias and further to the disomic chromosomes identified via discrete SNP calls as well as SNP haplarithm patterns. Finally, normalized and segmented SNP logR values are interpreted via haplarithmisis for the detection of copy-number aberrations.
Raw logR values from SNP arrays are exported from GenomeStudio (Illumina) and are smoothed using a moving average (window of ten SNPs). These averaged logR values are corrected for %GC-bias by a loess-fit and the corrected logR values are preliminarily normalized toward a trimmed mean of the likely normal disomic chromosomes determined by parental scores. The latter are determined on the basis of parent-of-origin values for SNPs as defined by the rules provided in Table S2, as described previously.24 In brief, if for a SNP the father and the mother are respectively “AA” and “BB,” the genotype of a conceptus is expected to be “AB.” However, if “BB” is observed, this can indicate either allelic drop out of the paternal allele, preferential amplification of the maternal allele, a true deletion of the paternal allele, or a true amplification of the maternal allele. This SNP locus then receives a maternal score of 1 and a paternal score of 0, representing the presence of only the maternal allele. All considered scenarios are provided in Table S2. Whereas WGA produces artifacts randomly, leading to occasional aberrant parental scores for SNPs (Figures S5A and S5B), true copy-number aberrations are expected to produce aberrant paternal or maternal scores consistently over many consecutive SNPs located within the anomaly.24 We applied this principle to identify chromosomes that are probably disomic. Paternal and maternal scores, PSk and MSk, respectively, are computed for each chromosome k:
where Pk,j and Mk,j represent the paternal and maternal parent-of-origin value of a SNP j informative for parent-of-origin analysis on chromosome k (Table S2), respectively, and Sk,j has a value of 1 for each SNP j on chromosome k that is informative for parent-of-origin analysis (Table S2).24 Subsequently, a parental relative ratio for each chromosome k was computed:
where Patk and Matk represent the paternal and maternal relative ratios, respectively. These values were used for a preliminary normalization of the logR.
To fine tune the normalization, these preliminary logR profiles were integrated with haplarithm patterns, allowing a final selection of the disomic chromosomes to correct all %GC-corrected logR values of a cell according to a trimmed mean of the logR values of the selected disomic chromosomes for that cell. For all cells, the list of selected disomic chromosomes is provided in Table S3.
The normalized logR values were subsequently segmented by PCF (gamma = 300 for single-cell samples and gamma = 50 for multi-cell samples). To call DNA-copy-number aberrations, the segmented logR values are integrated with haplarithmisis. For nullisomic, monosomic, disomic, uniparental disomic, and trisomic loci, typical haplarithm patterns are expected (Figures 2 and S2). DNA gains and losses were scored when the segmented logR values and the haplarithm patterns across the logR anomaly were concordant. Aberrant logR values (logR < −0.3 or logR > 0.15) not corroborated by a typical haplarithm pattern following visualization were not scored as DNA gain or loss. Aberrations smaller than 3 Mb were not considered with one exception. For PGD cases where one of the partners carried a reciprocal translocation, copy-number changes smaller than 3 Mb in single blastomeres of the conceptus were called when the breakpoint-flanking haplotypes on the chromosomes involved in the reciprocal translocation corroborated the aberrant logR segment.
To determine the accuracy of copy-number profiling, we computed the distances between (1) the a priori known t(1;16) translocation breakpoint on chromosome 16 of family PGD004, which was determined to base resolution using single-cell paired-end sequencing and further validated by Sanger sequencing,20 and (2) the copy-number breakpoints—that result from the unbalanced inheritance of the derivative chromosomes of t(1;16)—detected in the single blastomeres after siCHILD analysis of the SNP logR values.
Module 5: Visualization of the Data Resulting from Modules 1–4
The data from modules 1 to 4 are visualized with R for interpretation of the data.
Genotype Inference Derived from Haplarithm Patterns
To infer discrete SNP genotypes from SNP haplarithm profiles, we first transformed SNP haplarithm BAF segments to discrete SNP haplotypes. To this end, we determined thresholds on segmented P1 and M1 values as well as on segmented P2 and M2 values for diploid chromosomes. These thresholds were determined by fitting a mixture model of two normal distributions to the density of the segmented P1 and M1 values, and similarly for the segmented P2 and M2 values. The distributions near to 0 and 1 were further applied (named “zone0” and “zone1,” respectively) to calculate the two thresholds—an upper threshold on zone0 and a lower threshold on zone1—which include 99% of the data in the “P1 and M1” and “P2 and M2” distributions, or zone0 and zone1, respectively. Subsequently, these thresholds were applied on the P1 and P2 segments in the paternal haplarithms as well as on the M1 and M2 segments in the maternal haplarithms. If the segmented P1 is within zone0 and the segmented P2 is not in zone1, that genomic interval is assigned the paternal H1 haplotype; however, if P2 is within zone1 and P1 is not in zone0, that genomic interval is assigned the paternal H2 haplotype. A similar rationale holds for M1 and M2 to deduce maternal discrete haplotypes. For subsequently inferring discrete SNP genotypes of the cell, the parental H1 and H2 loci determined for the cell were replaced with the respective phased parental SNP genotypes.
Merlin-Based Haplotyping
To compare siCHILD with Merlin,30 we tested the most likely pattern of gene flow (–best command line option) with or without the “pedwipe command line option” to erase genotypes that are flagged as problematic by Merlin’s “–error command line option.” As a requirement of Merlin, every SNP requires a unique genetic distance. To this end, sex-averaged SNP genetic distances extrapolated from the deCODE map31 were used.
SNP Array Chemistries
The HumanCytoSNP-12v2.1 BeadChips (Illumina; GEO: GPL13829) were performed in 3 days according to manufacturer’s instructions using 200 ng of single-cell WGA-DNA (see below) or non-amplified genomic DNA isolated from a large number of cells. Subsequently, the Illumina SNP-typing protocol recommended by the company was shortened to 24 hr as described17 and used for analyses of all samples. GeneChip Human Mapping 250K NspI arrays (Affymetrix; GEO: GPL3718) were performed in 4 days according to the manufacturer’s instructions using 250 ng of single-cell amplified DNA or non-amplified genomic DNA extracted from multiple cells.
Optimization of Single-Cell Genotype Calling
Because single-cell WGA can affect reliable SNP genotyping of the cell and because conventional haplotyping approaches rely on accurate discrete SNP genotype calls, we tested a variety of algorithms and related parameters for single-cell SNP genotyping.
Optimal parameters for in silico single-cell SNP typing were identified by computing the call rates and concordances of single-cell heterozygous and homozygous SNPs with the expected profile determined from a matching multi-cell DNA-sample hybridized to the same platform. For genotype calling of single-cell Illumina HumanCytoSNP-12 BeadChip data, the signal intensities were analyzed by either the GenoSNP32 or the GenCall algorithm. GenCall scores were varied from 0.05 to 0.95 to identify the optimal threshold (= 0.75) and GenoSNP confidence cutoffs were varied from 0.2 to 0.99 to identify the optimal cutoff (= 0.75; see also Figures S4A and S4B). For SNP typing of single-cell GeneChip Human Mapping 250K NspI array data, we analyzed the SNP probe intensities with (1) the dynamic model algorithm33 embedded in the GeneChip Genotyping Analysis Software (GTYPE) v.4.1 (Affymetrix) using a homozygous and heterozygous SNP calling threshold of 0.12,15 (2) the BRLMM algorithm of the Genotyping console 3.0.1 software (Affymetrix) using a scoring threshold of 0.1, and (3) the Birdseed algorithm34 of the APT-1.10.1 package (Affymetrix Power Tools) using the “birdseed” and “birdseed-dev” options. BRLMM and Birdseed were performed on a batch of 105 MDA-amplified single-cell DNA samples. BRLMM has a Bayesian step in the Robust Linear Model with Mahalanobis distance classifier (RLMM).35
Wilcoxon rank-sum tests were conducted to evaluate differences in performance percentages between various combinations of the WGA methods, SNP-typing chemistries, and SNP-typing algorithms. All statistical and computational analyses were performed in R and Matlab (Math Works).
EBV-Lymphoblastoid Cells
To establish the above methods, single cells of two Epstein-Barr virus (EBV)-transformed lymphoblastoid cell lines from two individuals were isolated by mouth-controlled pipetting as described previously.36 Of each individual’s EBV-transformed lymphoblastoid cell line, three single cells were isolated for multiple displacement amplification (MDA) and three single cells for PCR-based PicoPlex (Rubicon Genomics) whole-genome amplification (see below). Lymphoblastoid cell lines were established by EBV transformation of peripheral blood mononuclear cells. In brief, white blood cells were isolated from fresh blood samples by centrifugation using the ACCUSPIN System-Histopaque-1077 (Sigma-Adrich). The cells were washed in saline solution (physiological water) and grown in Dulbecco’s Modified Eagle Medium without HEPES (Life Technologies) supplemented with 10% fetal bovine serum (Life Technologies) in the presence of EBV supernatants (acquired after growth of the virus in B95-8 cells) and 2 μg/ml cyclosporin as an immunosuppressor.
Whole-Genome DNA Amplification of Single Cells
Multiple displacement amplification (MDA, Genomi Phi V2 kit from GE Healthcare) was performed as described by Spits et al.37 The PCR-based whole-genome amplification approach PicoPlex (Rubicon Genomics) was performed according to manufacturer’s instructions. Single-cell amplifications yielding less than 2 μg DNA were not analyzed further.
Embryos and Blastomeres Derived from Couples Opting for PGD
One or two single blastomeres were biopsied from 55 human embryos after IVF and conventional preimplantation genetic diagnosis (PGD, see below) and were amplified with MDA. In Table S4, a detailed overview of the embryos and cells in this study is given. Couples burdened with (1) autosomal-dominant or -recessive disorders, (2) X-linked disorders, (3) reciprocal translocations, or (4) complex chromosomal rearrangement (CCR) participated in the study. The result from the conventional PGD in the clinic was used to demonstrate the accuracy of siCHILD as haplotyping of separate blastomeres of the same embryos allowed inferring the inheritance of disease alleles genome wide, and thus recapitulating the conventional diagnosis.
Embryo Culture and Biopsy
Ovarian stimulation, oocyte retrieval, and in vitro fertilization were performed as described.38 In brief, the embryos were in vitro cultured (Life Global medium at the University Hospital Leuven and Quinns Advantage Protein Plus Medium at the University Hospital Brussels). On days 2 and 3 after fertilization, embryo development was evaluated for the number of blastomeres, the percentage of fragmentation, and the symmetry of the blastomeres. All ≥6-cell stage embryos (Table S4) that had less than 25% fragmentation on day 3 after fertilization were biopsied with a non-contact, 1.48 μm diode laser system (Fertilase; MTG) coupled to an inverted microscope, after first being incubated in Ca2+/Mg2+-free medium. One or two blastomeres were gently aspirated from each embryo for the conventional FISH- or PCR-based PGD. The embryos were immediately transferred to fresh medium and the aspirated blastomeres were separately washed twice with Ca2+/Mg2+-free medium.
Conventional FISH-Based PGD
Nuclei of blastomeres were fixed on Superfrost plus microscope slides (LaboNord) with 0.01N HCl/0.1% Tween 20 solution as described.39 Finally, slides were washed in 1× phosphate-buffered saline (PBS) for 5 min and dehydrated by sequential washing in 70%, 90%, and 100% ethanol. PGD was performed by FISH using locus- and centromere-specific probes (for a list of probes, see Table S4). The quality of the probe mixtures was tested on nuclei derived from stimulated blood lymphocytes from the couple. Slide pre-treatment, co-denaturation, hybridization, and post-hybridization washing steps were performed as described.39 In brief, 1 μl of probe mixture was applied to the slide, covered with a coverslip (10 mm diameter), and sealed with rubber cement. Nuclei and probe were denatured simultaneously on a hot plate at 75°C for 5 min. Hybridization was allowed to take place overnight in a humid chamber at 37°C. After hybridization, excess or non-specific bound probe was removed by subsequent washes in 0.4× SSC/0.3% Igepal CA-630 (Sigma Aldrich) (73°C for 2 min), 2× SSC/0.1% Igepal CA-630 (room temperature [RT] for 1 min), and 2× SSC (RT for 1 min) followed by dehydration through ethanol series. After drying, the slides were mounted in Vectashield anti-fade medium (Vector Laboratories) containing 2.5 ng/ml 4′,6-diamidino-2-phenylindole (DAPI; Boehringer Ingelheim GmbH). Nuclei were examined with an Axioplan 2 microscope (Zeis NV).
Conventional PCR-Based PGD
Tubing and lysis of single cells was carried out as described in Spits et al.37 The analysis of single blastomeres relied on one-step multiplex PCR with the QIAGEN multiplex PCR kit in a final reaction volume of 25 μl. STR markers for each multiplex are listed in Table S4 and primer sequences and detailed PCR reaction protocols are available at request. Indirect strategies used haplotyping results of at least one flanking informative microsatellite marker on each side of the gene locus (specifically for PMP22 and FMR1 in families PGD014 and PGD022, respectively) whereas direct strategies combined marker haplotyping with mutation analysis. Fragment analysis of PCR products was done on an ABI3730xl automated sequencer. For analysis of point mutations (Hb S/C alleles and the RPS19 mutation in PGD018), a direct strategy was applied in which STR marker analysis was combined with mutation detection by mini-sequencing.
Characterization of the Translocation t(1;16)(p36;p12) Derivative Chromosomes
The translocation breakpoint of t(1;16)(p36;p12) was determined by single-cell paired-end sequencing as described.20 Unique primers were designed on the 1p and 16p sequences on each side of the estimated breakpoint for both derivative chromosomes der(16) and der(1) (forward, 5′-CTTCCTAAATTAGTGTGTGGGTGA-3′ and reverse, 5′-TCCAGTCTTCTCAGGTCACG-3′; and forward, 5′-CCCGAGCTGTCTACTGAAGG-3′ and reverse, 5′-ATTTCGATGTTTTTGTGGTTTTCT-3′, respectively) and used to amplify across the breakpoints on der(16) and der(1).20 A primer set proximal to the breakpoint on der(16) was designed to be used as a control PCR (forward, 5′-CGCATGCCTGACTTACAGAA-3′ and reverse, 5′-GACGGGGCACTATCTCATTT-3′). For PCR, a reaction mix with a total volume of 25 μl was prepared, containing platinum Taq polymerase (Invitrogen), 1.5 mM MgCl2, 200 μM of dNTPs, and 0.25 μM primer. The following PCR program was used: 94°C for 4 min, 30 cycles of 94°C for 30 s, 58°C for 30 s, and 72°C for 1 min, and a final extension of 72°C for 7 min. The PCR products were size separated on a 1% agarose gel.
PCR Validation for Family PGD016 Carrying a Deletion Involving Exon 51 of DMD
Primers for SRY (forward, 5′-AGCTCACCGCAGCAACGGGA-3′ and reverse, 5′-TCTAGGTAGGTCTTTGTAGCC-3′), exon 51 of DMD (forward, 5′-AGGAAACTGCCATCTCCAAA-3′ and reverse, 5′-CAAGGTCACCCACCATCAC-3′), and FVIII (forward, 5′-GTACTGGGAATGCACAGCCTA-3′ and reverse, 5′-TCAAATCCCACGTTTTGGATA-3′) were designed to amplify fragments specific for the Y chromosome, the deleted DMD region on the X chromosome, and a control region on the X chromosome, respectively. All PCR reactions were performed as described above. The PCR products were size separated on a 2% agarose gel.
STR-Marker Analysis
To confirm the meiotic nature of trisomies, primers specific for short tandem repeat (STR) polymorphic markers on chromosomes 13 (D13S1254 forward, 5′-AAATTACTTCATCTTGACGATAACA-3′ and reverse, 5′-CTATTGGGGACTGCAGAGAG-3′; D13S1241 forward, 5′-ATAATTGTAATGGCCTTCC-3′ and reverse, 5′-CTCCAGTTGAGTTTGGACC-3′) and 22 (D22S686 forward, 5′-TTGATTACAGAGTGGCTCTGG-3′ and reverse, 5′-TAAGCCCTGTTAGCACCACT-3′) were designed. The reverse primers were 5′-6-FAM tagged. All PCR reactions were performed as described above. The PCR products were size-separated on a 2% agarose gel, followed by fragment size capillary sequencing on the ABI PRISM 3730 Genetic Analyzer (Applied Biosystems). The analysis of the data was performed with the GeneMapper v.4.0 software (Applied Biosystems).
Single-Cell Paired-End Library Preparation and Sequencing
Single-cell MDA products from 19 blastomeres were sheared with the Biorupter (Diagenode) to obtain the fragments ranging from 200 to 600 bp in size. Paired-end sequencing libraries were prepared with TruSeq DNA LT Sample Preparation Kits (Illumina), as described in the manufacturer’s protocol. Libraries were sequenced 101 bases from both ends on Illumina HiSeq 2500 (15 single cells) and Illumina HiSeq 2000 (4 single cells) devices. Sequencing-derived logR and BAF values were determined as described20,40 (Table S5).
Other Statistical and Computational Analysis
To ensure 95% confidence that maximum 5% of siCHILD measurements would produce a discrepant result in comparison with a PCR- or FISH-based (PGD) assay on the same embryo, we applied J. Hanley’s “Rule of Three” in statistics.41
For circular genome-wide illustrations, we applied Circos.42
Ethical Approval
The study was approved by the local Ethical Committees of the University Hospital Leuven and the University Hospital Brussels, as well as the Federal Committee for Medical and Scientific Research on embryos in vitro (ADV_040_UZ-KU Leuven). All couples signed the informed consent forms.
Results
Haplarithmisis, a Process that Converts Error-Prone Single-Cell SNP BAF Values to Haplotypes and Haplotype-Specific Copy-Number Information
The process of haplarithmisis (Material and Methods) is outlined in Figure 1 using as an example a normal autosome in a single cell of a conceptus, whereby both the paternally and maternally inherited homologs of this chromosome underwent a single genetic crossover during parental gametogenesis. In brief, the cell’s SNP BAF values are first assigned to a paternal or maternal category and further across four possible subcategories (M1 and M2 in the maternal category; P1 and P2 in the paternal category) on the basis of defined combinations of informative SNPs in the phased genotypes of the parents (Figure 1). Subsequently, to cause the haplotype blocks of the cell, and concomitantly the copy-number information of these haplotype(s), to emerge, the single-cell SNP BAF values are mirrored around the 0.5 axis for the phased parental SNPs indicated in orange in Figure 1, which are then per subcategory (M1, M2, P1, or P2) segmented and visualized in parental haplarithm plots (Figure 1). The maternal haplarithm depicts the segmented M1 and M2 SNP BAF values of the cell, and the paternal haplarithm shows the segmented P1 and P2 SNP BAF values (Figure 1). Detailed rationalization of these different steps is provided in Material and Methods.
In the haplarithm plots, pairwise breakpoints in the segmented M1-M2 and P1-P2 single-cell SNP BAF values pinpoint the sites of homologous recombination (Material and Methods). Additionally, the positioning of M1-M2 and P1-P2 segments on the y axis (denoting the haplarithm SNP BAF values), as well as the distance between the M1-M2 and P1-P2 segments on the y axis, are characteristic for the copy number of the parental haplotypes in the cell, thereby revealing different natures of genetic anomalies (Figure 2, Material and Methods). Importantly, with the exception of monosomies, the haplarithm signatures also allow tracing the alleles involved in genomic anomalies back to meiotic I (MI), meiotic II (MII), or mitotic segregation errors (Figures 2 and S2). How these haplarithm signatures arise for a variety of genetic anomalies—mitotic or meiotic in origin—in the cell is further detailed illustratively in Figure S2.
Therefore, haplarithmisis has the capacity to leverage and validate both (1) single-cell haplotypes computed from discrete single-cell SNP genotype calls (Figures 3, 4, and 5) as well as (2) DNA copy-number aberrations computed from logR values of microarray or sequence read depth signals (Figures 6 and 7). Below, we prove these principles by single-cell SNP array analyses of human lymphocytes and blastomeres from human cleavage-stage embryos and provide further validation by single-cell sequencing.
Figure 3.
Whole-Genome Single-Cell Haplotyping
(A) Multi-cell and single-cell haplotypes of a disomic chromosome using discrete SNP calls before and after siCHILD analysis.
(B) Multi-cell and single-cell haplotypes of the same chromosome using continuous SNP BAF values before and after siCHILD’s haplarithmisis of the same samples. Histograms and density plots of the SNP BAF profiles before and after haplarithmisis are juxtaposed.
(C and D) Genome-wide haplotypes obtained from the discrete SNP calls via siCHILD.
(E and F) The genome-wide haplarithm profiles of the same samples derived from continuous SNP BAF values.
(G) Concordance of single-cell SNP-haplotype calls (via discrete genotypes) with the reference haplotype of the matching multi-cell DNA samples.
Figure 4.
siCHILD-Based PGD for Mendelian Disorders
Applying siCHILD on single blastomeres, we traced the inheritance of parental disease variants in human IVF embryos.
(A) In a PGD case subject segregating mutant HbS and HbC alleles underlying the autosomal-recessive sickle-cell anemia.
(B) In a PGD case subject with an X-linked Xp22.31 microdeletion recessive disorder.
Figure 5.
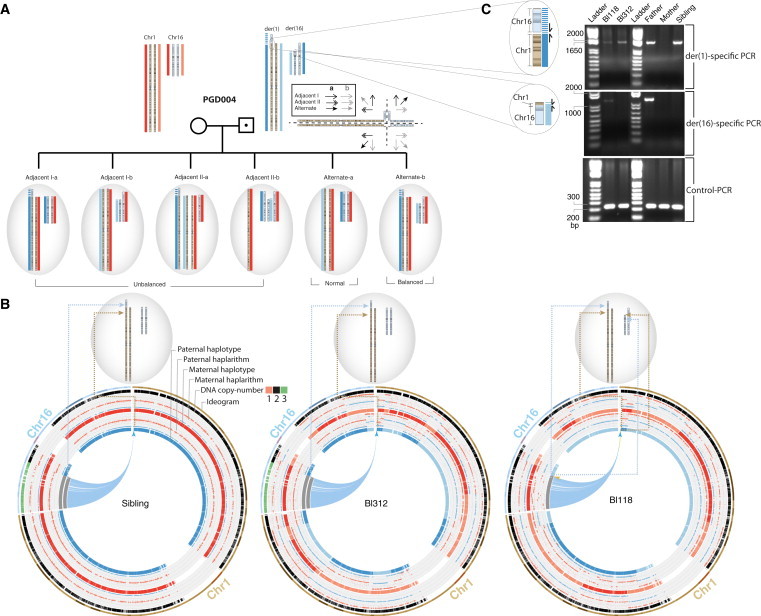
siCHILD-Based PGD for Translocation Carriers
(A) The main possible modes of inheritance of the derivative chromosomes of a reciprocal translocation present in a carrier father to his IVF embryos are depicted. Importantly, by determining the haplotypes flanking the translocation breakpoints, the inheritance of the normal and derivative chromosomes involved in a parental reciprocal translocation can be traced to an embryo.
(B) Applying siCHILD on single blastomeres, we traced the inheritance of the normal and derivative chromosomes of a paternal balanced reciprocal translocation t(1;16)(p36;p12) to his embryos after IVF. Breakpoint flanking haplotypes indicated the inheritance of der(1) and a normal chromosome 16 in cell Bl312, as well as of der(1) and der(16) chromosomes in cell Bl118.
(C) PCR-based validation of the inherited (derivative) chromosomes via primers designed after single-cell paired-end sequencing.
Figure 6.
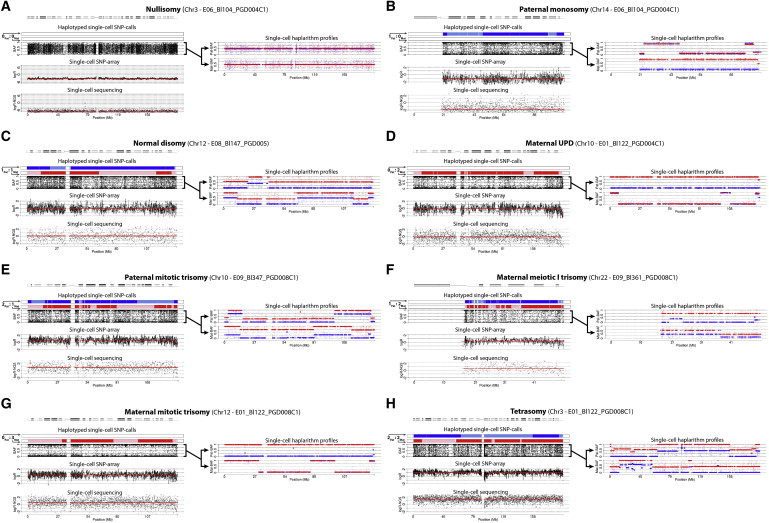
Single-Cell Copy-Number Analysis Supervised by Haplarithmisis: Full Chromosome Anomalies
Different aneuploidies, detected by SNP-array and single-cell sequencing, are authenticated by different characteristic haplarithm patterns. In addition, the parental haplarithm profiles disclose the haplotype-specific copy-number states of the chromosomes in the cells and reveal the parental and meiotic/mitotic origin of the chromosomal anomaly. We show (A) a nullisomy (i.e., 0Pat:0Mat allelic ratio), (B) a paternal monosomy (1Pat:0Mat), (C) a normal disomy (1Pat:1Mat), (D) a mitotic maternal UPD (0Pat:2Mat), (E) a paternal trisomy (2Pat:1Mat), (F) a meiotic maternal trisomy (1Pat:2Mat), (G) a maternal trisomy (0Pat:3Mat), and (H) a tetrasomy (2Pat:2Mat).
Figure 7.
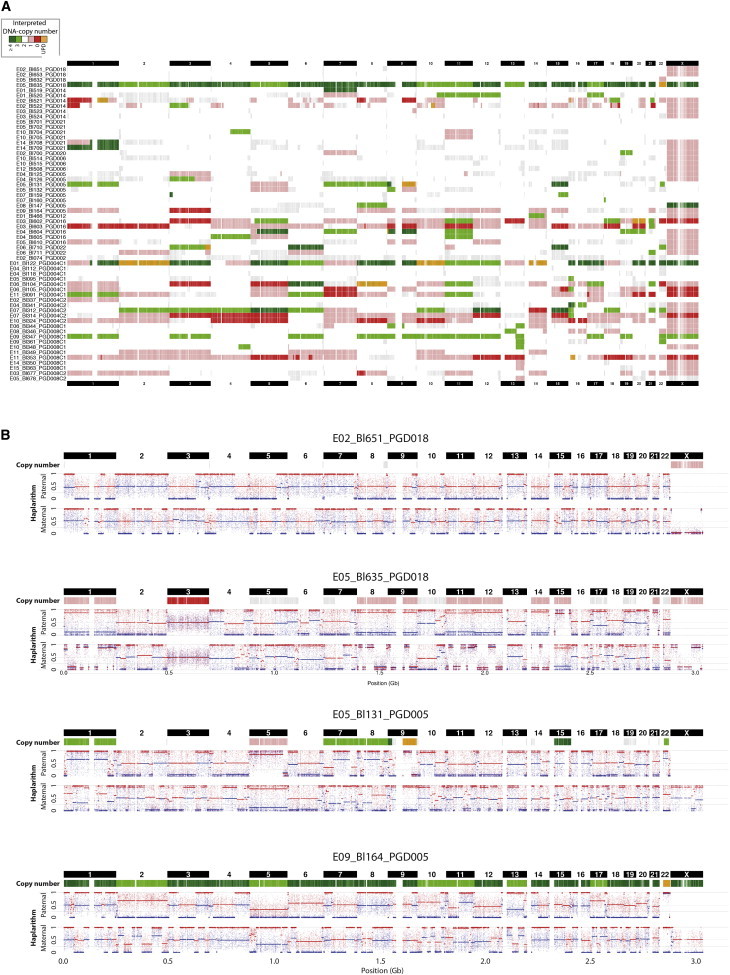
Aneuploidy Screening of All 60 Single Blastomeres
(A) Genome-wide copy-number maps of the single blastomeres. Aberrant logR segments (>0.15 or <−0.3) corroborated by a distinctive haplarithm pattern are depicted. Aberrant logR segments not corroborated by a typical haplarithm pattern are depicted in gray. For cells analyzed in the framework of translocation PGD case subjects, DNA imbalances smaller than 3 Mb corroborated by the haplotype of the derivative chromosome of the parental reciprocal translocation are depicted as well.
(B) Genome-wide copy-number, paternal, and maternal haplarithm profiles of four single blastomeres (for detailed parental haplarithm patterns for each cell, see Figure S14).
Single-Cell Haplotyping Based on Discrete and Continuous SNP Values
Considering that haplotyping from discrete SNP calls (AA, AB, BB) is reliant on accurate genotype calls from the sample, we next optimized SNP calling in single cells (Supplemental Data). SNP arrays and genotyping algorithms are designed to characterize bi-allelic SNPs having a balanced 1:1 allelic ratio in a DNA sample, but single-cell WGA can considerably distort the 1:1 allelic ratio. We isolated 12 cells of two human lymphoblastoid cell lines and evaluated different WGA methods in combination with different SNP typing chemistries as well as conceptually different genotyping and QC-metric algorithms (Supplemental Data, Figures S3 and S4, Material and Methods). Illumina genotyping chemistry, modified to deliver results in less than 24 hr, was selected for all downstream analyses, with MDA as a preferred WGA method (Supplemental Data).
Despite the use of optimized genotyping parameters, the remaining traces of discrete (AA, AB, BB) SNP call errors in the single-cell genotypes, which are not in violation of the Mendelian inheritance rules (Figures S5A and S5B), led to the detection of false recombination sites when state-of-the-art phasing algorithms such as Merlin30 or other textbook phasing principles43 are applied (Figures S6). Considering that these WGA artifacts occur largely random (Figures S5A and S5B), this is a genome-wide problem that prevents us from pinning down the positions of genuine genetic crossovers on the inherited homologs in the cell and as such also to accurately impute genetic mutations entrapped in a haplotype block. To address this problem, we developed a computational workflow, termed siCHILD (Figure S1), that integrates (1) haplarithmisis (Figures 3B, 3E, 3F, and S6) with (2) the segmentation of phased single-cell discrete SNP genotypes into haplotypes by one-dimensional median filters (1D-MF), which remove noise but preserve boundaries27–29 (Figures 3A, 3C, 3D, and S6, Material and Methods).
We first compared the multi-cell haplotypes determined by siCHILD and Merlin, demonstrating that the concordances of the 1D-MF and haplarithm haplotypes determined by siCHILD with the haplotypes obtained from Merlin were >99.99%. This allowed us to confidently employ the multi-cell haplotypes generated by either algorithm as a gold standard reference for assessing the accuracy of the single-cell haplotypes. By comparing single-cell with multi-cell haplotypes inferred by the same algorithm, we found that Merlin-determined single-cell haplotypes were ∼88% and ∼94% concordant with the corresponding multi-cell haplotypes of the lymphoblastoid cell lines by using the “–best command line option” without and with the “–error option,” respectively (Material and Methods). In contrast, the accuracies of the single-cell haplotypes computed after 1D-MF reached 99.71% (±0.09% SD) and are further confirmed by haplarithmisis (99.99% ± 0.02% SD; Table 1, Material and Methods). Within a distance of 150 SNPs flanking a genetic crossover, ∼99% confidence for correct SNP haplotype inference in a cell can be reached via siCHILD (Figure 3G). Moreover, we inferred discrete genotypes for the single cells from both their 1D-MF and haplarithm haplotypes, which were 98.84% (±0.06% SD) and 99.07% (±0.05% SD) concordant with the raw discrete SNP genotypes determined from the multi-cell DNA control, respectively (Table 1, Figures S5C and S5D, Material and Methods). This increased both the accuracy and coverage of the raw single-cell SNP genotypes (Table 1).
Table 1.
Comparison of Methods for Single-Cell Haplotyping and Genotype Inference
|
Single-Cell Haplotyping | ||
|---|---|---|
| Algorithm | Accuracya | Coverageb |
| siCHILD (1D-MF) | 99.71% (±0.09% SD) | 98.82% (±0.16% SD) |
| siCHILD (haplarithmisis) | 99.99% (±0.02% SD) | 96.16% (±0.35% SD) |
| Merlin (–best) | 88.24% (±1.88% SD) | 91.16% (±0% SD) |
| Merlin (–error and–best) | 94.46% (±1.22% SD) | 91.16% (±0% SD) |
| Single-Cell Genotype Inference | ||
| Algorithm | Accuracyc | Coveraged |
| GenCall | 90.57% (±1.75% SD) | 58.8% (±1.82% SD) |
| siCHILD (1D-MF) | 98.84% (±0.06% SD) | 98.95% (±0.19% SD) |
| siCHILD (haplarithmisis) | 99.07% (±0.05% SD) | 91.71% (±0.56% SD) |
| 1D-MF and haplarithmisis consensus | 99.08% (±0.03% SD) | 91.22% (±0.54% SD) |
Average accuracies of maternal haplotypes in single cells to their matching multi-cell DNA sample. Specifically, to compute the accuracies, the single-cell Merlin-inferred haplotypes were compared with multi-cell Merlin-inferred haplotypes; and similarly, single-cell siCHILD-inferred haplotypes were compared with multi-cell siCHILD-inferred haplotypes. As a control, the concordance between multi-cell siCHILD-inferred haplotypes and multi-cell Merlin-inferred haplotypes is >99.99%.
Percentage of SNPs genome wide with a haplotype call.
Average accuracies of inferred genotypes of single cells to the multi-cell DNA genotype.
Percentage of SNPs genome wide with an inferred genotype call.
Validation of siCHILD for Single-Cell Haplotyping by Preimplantation Genetic Diagnosis
Preimplantation genetic diagnosis (PGD) is an optional method for couples to avoid the transmission of disease (risk) alleles to their offspring and is by convention performed by locus-specific FISH- or PCR-based genetic analyses of a single or a pair of blastomeres biopsied from a human embryo on day 3 after in vitro fertilization (IVF).44,45 Embryos diagnosed free of the Mendelian disease allele(s) carried by the parents can subsequently be transferred to the woman’s uterus on day 4 or 5. To validate our method further for haplotyping accuracy, we applied siCHILD to single cells from human cleavage-stage embryos that underwent PGD for Mendelian disorders on separate cells of the same embryo and compared the result of this conventional PGD with the inference of inherited Mendelian disease variants from the single-cell haplotypes.
In total, the genomes of 60 single blastomeres biopsied from 40 embryos derived from 12 different couples were scrutinized by siCHILD after MDA, Illumina SNP typing, and QC filtering (Supplemental Data, Figures S7 and S8). The genome-wide reproducibility was shown by analyzing multiple blastomeres of the same embryo (Table S6 and Figure S9). This analysis was performed for (1) five couples at risk for transmitting an autosomal-dominant or -recessive disorder, (2) four couples carrying an X-linked disorder, (3) two couples carrying a reciprocal translocation, and (4) one couple burdened with a complex chromosomal rearrangement (CCR).
In all cases siCHILD results were proven accurate (Table 2). A synopsis is presented below; a case-by-case description is present in the Supplemental Data, and further per cell per case information is provided in Tables S7–S10.
Table 2.
Overview of the Clinical Validation Study
| Patient Group | Family | Disorder(s) | Number of Embryos | Number of Cells | Conventional PGD | siCHILD Concordant with Conventional PGD at the Disease Gene Locus | Supplemental Tables Detailing per Cell the Diagnosis after siCHILD and Conventional PGD |
|---|---|---|---|---|---|---|---|
| I: couples segregating autosomal-dominant or -recessive disorders | PGD018 | sickle-cell disease | 2 | 4 | PCR-based | yes | Table S7 |
| PGD014 | Charcot-Marie Tooth | 3 | 6 | PCR-based | yes | ||
| PGD021 | cystic fibrosis and Diamond-Blackfan | 3 | 6 | PCR-based | yes | ||
| PGD020 | cystic fibrosis | 1 | 1 | PCR-based | yes | ||
| PGD006 | paternal del(17q) | 2 | 3 | FISH-based | yes | ||
| II: couples segregating X-linked disorders | PGD005 | del(Xp22.31) syndrome | 5 | 8 | – | – | Table S8 |
| PGD012 | hemophilia A | 1 | 1 | FISH-based | yes | ||
| PGD016 | Duchenne muscular dystrophy | 3 | 5 | FISH-based | yesa | ||
| PGD022 | fragile X syndrome | 1 | 2 | PCR-based | yes | ||
| III: couples segregating two-way reciprocal translocations | PGD002 | t(10;16)(q23.2;p13.3) | 1 | 1 | FISH-based | yes | Table S9 |
| PGD004 | t(1;16)(p36.33;p12.1) | 9 | 12 | FISH-based | yesb | ||
| IV: couples segregating three-way reciprocal translocations | PGD008 | t(6;13;16)(p25.1;q21.33;q24.2) | 9 | 11 | FISH-based | yes | Table S10 |
One cell (blastomere 610 of embryo E05 in PGD016) was discordant with the conventional PGD performed on another cell of the same embryo. However, sex and carrier-ship were independently confirmed by PCR assays on the same single-cell WGA product of blastomere 610, demonstrating that siCHILD-based diagnosis was correct (Figure S10).
For PGD004, siCHILD imputation results were also independently confirmed by PCRs specific for chromosomes der(1) and der(16) of t(1;16)(p36.33;p12.1) on the same single-cell WGA products (Figure S10).
Single-Cell Haplotyping by siCHILD Enables Generic PGD for Autosomal Disorders
In five families at risk for an autosomal disorder (Figure S7; PGD018 for sickle cell anemia [MIM: 603903], PGD014 for Charcot-Marie-Tooth disease [MIM: 118220], PGD021 for cystic fibrosis [MIM: 219700] and Diamond-Blackfan anemia [MIM: 105650], PGD020 for cystic fibrosis [MIM: 219700], and PGD006 for a 17q24.2 deletion syndrome), carrier, non-carrier, and affected embryos could be accurately diagnosed by our single-cell haplotype and disease variant imputation analysis (Tables 2 and S7, see Supplemental Data for a description of all case subjects). For instance, in family PGD018, we traced the inheritance of the mutant Hb S and Hb C alleles from a father (Hb S/Hb C) affected with the autosomal-recessive sickle cell disease and a carrier mother (Hb S/Hb B) to their IVF embryos. Four blastomeres derived from two embryos (two blastomeres per embryo) were diagnosed with siCHILD (Table S7). The single-cell haplotypes effectively discriminated a compound heterozygous Hb Cpat/Hb Smat embryo from a homozygous Hb Spat/Hb Smat embryo (Figure 4A), which was confirmed by conventional PCR-based PGD. Furthermore, siCHILD also enabled diagnosing an embryo for multiple monogenic disorders in a single assay (Tables 2 and S7, Supplemental Data).
Single-Cell Haplotyping by siCHILD Enables Generic PGD for X-Linked Disorders
In four families at risk for an X-linked recessive disorder (Figure S7; PGD005 for a microdeletion Xp22.31 syndrome, PGD012 for hemophilia A [MIM: 306700], PGD016 for Duchenne muscular dystrophy [MIM: 310200], and PGD022 for fragile X syndrome [MIM: 300624]), not only normal and affected male embryos could be distinguished, but also carrier and non-carrier female embryos (Figure 4B, Tables 2 and S8), as well as embryos carrying abnormal copy-number states of the X chromosome (Figure 7, Tables 2 and S8). PGD by conventional methods on separate cells biopsied from the same embryos confirmed siCHILD-determined haplotypes, except in one blastomere (Table S8). We subsequently confirmed siCHILD’s diagnosis of cell Bl610 in PGD016 by PCR assays to be correct (Figures S10A–S10C, Table S8).
Single-Cell Haplotyping by siCHILD Enables Generic PGD for Simple and Complex Translocations
After reciprocal translocation of chromosomes, the alleles of the exchanged chromosome fragments are tied up in a new haplotype (Figure 5A). Therefore, we hypothesized that haplotyping of the SNPs flanking the translocation’s breakpoints allows tracing the inheritance of the derivative chromosomes of the reciprocal translocation from a carrier parent to his/her conceptuses. Depending on the (mal)segregation of the chromosomes involved in the translocation during meiosis I in the carrier parent, embryos can inherit either an unbalanced or a balanced karyotype, where the latter might be due either to the inheritance of all derivative chromosomes of the reciprocal translocation or to the inheritance of the normal chromosomes (Figure 5A). To test the hypothesis, we applied our method on single blastomeres from IVF embryos of three couples burdened with either simple or complex reciprocal translocations.
In PGD004 affected with a paternal t(1;16)(p36;p12), three embryos (Table S9; cycle 1, E01 and E04, and cycle 2, E02) were identified having both derivative chromosomes of the reciprocal translocation by single-cell haplotype analysis. These result from an alternate dissolution of the meiotic quadrivalent (Figure 5A), thereby leading to the inheritance of a balanced DNA configuration of the paternal t(1;16) chromosomes. To unambiguously confirm these results, we mapped the breakpoint of the paternal t(1;16)(p36;p12) to base resolution by single-cell paired-end sequencing of one blastomere20 and subsequently designed PCRs across the translocation breakpoints that can discriminate the derivative chromosome der(1) from the der(16). Applying these PCRs on the arrayed single-cell MDA products confirmed the accuracy of our imputed diagnosis (Figures 5B, 5C, and S10D–S10F, Table S9). Furthermore, five embryos (Table S9; cycle 1, E05, E06, and E11, and cycle 2, E04 and E07) carried a single-cell haplotype configuration consistent with an adjacent 1 dissolution of the meiotic quadrivalent leading to an unbalanced karyotype (Figures 5B, 5C, and S10D–S10F). Copy-number analysis (see below) revealed six embryos that experienced instability of chromosomes 1 or 16 (Figure 7, Table S9; PGD004 cycle 1, E01, E06, and E11, and cycle 2, E02, E04, and E10).
Similar results were obtained for PGD002 with a maternal t(10;16)(q23;p13.3) (Table S9; PGD002, E02) and for PGD008 burdened with a maternal three-way complex chromosomal rearrangement (CCR): t(6;13;16)(p25.1;q21.33;q24.2) (Supplemental Data, Table S10). In addition, all conventional FISH-based PGD results confirmed the accuracy of single-cell haplotyping.
Hence, we confirmed that haplotyping of translocation-breakpoint flanking SNPs in single blastomeres allows distinguishing the different modes of inheritance of the chromosomes involved in a reciprocal translocation.
Haplarithmisis Enables Single-Cell Copy-Number Analysis
Methods that can sift real DNA copy-number changes from WGA artifacts are paramount for single-cell analysis in general and for genetic diagnosis in particular. Haplarithmisis enables deciphering of DNA copy-number status with concomitant parent-of-origin and mitotic/meiotic origin information from noisy single-cell SNP BAF values.
To prove the principle, Figures 6 and S11 display well-validated full chromosome (nullisomy, monosomy, uniparental isodisomy, trisomy) and segmental anomalies of different natures in single cells, identified by both SNP array analysis and single-cell sequencing. Not only is each of these different aneuploidy natures corroborated by the distinctive and typical single-cell haplarithm pattern, but also the parental origin as well as the mitotic or meiotic nature of the anomaly is blueprinted in the haplarithm signature (Figures 2, 6, and S11). Inherently, the resolution limits are defined by the amount of SNPs sampled and their phase informative fraction. From all segmental DNA deletions (n = 13) and duplications (n = 13), ranging from 1.07 Mb to 47.42 Mb in size and known from the unbalanced inheritance of derivative chromosomes (PGD004, PGD002, PGD008), those greater than 4.4 Mb were detected on the basis of approximately 88K informative SNPs genome wide. The accuracy of copy-number breakpoints resulting from our method was on average 0.51 Mb (±0.48 SD; Material and Methods).
When performed on the 60 blastomeres, 63% (or 65% of the 40 embryos) were found to contain at least one full-chromosome aneuploidy, and 45% (or 53% of the 40 embryos) carried at least one de novo segmental chromosomal aberration not expected due to the inheritance of an unbalanced translocation. All DNA copy-number and copy-neutral aberrations consistent with haplarithm patterns are shown in Figure 7. To further validate these DNA copy-number landscapes and confirm the observed mosaicism between sister blastomeres of one embryo, we selected 19 single blastomeres for single-cell sequencing. The siCHILD- and sequencing-based copy-number profiles were largely identical (Figure S12).
Haplarithmisis disclosed two embryos (E08 and E09 from PGD008) to contain a meiotic trisomy for, respectively, chromosome 13 and 22, both resulting from a maternal meiotic MI segregation error. The trisomy was confirmed by next-generation sequencing (Figure S12) and its meiotic origin further by polymorphic short tandem repeat (STR)-marker analysis (Figures S13A and S13B). All other trisomies were mitotically acquired (∼67% paternal versus ∼33% maternal in origin) (Figures 7 and S14). Interestingly, one cell demonstrated for deleted chromosomes a haplarithm pattern that is typical for mitotic duplications, which reconciles with a tetraploid cell that has lost chromosomes (Figures 7 and S14; E05, Bl635). These are observations to which conventional copy-number analysis algorithms would be blind.
In conclusion, of 20 embryos with two blastomeres analyzed, 4 (20%; 2 male and 2 female embryos) were normal, 1 (5%) was mosaic diploid/aneuploid, and all 15 remaining embryos (75%) were mosaic aneuploid in both cells. Of the 20 embryos with one blastomere analyzed, 1 (5%) was a normal male cell, 3 (15%) were aneuploid solely due to the inheritance of an unbalanced derivative chromosome configuration from a parent, and 16 (80%) carried various aneuploidies.
Discussion
Single-cell DNA haplotyping and copy-number typing methods are imperative for investigating cell-to-cell variation in health and disease22,23 and are important for the development of generic methods for clinical practice.13,46–49 Since a genome-wide blueprint of the parental haplotypes within a single cell is determined, our technique enables screening embryos for a single or multiple Mendelian traits or diseases at once, as well as for a combination of ancient genetic variants conferring susceptibility to complex diseases, which are increasingly being discovered in large-scale genome-wide association studies.50 These features make the technology generic and broaden the scope of genetic diagnosis of preimplantation embryos to every disease or trait with known genetic architecture determined by parental non-mitochondrial genetic variants in a single assay.
In the analysis of single-cell genomes from human embryos after IVF, state-of-the-art phasing methods by Merlin30 and other methods for haplotyping diploid single cells suffer from error-prone discrete SNP genotypes enforced by a genotyping algorithm.13,46,51 Genotyping algorithms, especially those that interpret microarray data, output discrete diploid SNP calls (AA, AB, BB) and thus make genotype errors across copy-number variations or alleles distorted by WGA. Our method applies haplarithmisis, enabling haplotyping and simultaneous haplotype-specific copy-number analysis of single cells, which effectively manages allelic distortions of SNP B allele frequencies. Because SNP BAF values can be obtained from both SNP arrays and mapped single-cell sequencing reads, the method is platform independent. In comparison with the direct deterministic phasing (DDP) method,11 our approach broadens the application of single-cell haplotyping to common and rare cells with no requirement for the cell to reside in metaphase of the cell cycle to enable individual chromosome sorting and SNP typing. In comparison with long fragment read (LFR) sequencing, our method is readily applicable to single cells whereas LFR is limited to pools of at least ten cells.52 In comparison with population-based SNP BAF haplotyping methods that allow analysis of DNA samples extracted from many cells,53,54 our family-based approach pinpoints genuine parental crossovers and is effective on data obtained from a single cell. Moreover, we anticipate that haplarithmisis will help unravel the mechanistic origin of constitutional genetic anomalies detected in multi-cell DNA samples, as well as detect low-grade mosaicism of haplotypes.
In addition to haplotyping, haplarithmisis leverages single-cell copy-number profiles in several ways. (1) The aneuploidy and its nature (including nullisomic, monosomic, uniparental disomic, and trisomic loci) are independently confirmed by distinctive haplotyped SNP BAF patterns, thus providing unprecedented confidence of copy-number calls at the single-cell level. Random stochastic allelic distortions resulting from WGA artifacts usually operate on distances less than 10 kb55 and thus it is unexpected that WGA in itself would invoke the specific BAF patterns over larger distances. (2) The haplarithm patterns allow determining the parental origin as well as the mitotic or meiotic nature of the chromosomal anomaly (with the exception of monosomies), which is relevant not only for understanding the etiology of aneuploidies, but also for clinical practice. Because aneuploidies from meiotic chromosome segregation errors detected in a blastomere biopsied from a human embryo have a high likelihood to be perpetuated in all daughter cells of the original zygote, such embryos will rarely survive to term and will either be lost before implantation or result in miscarriages. Selection against such embryos has been speculated to improve IVF-PGD outcome.56 In contrast, aneuploidies that are mitotic in origin have no predictive value for the numerical status of the chromosome in the blastomeres remaining in the embryo after biopsy, and thus probably no predictive value for IVF success.57,58 (3) Haplarithm patterns allow distinguishing aberrant tetraploid from aberrant diploid cells and selecting chromosomes or loci for proper ploidy correction in individual cells prone to chromosome instability.
Most current PGD approaches identify the genetic lesion directly by either PCR or FISH,59–61 requiring a labor-intensive design and validation process of such family- and locus-specific assays, resulting in long waiting lists. Particular couples might even not be offered PGD because these simple assays are inadequate for diagnosing the inheritance of complex chromosomal architectures from the parents. We show that an indirect method for mapping of a genetic mutation via single-cell haplotyping is equally accurate and additionally generic, irrespective of the location of the mutation or the mode of inheritance of the Mendelian disorder. We furthermore demonstrate that single-cell haplotyping outperforms conventional PGD by enabling the differentiation of embryos having a balanced copy number due to the inheritance of the derivative chromosomes of a reciprocal translocation from embryos that are copy-number neutral due to the inheritance of the normal chromosomes.
In conclusion, we developed and validated a genome analysis approach that enables concurrent haplo- and copy-number typing at the single-cell level in a genome-wide fashion, demonstrating applications in developing basic understanding of genomes and in the clinic.
Acknowledgments
We are grateful to all families that participated in this study (families were treated at the Leuven University Fertility center, Leuven University Hospital, Belgium) and the PGD Clinic of the UZ Brussel. We thank S. Jackmaert, Dr. E. Vanneste, and N. Ardeshirdavani for their help with the SNP arrays and initiating the 24 hr protocol. We thank Dr. A. Destouni for critical reading of the manuscript. Funding for this study is provided by the Agency for Innovation by Science and Technology (IWT) (TBM-090878 to J.R.V., T.V., Y.M., and T.D.), the Research Foundation Flanders (FWO) (G.A093.11N to T.V. and J.R.V.), the European Union's Research and Innovation funding programme (FP7-PEOPLE-2012-IAPP SARM: 324509 to J.R.V., T.V., and T.D.), the University of Leuven (KU Leuven), SymBioSys (PFV/10/016 to Y.M., J.R.V., and T.V.), and Auxilio (to T.V.). M.Z.E., J.R.V., and T.V. are co-inventors on patent applications ZL910050-PCT/EP2011/060211-WO/2011/157846 “Methods for haplotyping single cells” and ZL913096-PCT/EP2014/068315-WO/2015/028576 “Haplotyping and copy-number typing using polymorphic variant allelic frequencies.” T.V. and J.R.V. are co-inventors on patent application ZL912076-PCT/EP2013/070858 “High-throughput genotyping by sequencing.” J.R.V. and Y.M. are co-founders and stockholders of Cartagenia.
Published: May 14, 2015
Contributor Information
Joris R. Vermeesch, Email: joris.vermeesch@med.kuleuven.be.
Thierry Voet, Email: thierry.voet@med.kuleuven.be.
Accession Numbers
All SNP array data generated in this study are deposited in the NCBI GEO database under accession number GEO: GSE60910. The single-cell sequencing data are available upon request to the Data Access Committee of the University Hospital of KU Leuven via the corresponding author.
Supplemental Data
Web Resources
The URLs for data presented herein are as follows:
Affymetrix Power Tools, http://www.affymetrix.com/estore/partners_programs/programs/developer/tools/powertools.affx
Circos, http://circos.ca/
Gene Expression Omnibus (GEO), http://www.ncbi.nlm.nih.gov/geo/
Illumina’s GenomeStudio software, http://www.illumina.com/applications/microarrays/microarray-software/genomestudio.html
OMIM, http://www.omim.org/
R statistical software, http://www.r-project.org/
References
- 1.Baudat F., Imai Y., de Massy B. Meiotic recombination in mammals: localization and regulation. Nat. Rev. Genet. 2013;14:794–806. doi: 10.1038/nrg3573. [DOI] [PubMed] [Google Scholar]
- 2.Tewhey R., Bansal V., Torkamani A., Topol E.J., Schork N.J. The importance of phase information for human genomics. Nat. Rev. Genet. 2011;12:215–223. doi: 10.1038/nrg2950. [DOI] [PMC free article] [PubMed] [Google Scholar]
- 3.Vanneste E., Voet T., Le Caignec C., Ampe M., Konings P., Melotte C., Debrock S., Amyere M., Vikkula M., Schuit F. Chromosome instability is common in human cleavage-stage embryos. Nat. Med. 2009;15:577–583. doi: 10.1038/nm.1924. [DOI] [PubMed] [Google Scholar]
- 4.van Echten-Arends J., Mastenbroek S., Sikkema-Raddatz B., Korevaar J.C., Heineman M.J., van der Veen F., Repping S. Chromosomal mosaicism in human preimplantation embryos: a systematic review. Hum. Reprod. Update. 2011;17:620–627. doi: 10.1093/humupd/dmr014. [DOI] [PubMed] [Google Scholar]
- 5.Voet T., Vanneste E., Vermeesch J.R. The human cleavage stage embryo is a cradle of chromosomal rearrangements. Cytogenet. Genome Res. 2011;133:160–168. doi: 10.1159/000324235. [DOI] [PubMed] [Google Scholar]
- 6.Wang J., Fan H.C., Behr B., Quake S.R. Genome-wide single-cell analysis of recombination activity and de novo mutation rates in human sperm. Cell. 2012;150:402–412. doi: 10.1016/j.cell.2012.06.030. [DOI] [PMC free article] [PubMed] [Google Scholar]
- 7.Lu S., Zong C., Fan W., Yang M., Li J., Chapman A.R., Zhu P., Hu X., Xu L., Yan L. Probing meiotic recombination and aneuploidy of single sperm cells by whole-genome sequencing. Science. 2012;338:1627–1630. doi: 10.1126/science.1229112. [DOI] [PMC free article] [PubMed] [Google Scholar]
- 8.Hou Y., Fan W., Yan L., Li R., Lian Y., Huang J., Li J., Xu L., Tang F., Xie X.S., Qiao J. Genome analyses of single human oocytes. Cell. 2013;155:1492–1506. doi: 10.1016/j.cell.2013.11.040. [DOI] [PubMed] [Google Scholar]
- 9.Kirkness E.F., Grindberg R.V., Yee-Greenbaum J., Marshall C.R., Scherer S.W., Lasken R.S., Venter J.C. Sequencing of isolated sperm cells for direct haplotyping of a human genome. Genome Res. 2013;23:826–832. doi: 10.1101/gr.144600.112. [DOI] [PMC free article] [PubMed] [Google Scholar]
- 10.Alfarawati S., Fragouli E., Colls P., Wells D. Embryos of robertsonian translocation carriers exhibit a mitotic interchromosomal effect that enhances genetic instability during early development. PLoS Genet. 2012;8:e1003025. doi: 10.1371/journal.pgen.1003025. [DOI] [PMC free article] [PubMed] [Google Scholar]
- 11.Fan H.C., Wang J., Potanina A., Quake S.R. Whole-genome molecular haplotyping of single cells. Nat. Biotechnol. 2011;29:51–57. doi: 10.1038/nbt.1739. [DOI] [PMC free article] [PubMed] [Google Scholar]
- 12.Browning S.R., Browning B.L. Haplotype phasing: existing methods and new developments. Nat. Rev. Genet. 2011;12:703–714. doi: 10.1038/nrg3054. [DOI] [PMC free article] [PubMed] [Google Scholar]
- 13.Handyside A.H., Harton G.L., Mariani B., Thornhill A.R., Affara N., Shaw M.A., Griffin D.K. Karyomapping: a universal method for genome wide analysis of genetic disease based on mapping crossovers between parental haplotypes. J. Med. Genet. 2010;47:651–658. doi: 10.1136/jmg.2009.069971. [DOI] [PubMed] [Google Scholar]
- 14.Treff N.R., Su J., Tao X., Northrop L.E., Scott R.T., Jr. Single-cell whole-genome amplification technique impacts the accuracy of SNP microarray-based genotyping and copy number analyses. Mol. Hum. Reprod. 2011;17:335–343. doi: 10.1093/molehr/gaq103. [DOI] [PMC free article] [PubMed] [Google Scholar]
- 15.Konings P., Vanneste E., Jackmaert S., Ampe M., Verbeke G., Moreau Y., Vermeesch J.R., Voet T. Microarray analysis of copy number variation in single cells. Nat. Protoc. 2012;7:281–310. doi: 10.1038/nprot.2011.426. [DOI] [PubMed] [Google Scholar]
- 16.Geigl J.B., Obenauf A.C., Waldispuehl-Geigl J., Hoffmann E.M., Auer M., Hörmann M., Fischer M., Trajanoski Z., Schenk M.A., Baumbusch L.O., Speicher M.R. Identification of small gains and losses in single cells after whole genome amplification on tiling oligo arrays. Nucleic Acids Res. 2009;37:e105. doi: 10.1093/nar/gkp526. [DOI] [PMC free article] [PubMed] [Google Scholar]
- 17.Johnson D.S., Gemelos G., Baner J., Ryan A., Cinnioglu C., Banjevic M., Ross R., Alper M., Barrett B., Frederick J. Preclinical validation of a microarray method for full molecular karyotyping of blastomeres in a 24-h protocol. Hum. Reprod. 2010;25:1066–1075. doi: 10.1093/humrep/dep452. [DOI] [PMC free article] [PubMed] [Google Scholar]
- 18.Navin N., Kendall J., Troge J., Andrews P., Rodgers L., McIndoo J., Cook K., Stepansky A., Levy D., Esposito D. Tumour evolution inferred by single-cell sequencing. Nature. 2011;472:90–94. doi: 10.1038/nature09807. [DOI] [PMC free article] [PubMed] [Google Scholar]
- 19.Zong C., Lu S., Chapman A.R., Xie X.S. Genome-wide detection of single-nucleotide and copy-number variations of a single human cell. Science. 2012;338:1622–1626. doi: 10.1126/science.1229164. [DOI] [PMC free article] [PubMed] [Google Scholar]
- 20.Voet T., Kumar P., Van Loo P., Cooke S.L., Marshall J., Lin M.L., Zamani Esteki M., Van der Aa N., Mateiu L., McBride D.J. Single-cell paired-end genome sequencing reveals structural variation per cell cycle. Nucleic Acids Res. 2013;41:6119–6138. doi: 10.1093/nar/gkt345. [DOI] [PMC free article] [PubMed] [Google Scholar]
- 21.McConnell M.J., Lindberg M.R., Brennand K.J., Piper J.C., Voet T., Cowing-Zitron C., Shumilina S., Lasken R.S., Vermeesch J.R., Hall I.M., Gage F.H. Mosaic copy number variation in human neurons. Science. 2013;342:632–637. doi: 10.1126/science.1243472. [DOI] [PMC free article] [PubMed] [Google Scholar]
- 22.Shapiro E., Biezuner T., Linnarsson S. Single-cell sequencing-based technologies will revolutionize whole-organism science. Nat. Rev. Genet. 2013;14:618–630. doi: 10.1038/nrg3542. [DOI] [PubMed] [Google Scholar]
- 23.Macaulay I.C., Voet T. Single cell genomics: advances and future perspectives. PLoS Genet. 2014;10:e1004126. doi: 10.1371/journal.pgen.1004126. [DOI] [PMC free article] [PubMed] [Google Scholar]
- 24.Voet T., Vanneste E., Van der Aa N., Melotte C., Jackmaert S., Vandendael T., Declercq M., Debrock S., Fryns J.P., Moreau Y. Breakage-fusion-bridge cycles leading to inv dup del occur in human cleavage stage embryos. Hum. Mutat. 2011;32:783–793. doi: 10.1002/humu.21502. [DOI] [PubMed] [Google Scholar]
- 25.Peiffer D.A., Le J.M., Steemers F.J., Chang W., Jenniges T., Garcia F., Haden K., Li J., Shaw C.A., Belmont J. High-resolution genomic profiling of chromosomal aberrations using Infinium whole-genome genotyping. Genome Res. 2006;16:1136–1148. doi: 10.1101/gr.5402306. [DOI] [PMC free article] [PubMed] [Google Scholar]
- 26.Nilsen G., Liestøl K., Van Loo P., Moen Vollan H.K., Eide M.B., Rueda O.M., Chin S.F., Russell R., Baumbusch L.O., Caldas C. Copynumber: Efficient algorithms for single- and multi-track copy number segmentation. BMC Genomics. 2012;13:591. doi: 10.1186/1471-2164-13-591. [DOI] [PMC free article] [PubMed] [Google Scholar]
- 27.Bovik A.C., Huang T.S., Munson D.C. The effect of median filtering on edge estimation and detection. IEEE Trans. Pattern Anal. Mach. Intell. 1987;9:181–194. doi: 10.1109/tpami.1987.4767894. [DOI] [PubMed] [Google Scholar]
- 28.Gallagher N.C., Wise G.L. A theoretical-analysis of the properties of median filters. IEEE Trans. Acoust. Speech Signal Process. 1981;29:1136–1141. [Google Scholar]
- 29.Ben Hamza A., Luque-Escamilla P.L., Martinez-Aroza J., Roman-Roldan R. Removing noise and preserving details with relaxed median filters. J. Math. Imaging Vis. 1999;11:161–177. [Google Scholar]
- 30.Abecasis G.R., Cherny S.S., Cookson W.O., Cardon L.R. Merlin—rapid analysis of dense genetic maps using sparse gene flow trees. Nat. Genet. 2002;30:97–101. doi: 10.1038/ng786. [DOI] [PubMed] [Google Scholar]
- 31.Kong A., Gudbjartsson D.F., Sainz J., Jonsdottir G.M., Gudjonsson S.A., Richardsson B., Sigurdardottir S., Barnard J., Hallbeck B., Masson G. A high-resolution recombination map of the human genome. Nat. Genet. 2002;31:241–247. doi: 10.1038/ng917. [DOI] [PubMed] [Google Scholar]
- 32.Giannoulatou E., Yau C., Colella S., Ragoussis J., Holmes C.C. GenoSNP: a variational Bayes within-sample SNP genotyping algorithm that does not require a reference population. Bioinformatics. 2008;24:2209–2214. doi: 10.1093/bioinformatics/btn386. [DOI] [PubMed] [Google Scholar]
- 33.Di X., Matsuzaki H., Webster T.A., Hubbell E., Liu G., Dong S., Bartell D., Huang J., Chiles R., Yang G. Dynamic model based algorithms for screening and genotyping over 100 K SNPs on oligonucleotide microarrays. Bioinformatics. 2005;21:1958–1963. doi: 10.1093/bioinformatics/bti275. [DOI] [PubMed] [Google Scholar]
- 34.Korn J.M., Kuruvilla F.G., McCarroll S.A., Wysoker A., Nemesh J., Cawley S., Hubbell E., Veitch J., Collins P.J., Darvishi K. Integrated genotype calling and association analysis of SNPs, common copy number polymorphisms and rare CNVs. Nat. Genet. 2008;40:1253–1260. doi: 10.1038/ng.237. [DOI] [PMC free article] [PubMed] [Google Scholar]
- 35.Rabbee N., Speed T.P. A genotype calling algorithm for affymetrix SNP arrays. Bioinformatics. 2006;22:7–12. doi: 10.1093/bioinformatics/bti741. [DOI] [PubMed] [Google Scholar]
- 36.Le Caignec C., Spits C., Sermon K., De Rycke M., Thienpont B., Debrock S., Staessen C., Moreau Y., Fryns J.P., Van Steirteghem A. Single-cell chromosomal imbalances detection by array CGH. Nucleic Acids Res. 2006;34:e68. doi: 10.1093/nar/gkl336. [DOI] [PMC free article] [PubMed] [Google Scholar]
- 37.Spits C., Le Caignec C., De Rycke M., Van Haute L., Van Steirteghem A., Liebaers I., Sermon K. Whole-genome multiple displacement amplification from single cells. Nat. Protoc. 2006;1:1965–1970. doi: 10.1038/nprot.2006.326. [DOI] [PubMed] [Google Scholar]
- 38.Van der Auwera I., Debrock S., Spiessens C., Afschrift H., Bakelants E., Meuleman C., Meeuwis L., D’Hooghe T.M. A prospective randomized study: day 2 versus day 5 embryo transfer. Hum. Reprod. 2002;17:1507–1512. doi: 10.1093/humrep/17.6.1507. [DOI] [PubMed] [Google Scholar]
- 39.Melotte C., Debrock S., D’Hooghe T., Fryns J.P., Vermeesch J.R. Preimplantation genetic diagnosis for an insertional translocation carrier. Hum. Reprod. 2004;19:2777–2783. doi: 10.1093/humrep/deh539. [DOI] [PubMed] [Google Scholar]
- 40.Møller E.K., Kumar P., Voet T., Peterson A., Van Loo P., Mathiesen R.R., Fjelldal R., Grundstad J., Borgen E., Baumbusch L.O. Next-generation sequencing of disseminated tumor cells. Front. Oncol. 2013;3:320. doi: 10.3389/fonc.2013.00320. [DOI] [PMC free article] [PubMed] [Google Scholar]
- 41.Hanley J.A., Lippman-Hand A. If nothing goes wrong, is everything all right? Interpreting zero numerators. JAMA. 1983;249:1743–1745. [PubMed] [Google Scholar]
- 42.Krzywinski M., Schein J., Birol I., Connors J., Gascoyne R., Horsman D., Jones S.J., Marra M.A. Circos: an information aesthetic for comparative genomics. Genome Res. 2009;19:1639–1645. doi: 10.1101/gr.092759.109. [DOI] [PMC free article] [PubMed] [Google Scholar]
- 43.Strachan T., Read A.P. Garland Science, Taylor & Francis Group; New York: 2011. Human Molecular Genetics. [Google Scholar]
- 44.Braude P., Pickering S., Flinter F., Ogilvie C.M. Preimplantation genetic diagnosis. Nat. Rev. Genet. 2002;3:941–953. doi: 10.1038/nrg953. [DOI] [PubMed] [Google Scholar]
- 45.Simpson J.L. Preimplantation genetic diagnosis at 20 years. Prenat. Diagn. 2010;30:682–695. doi: 10.1002/pd.2552. [DOI] [PubMed] [Google Scholar]
- 46.Natesan S.A., Bladon A.J., Coskun S., Qubbaj W., Prates R., Munne S., Coonen E., Dreesen J.C., Stevens S.J., Paulussen A.D. Genome-wide karyomapping accurately identifies the inheritance of single-gene defects in human preimplantation embryos in vitro. Genet. Med. 2014;16:838–845. doi: 10.1038/gim.2014.45. [DOI] [PMC free article] [PubMed] [Google Scholar]
- 47.Van der Aa N., Zamani Esteki M., Vermeesch J.R., Voet T. Preimplantation genetic diagnosis guided by single-cell genomics. Genome Med. 2013;5:71. doi: 10.1186/gm475. [DOI] [PMC free article] [PubMed] [Google Scholar]
- 48.Speicher M.R. Single-cell analysis: toward the clinic. Genome Med. 2013;5:74. doi: 10.1186/gm478. [DOI] [PMC free article] [PubMed] [Google Scholar]
- 49.Handyside A.H. 24-chromosome copy number analysis: a comparison of available technologies. Fertil. Steril. 2013;100:595–602. doi: 10.1016/j.fertnstert.2013.07.1965. [DOI] [PubMed] [Google Scholar]
- 50.McCarthy M.I., Abecasis G.R., Cardon L.R., Goldstein D.B., Little J., Ioannidis J.P., Hirschhorn J.N. Genome-wide association studies for complex traits: consensus, uncertainty and challenges. Nat. Rev. Genet. 2008;9:356–369. doi: 10.1038/nrg2344. [DOI] [PubMed] [Google Scholar]
- 51.Altarescu G., Zeevi D.A., Zeligson S., Perlberg S., Eldar-Geva T., Margalioth E.J., Levy-Lahad E., Renbaum P. Familial haplotyping and embryo analysis for Preimplantation genetic diagnosis (PGD) using DNA microarrays: a proof of principle study. J. Assist. Reprod. Genet. 2013;30:1595–1603. doi: 10.1007/s10815-013-0044-8. [DOI] [PMC free article] [PubMed] [Google Scholar]
- 52.Peters B.A., Kermani B.G., Sparks A.B., Alferov O., Hong P., Alexeev A., Jiang Y., Dahl F., Tang Y.T., Haas J. Accurate whole-genome sequencing and haplotyping from 10 to 20 human cells. Nature. 2012;487:190–195. doi: 10.1038/nature11236. [DOI] [PMC free article] [PubMed] [Google Scholar]
- 53.Nik-Zainal S., Van Loo P., Wedge D.C., Alexandrov L.B., Greenman C.D., Lau K.W., Raine K., Jones D., Marshall J., Ramakrishna M., Breast Cancer Working Group of the International Cancer Genome Consortium The life history of 21 breast cancers. Cell. 2012;149:994–1007. doi: 10.1016/j.cell.2012.04.023. [DOI] [PMC free article] [PubMed] [Google Scholar]
- 54.Vattathil S., Scheet P. Haplotype-based profiling of subtle allelic imbalance with SNP arrays. Genome Res. 2013;23:152–158. doi: 10.1101/gr.141374.112. [DOI] [PMC free article] [PubMed] [Google Scholar]
- 55.Lasken R.S., Stockwell T.B. Mechanism of chimera formation during the multiple displacement amplification reaction. BMC Biotechnol. 2007;7:19. doi: 10.1186/1472-6750-7-19. [DOI] [PMC free article] [PubMed] [Google Scholar]
- 56.Wilton L. Preimplantation genetic diagnosis for aneuploidy screening in early human embryos: a review. Prenat. Diagn. 2002;22:512–518. doi: 10.1002/pd.388. [DOI] [PubMed] [Google Scholar]
- 57.Vanneste E., Voet T., Melotte C., Debrock S., Sermon K., Staessen C., Liebaers I., Fryns J.P., D’Hooghe T., Vermeesch J.R. What next for preimplantation genetic screening? High mitotic chromosome instability rate provides the biological basis for the low success rate. Hum. Reprod. 2009;24:2679–2682. doi: 10.1093/humrep/dep266. [DOI] [PMC free article] [PubMed] [Google Scholar]
- 58.Mastenbroek S., Twisk M., van Echten-Arends J., Sikkema-Raddatz B., Korevaar J.C., Verhoeve H.R., Vogel N.E., Arts E.G., de Vries J.W., Bossuyt P.M. In vitro fertilization with preimplantation genetic screening. N. Engl. J. Med. 2007;357:9–17. doi: 10.1056/NEJMoa067744. [DOI] [PubMed] [Google Scholar]
- 59.Harton G.L., De Rycke M., Fiorentino F., Moutou C., SenGupta S., Traeger-Synodinos J., Harper J.C., European Society for Human Reproduction and Embryology (ESHRE) PGD Consortium ESHRE PGD consortium best practice guidelines for amplification-based PGD. Hum. Reprod. 2011;26:33–40. doi: 10.1093/humrep/deq231. [DOI] [PubMed] [Google Scholar]
- 60.Harton G.L., Harper J.C., Coonen E., Pehlivan T., Vesela K., Wilton L., European Society for Human Reproduction and Embryology (ESHRE) PGD Consortium ESHRE PGD consortium best practice guidelines for fluorescence in situ hybridization-based PGD. Hum. Reprod. 2011;26:25–32. doi: 10.1093/humrep/deq230. [DOI] [PubMed] [Google Scholar]
- 61.Harper J.C., Wilton L., Traeger-Synodinos J., Goossens V., Moutou C., SenGupta S.B., Pehlivan Budak T., Renwick P., De Rycke M., Geraedts J.P., Harton G. The ESHRE PGD Consortium: 10 years of data collection. Hum. Reprod. Update. 2012;18:234–247. doi: 10.1093/humupd/dmr052. [DOI] [PubMed] [Google Scholar]
Associated Data
This section collects any data citations, data availability statements, or supplementary materials included in this article.