

Abstract
Objective
White matter hyperintensities (WMHs) are common with age, grow over time, and are associated with cognitive and motor impairments. Mechanisms underlying WMH growth are unclear. We aimed to determine the presence and extent of decreased normal appearing white matter (NAWM) cerebral blood flow (CBF) surrounding WMHs to identify ‘WM at risk’, or the WMH CBF penumbra. We aimed to further validate cross-sectional finding by determining whether the baseline WMH penumbra CBF predicts the development of new WMHs at follow-up.
Methods
Sixty-one cognitively intact elderly subjects received 3 T MPRAGE, FLAIR, and pulsed arterial spin labeling (PASL). Twenty-four subjects returned for follow-up MRI. The inter-scan interval was 18 months. A NAWM layer mask, comprised of fifteen layers, 1 mm thick each surrounding WMHs, was generated for periventricular (PVWMH) and deep (DWMH) WMHs. Mean CBF for each layer was computed. New WMH and persistent NAWM voxels for each penumbra layer were defined from follow-up MRI.
Results
CBF in the area surrounding WMHs was significantly lower than the total brain NAWM, extending approximately 12 mm from both the established PVWMH and DWMH. Voxels with new WMH at follow-up had significantly lower baseline CBF than voxels that maintained NAWM, suggesting that baseline CBF can predict the development of new WMHs over time.
Conclusions
A CBF penumbra exists surrounding WMHs, which is associated with future WMH expansion. ASL MRI can be used to monitor interventions to increase white matter blood flow for the prevention of further WM damage and its cognitive and motor consequences.
Keywords: Cognitive aging, Vascular dementia, Cerebral blood flow (CBF) penumbra, White matter hyperintensity (WMH), Arterial spin labeling (ASL)
Abbreviations: WMH, white matter hyperintensity; PVWMH, periventricular white matter hyperintensity; DWMH, deep white matter hyperintensity; NAWM, normal appearing white matter; CBF, cerebral blood flow; PASL, pulsed arterial spin labeling; CASL, continuous arterial spin labeling; PCASL, pseudo-continuous arterial spin labeling; M0, the initial ASL datasets; NAWM L1, normal appearing white matter layer 1; NAWM L15, normal appearing white matter layer 15
Highlights
-
•
We examined cerebral blood flow (CBF) surrounding white matter hyperintensity (WMH) lesions.
-
•
We examined whether low baseline CBF is associated with WMH expansion over time.
-
•
WMH CBF penumbra exists, extending ~12 mm from both periventricular and deep WMH lesions.
-
•
Baseline CBF can predict the development of new WMHs over time.
-
•
ASL MRI can be used to monitor interventions to increase white matter blood flow.
1. Introduction
White matter hyperintensities (WMHs) are common with age and grow over time (de Leeuw et al., 2001; Erten-Lyons et al., 2013; Maillard et al., 2012; Silbert et al., 2012). WMHs are commonly classified as periventricular (PVWMH) and deep (DWMH) lesions according to their locations and appearance. The volume of WMHs is associated with increased risk of cognitive (Au et al., 2006; Debette et al., 2010; DeCarli et al., 1995a; Longstreth et al., 1996; Silbert et al., 2008; Silbert et al., 2009) and motor (Silbert et al., 2008) impairment, stroke (Debette et al., 2010; Kuller et al., 2004; Wen and Sachdev, 2004), and mortality (Debette et al., 2010). Therefore, characterizing the growth of WMH volume over time has become an important research goal in order to impede the progression of clinical impairments. WMHs are likely ischemic in origin (Fazekas et al., 1993), specifically arteriolosclerosis (Erten-Lyons et al., 2013) and chronic hypoperfusion due to localization on the border zones of cerebral arteries (Kim et al., 2008). Yet the exact developmental process remains unclear.
The WMH penumbra is normal appearing white matter (NAWM) tissue surrounding WMHs that is more vulnerable than other healthy white matter (WM) to convert to WMHs (Maillard et al., 2011), or ‘WM at risk’. A previous diffusion tensor imaging (DTI) study has shown that the WMH DTI-fractional anisotropy (FA) penumbra was approximately 3 mm from voxels comprised of WMHs (Maillard et al., 2011). Longitudinal studies also showed changes in baseline FA and FLAIR signal intensities in a WMH penumbra defined within 8 mm of WMH lesions (Maillard et al., 2014), which could predict incident WMHs at follow-up (de Groot et al., 2013; Maillard et al., 2013). Another study also demonstrated the WMH penumbra as being a predilection site for new lacunes (Duering et al., 2013). While previous penumbra-defining methods capture current microstructural WM integrity disruption, arterial spin labeling can provide cerebral blood flow (CBF) information, which may serve to elucidate the etiology of WMH expansion prior to microstructural injury to the WM.
Pulsed arterial spin labeling (PASL) is capable of measuring WMH and NAWM cerebral blood flow. It has been shown previously that WMH CBF was significantly lower than NAWM CBF (Brickman et al., 2009). Therefore, lower CBF in the NAWM voxels surrounding WM lesions could be a suitable marker for indicating the WMH CBF penumbra. The aims of this study were to determine the presence and extent of low NAWM CBF surrounding WMHs to identify ‘WM at risk’, or the WMH CBF penumbra. We aimed to further validate cross-sectional findings by determining whether our previously identified baseline WMH CBF penumbra predicted the development of new WMHs at follow-up using longitudinal data. CBF delineation of the WMH penumbra could provide a potentially modifiable biomarker to identify ‘at risk’ tissue, for which interventions to prevent the accretion of WMH could be implemented.
2. Material and methods
2.1. Subjects
Sixty-one cognitively intact community dwelling elderly subjects currently participating in a Layton Aging and Alzheimer's Disease Center were recruited. Entry inclusion criteria included seniors aged 65 or above with a score of 0 on the Clinical Dementia Rating Scale (CDR) and ≥24 on the Mini-Mental State Examination. MRI exclusion criteria included a history of clinical stroke or evidence of cortical stroke on MRI, claustrophobia, inability to lie in a supine position for 90 min, and implanted metallic objects. All subjects signed written informed consent and approval from the Institutional Review Board of Oregon Health & Science University was obtained. All subjects received at least one brain MRI scan. Twenty-four subjects returned for a follow-up MRI. The mean (standard deviation, SD) interscan interval was 18 (11) months. Table 1 describes participant characteristics.
Table 1.
Summary of participant characteristics at baseline.
| Variables | Mean (SD) | Median | IQR |
|---|---|---|---|
| Number of subjects | 61 | ||
| Age (years) | 84.6 (8.0) | 85.2 | 9 |
| Female | 48 | ||
| Percent number of subjects with history of hypertension | 73% | ||
| CDR | 0 | 0 | 0 |
| MMSE | 28.9 (1.4) | 29 | 2 |
| Baseline total WMH volume (cc) | 11.2 (9.5) | 9.2 | 10.2 |
| Baseline periventricular (PV) WMH volume (cc) | 9.8 (9.1) | 7.8 | 7.5 |
| Baseline deep WMH volume (cc) | 1.3 (1.4) | 0.8 | 1.2 |
| Baseline total brain NAWM volume (cc) | 156.3 (36.3) | 146.9 | 54.2 |
| Baseline brain volume (cc) | 837.0 (100.8) | 818.2 | 115.6 |
| Baseline intracranial volume (cc) | 1860.3 (229.3) | 1804.5 | 258.1 |
IQR = interquartile range; CDR = Clinical Dementia Rating Scale.
2.2. MRI sequences
Magnetic resonance imaging (MRI) data were obtained using a 3.0 T MRI scanner (TIM Trio System, Siemens Medical Solutions). Each subject underwent T1-weighted magnetization prepared rapid gradient echo (MPRAGE), fluid attenuated inversion recovery (FLAIR), and QUIPSS II with thin-slice TI periodic saturation (Q2TIPS) PASL (Luh et al., 1999). T1-weighted images were acquired using repetition time (TR) = 2300 ms, echo time (TE) = 3.4 ms, inversion time (TI) = 1200 ms, spatial resolution = 1 mm isotropic, and field of view (FOV) = 256 mm. Axial 2D FLAIR datasets were acquired using TR = 9000 ms, TE = 87 ms, TI = 2500 ms, FOV = 248 mm, slice thickness = 2 mm, and number of slices = 95. PASL sequence was obtained covering the basal ganglia inferiorly, through the centrum semiovale superiorly with following parameters: resolution = 3 × 3 × 4 mm, 2 mm gap, time between the inversion pulse and beginning of the periodic saturation pulse train 1 (TI1) = 700 ms, the post-TI periodic saturation stop time (TI1s) = 1600 ms, the time between the inversion pulse and the initial EPI read pulse (TI2) = 1800 ms (Campbell and Beaulieu, 2006), TR = 3000 ms and TE = 13 ms. The sequence acquired 720 images in 3 separate runs. Subjects were instructed to stay awake with their eyes closed.
2.3. MRI processing
For each dataset, the T1-weighted image was segmented into WM, gray matter (GM), and ventricle masks using FreeSurfer (v.5.1), and manually corrected for any tissue misclassification. The masks were then linearly aligned to the FLAIR image, and were later used to set the boundaries of the seed growing for the WMHs. To determine the WMH area, a histogram of the WM of FLAIR intensity was generated and the 45% above peak of the histogram was used as a cutoff to separate the WMH (>cutoff) and NAWM (<cutoff). Clusters of at least three voxels were used as seeds for a custom cluster-growing algorithm. For each cluster, the mean intensity was calculated and then all nearest neighbor voxels of intensity exceeding 95% of the mean cluster intensity were added to the cluster. The process was repeated until the cluster mean reached the lower limit of two standard deviations above the WM mean or until no additional voxels met the threshold. The WMH clusters were visually examined and manually corrected for accurate WMH coverage. WMH clusters contiguous with the ventricles were labeled periventricular WMHs (PVWMHs) and all others were considered deep WMHs (DWMHs).
To derive the subject-specific CBF map each of the three runs of PASL images was divided into labeled and controlled datasets. Each dataset was linearly aligned to the initial ASL datasets (M0) and was inspected for the excessive head movement (≥2 mm or 2°). The area outside of the brain was excluded. The three runs were concatenated by linearly aligning the first and third runs to the second run. The M0 from the three runs were averaged. Quantitative CBF was then calculated on a voxel basis according to Wang et al. (Wang et al., 2003). Voxel-wise partial volume correction was performed (Du et al., 2006).
To determine the WMH CBF penumbra, a NAWM layer mask for each individual dataset was created by linearly aligning the defined WMHs to the T1-weighted image. Each layer was dilated away from the WMHs by 1 voxel (1 mm), for a total of 15 NAWM layers for PVWMH and DWMH separately, see Fig. 1A–B. The innermost layer, closest to WMH was layer 1 (NAWM-L1) and the outermost layer was layer 15 (NAWM-L15), see Fig. 1C. To prevent overlapping voxels between layers, before creating the next layer, the WMH and the previous NAWM layers were merged together to create a new ‘seed’. To avoid the partial volume effects of the GM and CSF CBF, the GM and ventricular masks were dilated by 2 voxels, and subtracted from the NAWM layers. The NAWM layer mask was individually applied to the CBF map, which was previously linearly aligned to their T1-weighted image and was resampled to 1 × 1 × 1 mm. Lastly, for each individual subject the mean CBF for WMHs and each NAWM layer was computed for PVWMH and DWMH separately, and compared with mean total brain NAWM CBF. Each mean value was adjusted for age.
Fig. 1.
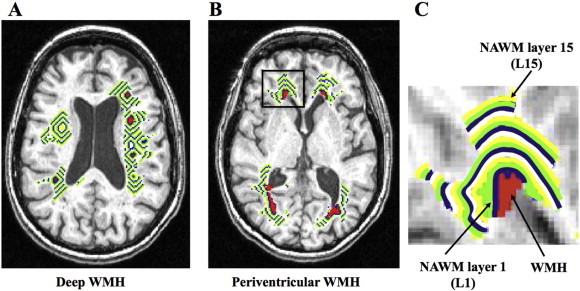
NAWM layer masks. (A) NAWM layer mask for deep WMH. (B) NAWM layer mask for periventricular WMH. (C) Enlarged periventricular NAWM layer mask at the right ventricular cap (black rectangular area on B).
For the longitudinal study, we focused only on the PVWMH as it was more prominent and consistent across subjects compared to DWMH (Table 1). To measure the CBF of the new PVWMH voxels at follow-up MRI, each individual's follow-up FLAIR image was linearly aligned to the same subject's baseline FLAIR image. The voxels with new PVWMHs at follow-up, known as new WMH voxels, and voxels with maintained NAWM in follow-up, known as persistent NAWM voxels, were defined. The volume of new WMHs at follow-up was computed. Next, the baseline NAWM layer mask was applied to the aligned FLAIR images. Finally, mean baseline CBF and follow-up CBF of new WMH and persistent NAWM voxels of each layer were calculated.
2.4. Statistical analysis
The analyses were performed using SPSS software (v.20, IBM), SAS (v.9.3, SAS Institute Inc.) and R (v.2.11, R Foundation). To compare mean CBF between the WMH and NAWM layers (L1–L15) with mean total brain NAWM CBF, a mixed effects model was used. In the model, we created 15 dummy variables indicating each NAWM CBF layer with total brain NAWM CBF as a reference. The analysis was performed for PVWMH and DWMHs separately. To identify NAWM with substantial growth of new WMH voxels for the longitudinal data, we ran a mixed effects model with each layer being treated as a repeated observation (independent variables) and log transformed new WMH volume as outcomes (to address the skewed distribution). We then fitted the curve with quadratic and cubic functions of layers, which provided the best goodness of fit. To compare mean baseline CBF between new WMH voxels and persistent NAWM voxels, paired t-tests were used. Significant difference was set at p < 0.05.
3. Results
3.1. Lower CBF of WMH and NAWM layers compared to total brain NAWM CBF
Fig. 2 shows a comparison of the WMH CBF and its NAWM layers (L1–L15) with mean total brain NAWM CBF (Fig. 2A shows PVWMH; Fig. 2B shows DWMH). For PVWMH, the mean age-adjusted CBF of WMH and NAWM L1–L12 was significantly lower than that of the CBF of the mean total brain NAWM. For DWMH, the mean age-adjusted CBF of WMH and NAWM L1–L11 was significantly lower than that of the mean total brain NAWM CBF. The mean (standard error, SE) age-adjusted CBF of total brain NAWM was 0.32 (0.01) ml/100 g/min/years old. Inline Supplementary Table S1 demonstrates the mean (SE) age-adjusted CBF of the PVWMH, DWMH, their NAWM layers and their p-values in relation to total brain NAWM CBF. A comparison between PVWMH and DWMH demonstrated that the CBF of PVWMH and NAWM L1–L4 was significantly lower than that of DWMH (see Inline Supplementary Table S1).
Fig. 2.
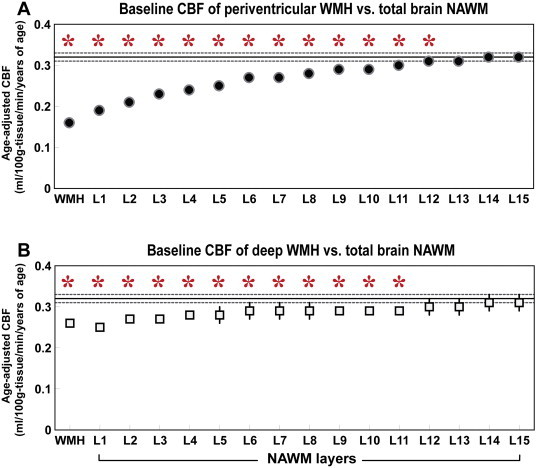
Mean and standard error of baseline periventricular and deep WMH and its outer NAWM layers (L1–L15) in relation to total brain NAWM CBF. (A) Periventricular WMH. (B) Deep WMH. Y-axis represents age-adjusted CBF. X-axis represents WMH and its NAWM layers (L1–L15). The solid horizontal and dotted lines represent the mean and standard error of total brain NAWM CBF, respectively. Asterisks represent significant differences at p < 0.05.
Table S1.
A comparison of the WMH CBF and its NAWM layers (L1-L15) with mean total brain NAWM CBF using mixed-effects model (column 3 and 5); and a comparison of periventricular and deep WMH CBF using t-test (column 6).
| CBF of PVWMH | p-values of PVWMH CBF vs. total brain NAWM CBF | CBF of DWMH | p-values of DWMH CBF vs. total brain NAWM CBF | p-values of PVWMH CBF vs. DWMH CBF | |
|---|---|---|---|---|---|
| WMH | 0.16 (0.01) | p<0.001* | 0.26 (0.01) | p<0.001* | p<0.001* |
| NAWM L1 | 0.19 (0.01) | p<0.001* | 0.25 (0.01) | p<0.001* | p<0.001* |
| NAWM L2 | 0.21 (0.01) | p<0.001* | 0.27 (0.01) | p<0.001* | p<0.001* |
| NAWM L3 | 0.23 (0.01) | p<0.001* | 0.27 (0.02) | p<0.001* | p<0.001* |
| NAWM L4 | 0.24 (0.01) | p<0.001* | 0.28 (0.01) | p<0.001* | p=0.001* |
| NAWM L5 | 0.25 (0.01) | p<0.001* | 0.28 (0.02) | p<0.001* | p=0.012 |
| NAWM L6 | 0.26 (0.01) | p<0.001* | 0.28 (0.02) | p<0.002* | p=0.061 |
| NAWM L7 | 0.27 (0.01) | p<0.001* | 0.29 (0.02) | p<0.001* | p=0.190 |
| NAWM L8 | 0.28 (0.01) | p<0.001* | 0.29 (0.02) | p=0.002* | p=0.371 |
| NAWM L9 | 0.29 (0.01) | p<0.001* | 0.29 (0.01) | p=0.004* | p=0.756 |
| NAWM L10 | 0.29 (0.01) | p<0.001* | 0.29 (0.01) | p=0.014* | p=0.916 |
| NAWM L11 | 0.30 (0.01) | p<0.001* | 0.29 (0.01) | p=0.033* | p=0.567 |
| NAWM L12 | 0.30 (0.01) | p=0.002* | 0.30 (0.02) | p=0.095 | p=0.573 |
| NAWM L13 | 0.31 (0.01) | p=0.063 | 0.30 (0.02) | p=0.239 | p=0.543 |
| NAWM L14 | 0.32 (0.01) | p=0.515 | 0.31 (0.02) | p=0.441 | p=0.532 |
| NAWM L15 | 0.32 (0.01) | p=0.546 | 0.31 (0.02) | p=0.674 | p=0.545 |
NAWM=normal appearing white matter; WMH=white matter hyperintensity; PVWMH=periventricular white matter hyperintensity; DWMH=deep white matter hyperintensity; and CBF=cerebral blood flow. Asterisks represent significant differences, p < 0.05.
Fig. 2 shows a comparison of the WMH CBF and its NAWM layers (L1–L15) with mean total brain NAWM CBF (Fig. 2A shows PVWMH; Fig. 2B shows DWMH). For PVWMH, the mean age-adjusted CBF of WMH and NAWM L1–L12 was significantly lower than that of the CBF of the mean total brain NAWM. For DWMH, the mean age-adjusted CBF of WMH and NAWM L1–L11 was significantly lower than that of the mean total brain NAWM CBF. The mean (standard error, SE) age-adjusted CBF of total brain NAWM was 0.32 (0.01) ml/100 g/min/years old. Inline Supplementary Table S1 demonstrates the mean (SE) age-adjusted CBF of the PVWMH, DWMH, their NAWM layers and their p-values in relation to total brain NAWM CBF. A comparison between PVWMH and DWMH demonstrated that the CBF of PVWMH and NAWM L1–L4 was significantly lower than that of DWMH (see Inline Supplementary Table S1).
Inline Supplementary Table S1.
Inline Supplementary Tables S1 can be found online at http://dx.doi.org/10.1016/j.neuroimage.2012.08.028.
3.2. Reduced baseline CBF of new WMH voxels compared to persistent NAWM voxels
For the longitudinal data, Fig. 3A shows the new WMH volume of each NAWM layer at the follow-up MRI. The model with quadratic and cubic terms demonstrated that at layer 6, the estimated value reached below 0 in log transformed WMH values, indicating that there is no substantial growth beyond layer 5. The group mean (SE) volumes of new WMH were NAWM-L1 = 478.4 (69.0) mm3, NAWM-L2 = 154.7 (24.2) mm3, NAWM-L3 = 52.0 (10.5) mm3, NAWM-L4 = 30.3 (7.0) mm3, and NAWM-L5 = 22.3 (6.2) mm3. For further longitudinal analysis, we therefore focused on the innermost 5 layers.
Fig. 3.
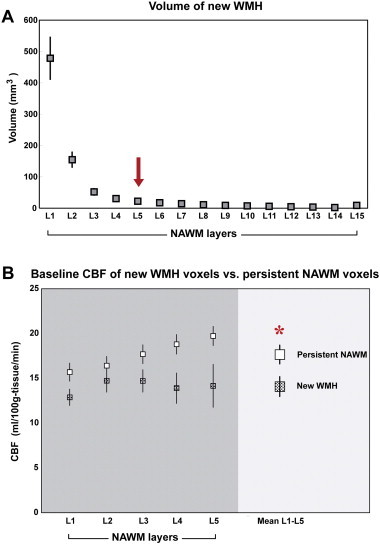
Longitudinal data. (A) Volume of new WMH voxels at follow-up. Each marker represents the mean and standard error (SE) of new WMH voxels at each NAWM layer defined at baseline. New WMH volume was larger at the inner layers with no substantial growth beyond layer 5. (B) Mean baseline CBF of NAWM layers 1, 2, 3, 4, and 5 and mean of all 5 layers of new WMH voxels versus persistent NAWM voxels. X-axis is NAWM layers. Y-axis is cerebral blood flow. Asterisk represents significant difference of baseline CBF between the two voxel groups, p < 0.05.
Fig. 3B illustrates the average baseline CBF in NAWM-L1 to -L5 of new WMH voxels in relation to voxels that persisted as NAWM at follow-up. The mean baseline CBF of new WMH voxels was significantly lower than that of persistent NAWM voxels (14.08 (0.2) versus 17.66 (0.2) ml/100 g tissue/min, p = 0.006). The same figure also demonstrates that the mean baseline CBF of new WMH voxels was lower than that of the persistent NAWM voxels in each NAWM layer. There was no significant difference between the baseline and follow-up CBF in either WMHs or its NAWM layers after a mean follow-up of 18 months (see Inline Supplementary Fig. S1).
Fig. S1.
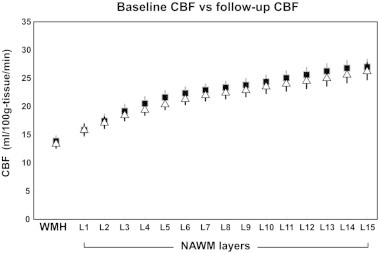
Baseline and follow-up CBF of WMH and its outer NAWM layers. Each marker represents mean and SE. Black rectangles represent the baseline CBF; white triangles represent the follow-up CBF.
Fig. 3B illustrates the average baseline CBF in NAWM-L1 to -L5 of new WMH voxels in relation to voxels that persisted as NAWM at follow-up. The mean baseline CBF of new WMH voxels was significantly lower than that of persistent NAWM voxels (14.08 (0.2) versus 17.66 (0.2) ml/100 g tissue/min, p = 0.006). The same figure also demonstrates that the mean baseline CBF of new WMH voxels was lower than that of the persistent NAWM voxels in each NAWM layer. There was no significant difference between the baseline and follow-up CBF in either WMHs or its NAWM layers after a mean follow-up of 18 months (see Inline Supplementary Fig. S1).
Inline Supplementary Figure S1.
Inline Supplementary Fig. S1 can be found online at http://dx.doi.org/10.1016/j.nicl.2015.04.012.
4. Discussion
The present study aimed to better understand blood flow behavior surrounding WMHs in cognitively intact elderly. There are two major findings. First, the CBF of WMH and its NAWM layers was significantly lower than the mean total brain NAWM CBF up to layer 12 and layer 11 for PVWMH and for DWMH, respectively. This indicates a WMH CBF penumbra that extends approximately 12 mm from the established WMH. Second, the reduced baseline CBF of voxels with new WMH compared to those with persistent NAWM suggests that cross-sectional CBF data could be used to predict the growth of WMH over time, and the baseline CBF of the WMH penumbra can predict the development of new WMH voxels at follow-up.
Results from this study show that WMH CBF penumbra exists approximately 12 mm surrounding WMHs. These results are consistent with a previous study showing a WMH DTI-FA and FLAIR intensity penumbra, that was approximately 3–8 mm around WMHs (Maillard et al., 2011; Maillard et al., 2014). Two possible reasons may explain the more extensive penumbra area in the current study compared to the previous study. First, the resolution of the ASL images is lower than the DTI images. Accordingly, the WMH penumbra is on an order of 1–2 voxels, which is consistent with the previous DTI observations. Second, ASL CBF may be more sensitive for detecting ‘at risk’ tissue compared to DTI-FA in that lower CBF likely precedes structural changes, such as reduced WM integrity observed by DTI. The CBF penumbra would therefore likely extend beyond the DTI-FA penumbra with structural damage occurring initially at the inner, lowest CBF layers, sparing the outer layers of DTI-FA change initially.
Both PVWMH and DWMH demonstrated reduced CBF in the neighboring NAWM voxels within a similar extensive area, thus confirming the existence of a CBF penumbra surrounding chronic ischemic white matter lesions, regardless of the different vasculatures and anatomies of WMH subtypes. CBF of inner PVWMH NAWM layers (L1–L4) was significantly lower than similar inner NAWM layers of DWMHs, indicating potentially varying pathophysiologies of the two WMH subtypes. Previous work has shown that PVWMHs border zones between ventriculofugal vessels and the penetrating centripetal vessels, which may cause watershed infarctions due to chronic hemodynamic insufficiency (De Reuck, 1971; Moody et al., 1997; Thomas et al., 2003). On the other hand, DWMHs were likely associated with arteriolosclerosis (Fazekas et al., 1993; Haller et al., 2013; Thomas et al., 2002), which alters the blood supply of WM and leads to either localized ischemic areas of necrosis and cavitation or diffuse rarefaction (Kim et al., 2008; Pantoni and Garcia, 1997). These underlying mechanistic differences in perfusion change between the two WMH subtypes may affect quantitative WMH CBF values, but did not result in differences in extension of the penumbra area.
Another important observation was that WMH CBF increased from the inner to outer NAWM layers, suggesting that new WMHs expand from the outer edge of the existing WMH lesion, and that the development of WM injury is largely a continuous process. This finding is consistent with Maillard et al. who showed that NAWM voxels' proximity to WMHs had a higher injury score than the voxels located in an area distant from WMHs (Maillard et al., 2011) and approximately 80% of the growing WMH extends from existing lesions (Maillard et al., 2012). Results from this study not only support previous findings, but also suggest a plausible mechanism by which such observations are made, i.e., lower CBF in the area immediately surrounding WMH lesions.
In this study, we defined the WMH penumbra by comparing the mean CBF of each NAWM layer to that of total brain NAWM voxels. One could argue that the mean total brain CBF might be computed largely from the same NAWM voxels, influencing the observed findings. However, the WMH burden presented in our subjects was relatively small, and the NAWM voxels for all fifteen layers were only approximately 11.6% of the entire brain NAWM voxels.
Our longitudinal data demonstrated that, within the WMH CBF penumbra area, baseline CBF could define NAWM voxels at greater risk for becoming new WMHs from NAWM voxels that will likely remain NAWM in follow-up. To our knowledge, no previous study has characterized the WMH CBF penumbra and validated it with a longitudinal observation. We therefore cannot compare our findings to any other studies. It is important to note that there was no significant difference between the baseline and follow-up WMH CBF. This suggests that CBF of degenerate WM that was shown as hyperintensities on FLAIR images may have reached a “floor” level, with decreased likelihood of changing over time. Second, ASL WM CBF is reproducible, consistent with previous studies which demonstrated excellent reproducibility of WM CBF for healthy aging (Zhang et al., 2012).
White matter hyperintensities in the aging population are related to both CBF and cerebral metabolism (DeCarli et al., 1995b; Frackowiak et al., 1981; Takahashi et al., 2000; Yamaji et al., 1997). The decreased CBF surrounding WMHs associated with new WMHs observed in this study suggests that small vessel ischemia is the cause of WMHs. However, it is also possible that reduced CBF is a consequence of cerebral metabolic decrease, rather than a solely ischemic phenomenon. Accordingly, age-related neurodegeneration may occur as a primary event, resulting in decreased metabolic demands, which would subsequently decrease metabolic supplies brought to the brain by CBF per regulatory mechanisms. In this case, WMH would be associated with a coupled decline of CBF and metabolic rate of oxygen (CMRO2) (Frackowiak et al., 1981). It also remains conceivable that WMH is primarily associated with cerebral hypoperfusion, which, if long-standing, may progressively lead to secondary metabolic alterations, and reduction of CMRO2. In this case, either an increase in oxygen extraction fraction (OEF) with the coupled decline of CBF and CMRO2 or a decrease in CBF with preserved CMRO2 would be expected (Yamaji et al., 1997). In our current study, we did not measure cerebral metabolism in WMH and its corresponding NAWM. However, it would be interesting for future studies to investigate the relation of CBF and cerebral metabolism in the area surrounding WMH lesions.
This study is the first to define a CBF penumbra for age-related WMHs, and supports previous literature demonstrating that WMHs are likely ischemic in origin. The WMH CBF penumbra modeling used in this study provides an absolute distance of the penumbra from WMH lesions, and thus representing a potentially modifiable biomarker that can gauge those at risk for WMH progression. The ASL MRI methods of CBF determination used in this study are preferable to investigate cerebrovascular health in an aging population for a number of reasons. It is noninvasive, and does not require the use of intravenous contrast agents or radioactive tracers. Information can be acquired during the same imaging session that structural data are obtained, including cerebrovascular disease burden. Furthermore, newer ASL sequences, such as continuous ASL (CASL) and pseudo-continuous ASL (PCASL), can acquire perfusion data similar to that reported here in a shorter amount of time, thus making ASL MRI perfusion imaging compatible with routine clinical scanning.
The ability to assess and monitor WM at risk for future ischemic injury has several important clinical implications. The optimal degree of blood pressure management of older individuals is currently unclear as current guidelines might be too aggressive in some individuals with impaired cerebral autoregulation, resulting in an overall decreased perfusion pressure (Muller et al., 2014). This ASL MRI technique could be used to more directly assess the effects of blood pressure management on WM perfusion and functional outcomes. Similar methods could be used to monitor treatment effects and to validate other interventions aimed at repressing the growth of WMH over time via mechanisms aimed at enhancing cerebral perfusion, such as those involving exercise (Hiura et al., 2014) or meditation (Newberg et al., 2010).
Limitations of this study include a relatively small sample size, particularly in the second visit. Secondly, studies to assess relationships of WMH CBF penumbra and clinical manifestations of cognitive and motor performance should be done. Thirdly, further studies to precisely identify a baseline CBF value that could reliably differentiate voxels that will contain new WMHs from those with persistent NAWM at follow-up are needed. Fourthly, further studies investigating WMH and WMH CBF penumbra at the lesion-level should be included. Lastly, a longer follow-up should be pursued.
5. Conclusions
In conclusion, the present study provides important implication regarding the etiology of WMH expansion, a phenomenon commonly observed in older individuals, and associated with significant morbidity. Lower CBF in the surrounding area of WMHs indicates a penumbra, or tissue at risk for developing into a WM lesion. The longitudinal data show that the WMH penumbra is associated with WMH expansion over time and that lower CBF precedes developing new WMH voxels. The CBF penumbra can be used as a modifiable biomarker to monitor effects of prevention and treatment trials targeting improved cerebral blood flow in order to maintain cognitive and motor function in the elderly.
Conflicts of interest
Dr. Nutta-on Promjunyakul reports no disclosures relevant to the manuscript.
Mr. David Lahna reports no disclosures relevant to the manuscript.
Dr. Kaye receives research support from the Department of Veterans Affairs [Merit Review grant] and the NIH (P30 AG008017, R01 AG024059, P30 AG024978, P01 AG043362, U01 AG010483); directs a center that receives research support from the NIH, CDC, Roche and Esai; receives reimbursement through Medicare or commercial insurance plans for providing clinical assessment and care for patients; is salaried to see patients at the Portland VA Medical Center; serves as an unpaid Chair of the International Society to Advance Alzheimer's Research and Treatment for the National Alzheimer's Association and as an unpaid Commissioner for the Center for Aging Services and Technologies; and serves on the editorial advisory board of the journal, Alzheimer's & Dementia and as Associate Editor, and Frontiers of Aging Neuroscience.
Dr. Hiroko Dodge reports no disclosures relevant to the manuscript.
Dr. Deniz Erten-Lyons receives research support from the Department of Veterans Affairs (Career Development Award grant). She also receives reimbursement through Medicare or commercial insurance plans for providing clinical assessment and care for patients and is salaried to see patients at the Portland VA Medical Center.
Dr. Bill Rooney reports no disclosures relevant to the manuscript.
Dr. Lisa Silbert receives research support from the NIH (1R01AG036772, P30 AG008017, P50 NS062684). She also receives reimbursement through Medicare or commercial insurance plans for providing clinical assessment and care for patients and for intraoperative neurophysiological monitoring, and is salaried to see patients at the Portland VA Medical Center.
Acknowledgment
Study funding: supported by NIH (1RO1AG036772, P30 AG008017, RO1 AG024059) and the Department of Veterans Affairs.
Contributor Information
N. Promjunyakul, Email: promjuny@ohsu.edu.
D. Lahna, Email: lahnad@ohsu.edu.
J.A. Kaye, Email: kaye@ohsu.edu.
H.H. Dodge, Email: dodgeh@ohsu.edu.
D. Erten-Lyons, Email: ertenlyo@ohsu.edu.
W.D. Rooney, Email: rooneyw@ohsu.edu.
L.C. Silbert, Email: silbertl@ohsu.edu.
References
- Au R., Massaro J.M., Wolf P.A., Young M.E., Beiser A., Seshadri S., D'Agostino R.B., DeCarli C. Association of white matter hyperintensity volume with decreased cognitive functioning: the Framingham Heart Study. Arch. Neurol. 2006;63(2):246–250. doi: 10.1001/archneur.63.2.246. 16476813 [DOI] [PubMed] [Google Scholar]
- Brickman A.M., Zahra A., Muraskin J., Steffener J., Holland C.M., Habeck C., Borogovac A., Ramos M.A., Brown T.R., Asllani I. Reduction in cerebral blood flow in areas appearing as white matter hyperintensities on magnetic resonance imaging. Psychiatry Res. 2009;172(2):117–120. doi: 10.1016/j.pscychresns.2008.11.006. 19324534 [DOI] [PMC free article] [PubMed] [Google Scholar]
- Campbell A.M., Beaulieu C. Pulsed arterial spin labeling parameter optimization for an elderly population. J. Magn. Reson. Imaging. 2006;23(3):398–403. doi: 10.1002/jmri.20503. 16463300 [DOI] [PubMed] [Google Scholar]
- de Groot M., Verhaaren B.F., de Boer R., Klein S., Hofman A., van der Lugt A., Ikram M.A., Niessen W.J., Vernooij M.W. Changes in normal-appearing white matter precede development of white matter lesions. Stroke; J. Cereb. Circ. 2013;44(4):1037–1042. doi: 10.1161/STROKEAHA.112.680223. 23429507 [DOI] [PubMed] [Google Scholar]
- de Leeuw F.E., de Groot J.C., Achten E., Oudkerk M., Ramos L.M., Heijboer R., Hofman A., Jolles J., van Gijn J., Breteler M.M. Prevalence of cerebral white matter lesions in elderly people: a population based magnetic resonance imaging study. The Rotterdam Scan Study. J. Neurol. Neurosurg. Psychiatry. 2001;70(1):9–14. doi: 10.1136/jnnp.70.1.9. 11118240 [DOI] [PMC free article] [PubMed] [Google Scholar]
- De Reuck J. The human periventricular arterial blood supply and the anatomy of cerebral infarctions. Eur. Neurol. 1971;5(6):321–334. doi: 10.1159/000114088. 5141149 [DOI] [PubMed] [Google Scholar]
- Debette S., Beiser A., DeCarli C., Au R., Himali J.J., Kelly-Hayes M., Romero J.R., Kase C.S., Wolf P.A., Seshadri S. Association of MRI markers of vascular brain injury with incident stroke, mild cognitive impairment, dementia, and mortality: the Framingham Offspring Study. Stroke; J. Cereb. Circ. 2010;41(4):600–606. doi: 10.1161/STROKEAHA.109.570044. 20167919 [DOI] [PMC free article] [PubMed] [Google Scholar]
- DeCarli C., Murphy D.G., Tranh M., Grady C.L., Haxby J.V., Gillette J.A., Salerno J.A., Gonzales-Aviles A., Horwitz B., Rapoport S.I. The effect of white matter hyperintensity volume on brain structure, cognitive performance, and cerebral metabolism of glucose in 51 healthy adults. Neurol. 1995;45(11):2077–2084. doi: 10.1212/wnl.45.11.2077. 7501162 [DOI] [PubMed] [Google Scholar]
- DeCarli C., Murphy D.G., Tranh M., Grady C.L., Haxby J.V., Gillette J.A., Salerno J.A., Gonzales-Aviles A., Horwitz B., Rapoport S.I. The effect of white matter hyperintensity volume on brain structure, cognitive performance, and cerebral metabolism of glucose in 51 healthy adults. Neurol. 1995;45(11):2077–2084. doi: 10.1212/wnl.45.11.2077. 7501162 [DOI] [PubMed] [Google Scholar]
- Du A.T., Jahng G.H., Hayasaka S., Kramer J.H., Rosen H.J., Gorno-Tempini M.L., Rankin K.P., Miller B.L., Weiner M.W., Schuff N. Hypoperfusion in frontotemporal dementia and Alzheimer disease by arterial spin labeling MRI. Neurology. 2006;67(7):1215–1220. doi: 10.1212/01.wnl.0000238163.71349.78. 17030755 [DOI] [PMC free article] [PubMed] [Google Scholar]
- Duering M., Csanadi E., Gesierich B., Jouvent E., Hervé D., Seiler S., Belaroussi B., Ropele S., Schmidt R., Chabriat H. Incident lacunes preferentially localize to the edge of white matter hyperintensities: insights into the pathophysiology of cerebral small vessel disease. Brain J. Neurol. 2013;136(9):2717–2726. doi: 10.1093/brain/awt184. 23864274 [DOI] [PubMed] [Google Scholar]
- Erten-Lyons D., Woltjer R., Kaye J., Mattek N., Dodge H.H., Green S., Tran H., Howieson D.B., Wild K., Silbert L.C. Neuropathologic basis of white matter hyperintensity accumulation with advanced age. Neurology. 2013;81(11):977–983. doi: 10.1212/WNL.0b013e3182a43e45. 23935177 [DOI] [PMC free article] [PubMed] [Google Scholar]
- Fazekas F., Kleinert R., Offenbacher H., Schmidt R., Kleinert G., Payer F., Radner H., Lechner H. Pathologic correlates of incidental MRI white matter signal hyperintensities. Neurology. 1993;43(9):1683–1689. doi: 10.1212/wnl.43.9.1683. 8414012 [DOI] [PubMed] [Google Scholar]
- Frackowiak R.S., Pozzilli C., Legg N.J., Du Boulay G.H., Marshall J., Lenzi G.L., Jones T. Regional cerebral oxygen supply and utilization in dementia. A clinical and physiological study with oxygen-15 and positron tomography. Brain J. Neurol. 1981;104(4):753–778. doi: 10.1093/brain/104.4.753. 6976816 [DOI] [PubMed] [Google Scholar]
- Haller S., Kövari E., Herrmann F.R., Cuvinciuc V., Tomm A.M., Zulian G.B., Lovblad K.O., Giannakopoulos P., Bouras C. Do brain T2/FLAIR white matter hyperintensities correspond to myelin loss in normal aging? A radiologic-neuropathologic correlation study. Acta Neuropathol. Commun. 2013;1(1):14. doi: 10.1186/2051-5960-1-14. 24252608 [DOI] [PMC free article] [PubMed] [Google Scholar]
- Hiura M., Nariai T., Ishii K., Sakata M., Oda K., Toyohara J., Ishiwata K. Changes in cerebral blood flow during steady-state cycling exercise: a study using oxygen-15-labeled water with PET. J. Cereb. Blood Flow Metab. 2014;34(3):389–396. doi: 10.1038/jcbfm.2013.220. 24301294 [DOI] [PMC free article] [PubMed] [Google Scholar]
- Kim K.W., MacFall J.R., Payne M.E. Classification of white matter lesions on magnetic resonance imaging in elderly persons. Biol. Psychiatry. 2008;64(4):273–280. doi: 10.1016/j.biopsych.2008.03.024. 18471801 [DOI] [PMC free article] [PubMed] [Google Scholar]
- Kuller L.H., Longstreth W.T., Jr, Arnold A.M., Bernick C., Bryan R.N., Beauchamp N.J., Jr, Cardiovascular Health Study Collaborative Research Group White matter hyperintensity on cranial magnetic resonance imaging: a predictor of stroke. Stroke; J. Cereb. Circ. 2004;35(8):1821–1825. doi: 10.1161/01.STR.0000132193.35955.69. 15178824 [DOI] [PubMed] [Google Scholar]
- Longstreth W.T., Jr, Manolio T.A., Arnold A., Burke G.L., Bryan N., Jungreis C.A., Enright P.L., O'Leary D., Fried L. Clinical correlates of white matter findings on cranial magnetic resonance imaging of 3301 elderly people. The Cardiovascular Health Study. Stroke; J. Cereb. Circ. 1996;27(8):1274–1282. doi: 10.1161/01.str.27.8.1274. 8711786 [DOI] [PubMed] [Google Scholar]
- Luh W.M., Wong E.C., Bandettini P.A., Hyde J.S. QUIPSS II with thin-slice TI1 periodic saturation: a method for improving accuracy of quantitative perfusion imaging using pulsed arterial spin labeling. Magn. Reson. Med. Off. J. Soc. Magn. Reson. Med. / Soc. Magn. Reson. Med. 1999;41(6):1246–1254. doi: 10.1002/(sici)1522-2594(199906)41:6<1246::aid-mrm22>3.0.co;2-n. 10371458 [DOI] [PubMed] [Google Scholar]
- Maillard P., Carmichael O., Fletcher E., Reed B., Mungas D., DeCarli C. Coevolution of white matter hyperintensities and cognition in the elderly. Neurology. 2012;79(5):442–448. doi: 10.1212/WNL.0b013e3182617136. 22815562 [DOI] [PMC free article] [PubMed] [Google Scholar]
- Maillard P., Carmichael O., Harvey D., Fletcher E., Reed B., Mungas D., DeCarli C. FLAIR and diffusion MRI signals are independent predictors of white matter hyperintensities. AJNR Am J Neuroradiol. 2013;34(1):54–61. doi: 10.3174/ajnr.A3146. 22700749 [DOI] [PMC free article] [PubMed] [Google Scholar]
- Maillard P., Fletcher E., Harvey D., Carmichael O., Reed B., Mungas D., DeCarli C. White matter hyperintensity penumbra. Stroke. 2011;42(7):1917–1922. doi: 10.1161/STROKEAHA.110.609768. 21636811 [DOI] [PMC free article] [PubMed] [Google Scholar]
- Maillard P., Fletcher E., Lockhart S.N., Roach A.E., Reed B., Mungas D., DeCarli C., Carmichael O.T. White matter hyperintensities and their penumbra lie along a continuum of injury in the aging brain. Stroke. 2014;45(6):1721–1726. doi: 10.1161/STROKEAHA.113.004084. 24781079 [DOI] [PMC free article] [PubMed] [Google Scholar]
- Moody D.M., Brown W.R., Challa V.R., Ghazi-Birry H.S., Reboussin D.M. Cerebral microvascular alterations in aging, leukoaraiosis, and Alzheimer's disease. Ann. N. Y. Acad. Sci. 1997;826:103–116. doi: 10.1111/j.1749-6632.1997.tb48464.x. 9329684 [DOI] [PubMed] [Google Scholar]
- Muller M., Sigurdsson S., Kjartansson O., Aspelund T., Lopez O.L., Jonnson P.V., Harris T.B., van Buchem M., Gudnason V., Launer L.J. Joint effect of mid- and late-life blood pressure on the brain: the AGES-Reykjavik study. Neurology. 2014;82(24):2187–2195. doi: 10.1212/WNL.0000000000000517. 24898928 [DOI] [PMC free article] [PubMed] [Google Scholar]
- Newberg A.B., Wintering N., Khalsa D.S., Roggenkamp H., Waldman M.R. Meditation effects on cognitive function and cerebral blood flow in subjects with memory loss: a preliminary study. J. Alzheimers Dis. 2010;20(2):517–526. doi: 10.3233/JAD-2010-1391. 20164557 [DOI] [PubMed] [Google Scholar]
- Pantoni L., Garcia J.H. Pathogenesis of leukoaraiosis: a review. Stroke; J. Cereb. Circ. 1997;28(3):652–659. doi: 10.1161/01.str.28.3.652. 9056627 [DOI] [PubMed] [Google Scholar]
- Silbert L.C., Howieson D.B., Dodge H., Kaye J.A. Cognitive impairment risk: white matter hyperintensity progression matters. Neurology. 2009;73(2):120–125. doi: 10.1212/WNL.0b013e3181ad53fd. 19597134 [DOI] [PMC free article] [PubMed] [Google Scholar]
- Silbert L.C., Nelson C., Howieson D.B., Moore M.M., Kaye J.A. Impact of white matter hyperintensity volume progression on rate of cognitive and motor decline. Neurology. 2008;71(2):108–113. doi: 10.1212/01.wnl.0000316799.86917.37. 18606964 [DOI] [PMC free article] [PubMed] [Google Scholar]
- Silbert L.C., Dodge H.H., Perkins L.G., Sherbakov L., Lahna D., Erten-Lyons D., Woltjer R., Shinto L., Kaye J.A. Trajectory of white matter hyperintensity burden preceding mild cognitive impairment. Neurology. 2012;79(8):741–747. doi: 10.1212/WNL.0b013e3182661f2b. 22843262 [DOI] [PMC free article] [PubMed] [Google Scholar]
- Takahashi W., Takagi S., Ide M., Shohtsu A., Shinohara Y. Reduced cerebral glucose metabolism in subjects with incidental hyperintensities on magnetic resonance imaging. J. Neurol. Sci. 2000;176(1):21–27. doi: 10.1016/s0022-510x(00)00286-0. 10865088 [DOI] [PubMed] [Google Scholar]
- Thomas A.J., O'Brien J.T., Barber R., McMeekin W., Perry R. A neuropathological study of periventricular white matter hyperintensities in major depression. J. Affect. Disord. 2003;76(1–3):49–54. doi: 10.1016/s0165-0327(02)00064-2. 12943933 [DOI] [PubMed] [Google Scholar]
- Thomas A.J., O'Brien J.T., Davis S., Ballard C., Barber R., Kalaria R.N., Perry R.H. Ischemic basis for deep white matter hyperintensities in major depression: a neuropathological study. Arch. Gen. Psychiatry. 2002;59(9):785–792. doi: 10.1001/archpsyc.59.9.785. 12215077 [DOI] [PubMed] [Google Scholar]
- Wang J., Licht D.J., Jahng G.H., Liu C.S., Rubin J.T., Haselgrove J., Zimmerman R.A., Detre J.A. Pediatric perfusion imaging using pulsed arterial spin labeling. J. Magn. Reson. Imaging. 2003;18(4):404–413. doi: 10.1002/jmri.10372. 14508776 [DOI] [PubMed] [Google Scholar]
- Wen W., Sachdev P.S. Extent and distribution of white matter hyperintensities in stroke patients: the Sydney Stroke Study. Stroke; J. Cereb. Circ. 2004;35(12):2813–2819. doi: 10.1161/01.STR.0000147034.25760.3d. 15499036 [DOI] [PubMed] [Google Scholar]
- Yamaji S., Ishii K., Sasaki M., Imamura T., Kitagaki H., Sakamoto S., Mori E. Changes in cerebral blood flow and oxygen metabolism related to magnetic resonance imaging white matter hyperintensities in Alzheimer's disease. J. Nucl. Med. 1997;38(9):1471–1474. 9293811 [PubMed] [Google Scholar]
- Zhang Q., Stafford R.B., Wang Z., Arnold S.E., Wolk D.A., Detre J.A. Microvascular perfusion based on arterial spin labeled perfusion MRI as a measure of vascular risk alzheimer's disease. J Alzheimers Dis. 2012;32(3):677–687. doi: 10.3233/JAD-2012-120964. [DOI] [PMC free article] [PubMed] [Google Scholar]
Associated Data
This section collects any data citations, data availability statements, or supplementary materials included in this article.