

Abstract
Children born prematurely with very low birth weight (VLBW: bw ≤ 1500 g) have an increased risk of preterm perinatal brain injury, which may subsequently alter the maturation of the brain, including the cerebral cortex. The aim of study was to assess cortical thickness and surface area in VLBW children compared with term-born controls, and to investigate possible relationships between cortical morphology and Full IQ. In this cross-sectional study, 37 VLBW and 104 term children born between the years 2003–2007 were assessed cognitively at 5–10 years of age, using age appropriate Wechsler tests. The FreeSurfer software was used to obtain estimates of cortical thickness and surface area based on T1-weighted MRI images at 1.5 Tesla. The VLBW children had smaller cortical surface area bilaterally in the frontal, temporal, and parietal lobes. A thicker cortex in the frontal and occipital regions and a thinner cortex in posterior parietal areas were observed in the VLBW group. There were significant differences in Full IQ between groups (VLBW M = 98, SD = 9.71; controls M = 108, SD = 13.57; p < 0.001). There was a positive relationship between IQ and surface area in both groups, albeit significant only in the larger control group. In the VLBW group, reduced IQ was associated with frontal cortical thickening and temporo-parietal thinning.
We conclude that cortical deviations are evident in childhood even in VLBW children born in 2003–2007 who have received state of the art medical treatment in the perinatal period and who did not present with focal brain injuries on neonatal ultrasonography. The cortical deviations were associated with reduced cognitive functioning.
Keywords: Preterm birth, Very low birth weight, Cortical surface area, Cortical thickness, MRI, Full IQ
Highlights
-
•
Cortical deviations are evident even in VLBW children born in 2003–2007
-
•
A smaller surface area was observed in widespread cortical regions in VLBW children
-
•
VLBW children had frontal and occipital cortical thickening and parietal thinning
-
•
VLBW children had reduced Full IQ compared to term born peers
-
•
The cortical deviations were partially associated with reduced cognitive functioning
1. Introduction
Children born before week 32 with very-low-birth weight (VLBW: birth weight ≤ 1500 g) are more likely to need medical treatment during the perinatal period, and their immature nervous and cardiovascular systems render these children prone to focal brain injuries such as intraventricular hemorrhages and periventricular leukomalacia (PVL) (Volpe, 2009). Volpe (2009) has suggested that the complex of encephalopathy of prematurity includes both destructive and developmental disturbances, and primary white matter injury could have secondary effects on cortical and gray matter nuclei development. Although perinatal care and medical treatment in the neonatal intensive care unit (NICU) have improved radically during the last decades with reduced incidence of focal brain injury, the immature brain and exposure to the harsh extra-uterine environment in the NICU are still believed to increase the risk of disrupted brain development in very preterm born survivors. The consequences of such developmental disruptions in an extremely sensitive period of brain growth may be profound alterations of subcortical and cortical morphology that may affect brain function.
Previous studies have reported abnormal cerebral white matter in VLBW infants as the most common pathological finding, manifested as reduced fractional anisotropy on diffusion tensor images at 27–46 weeks of gestation (Ball et al., 2013), in adolescents (Skranes et al., 2007) and in young adults aged 18–22 years (Eikenes et al., 2011). However, changes in cortical and subcortical gray matter have also been demonstrated in children with VLBW as reduced brain cortical surface area at term-equivalent age; (Ajayi-Obe et al., 2000; Kapellou et al., 2006), in toddlers 18–22 months old (Phillips et al., 2011), in children at the age of 10 years (Grunewaldt et al., 2014), and in adolescents and young adults (Frye et al., 2010; Skranes et al., 2013). Both regional thinning and thickening of the cerebral cortex have been reported in children 7–12 years of age (Grunewaldt et al., 2014; Mürner-Lavanchy et al., 2014) and in adolescents at the age of 19 (Bjuland et al., 2014). Possible mechanisms underlying these cerebral changes in the VLBW population may include injuries that affect neuronal migration and thereby cortical development (Volpe, 2009).
The aim of the present study was to investigate cortical thickness and cortical surface area in 5–10 year old children born preterm with VLBW and term-born controls. To our knowledge, no previous study has explored regional cortical morphology using continuous cortical surface maps in VLBW children as young as 5–10 years of age. Using continuous maps of cortical thickness and surface area increases both sensitivity and specificity compared to volumetric methods (Rimol et al., 2012).
In addition, the present study explores the relationship between regional measures of cortical morphology and Full IQ as an overall measure of cognitive functioning. Cognitive abilities have been shown to be reduced in the VLBW population (Aarnoudse-Moens et al., 2009; Anderson et al., 2004; Lohaugen et al., 2010; Nosarti et al., 2007; Taylor et al., 2004), and reduced cognitive performance has been related to reduced cortical volume in 14–15 year old VLBW adolescents (Nosarti et al., 2014). Finally, previous studies of VLBW young adults have shown negative correlations between IQ and cortical thickness (Bjuland et al., 2013), and positive correlations with surface area (Skranes et al., 2013). However, these VLBW young adults were born in 1986–1988, and it is unclear whether the same relationships between cortical morphology and cognitive function exist for school aged VLBW children born after year 2000, who have received modern neonatal intensive care.
2. Material and methods
2.1. Participants
2.1.1. VLBW group
The children born prematurely with very low birth weight (VLBW) (birth weight ≤ 1500 g) were recruited based on admittance to the Neonatal Intensive Care Unit (NICU) at St. Olav University Hospital in Trondheim, Norway between 2003 and 2007. Sixty-three non-CP children were invited and 57 agreed to participate in the study (31 females). One child (a twin sibling to a VLBW child) with birth weight at 2090 g was included in the data analysis, and post-hoc analysis showed similar brain morphology and IQ scores for this child as for the VLBW cohort.
2.1.2. Control subjects
The control subjects were recruited from the national Norwegian Mother and Child Cohort Study (MoBa) managed by the Norwegian Institute of Public Health (Magnus et al., 2006), with ages ranging between 4 and 11 years (n = 143, 70 females). The participants included in the current analysis were living in the same geographical area as the VLBW participants (Nord- and Sør-Trøndelag) and had normal vision and hearing. The exclusion criteria were a history of injury or disease known to affect the central nervous system (CNS) function, including neurological or psychiatric illness and serious head trauma. Furthermore, if the child was under psychiatric treatment, used psychoactive drugs known to affect CNS functioning, had a birth weight below 2500 g, or had any known MRI contraindications, they were excluded from participation in the current study.
2.2. MR imaging
2.2.1. Image acquisition
MRI data were collected using a 12-channel head coil on a 1.5 T Siemens Avanto scanner (Siemens Medical Solutions). The pulse sequence used for morphometric analyses was one 3D T1-weighted magnetization prepared rapid acquisition gradient echo (MPRAGE) scan with the following parameters: repetition time (TR), 2400 ms; echo time (TE), 3.61 ms; inversion time (TI), 1000 ms; flip angle, 8°, FOV 240 × 240 and acquisition duration of 4 min and 18 s. Each volume consisted of 160 sagittal slices with voxel sizes of 1.25 × 1.25 × 1.20 mm. The total scan time was on average 30 min. Raw datasets were de-identified and transferred to Linux work-stations for processing. Each MPRAGE was visually inspected and only scans with no or minimal movement artifacts were included in the analyses.
2.2.2. Morphometric image analysis
Cortical reconstruction was performed with the FreeSurfer 5.3.0 image analysis suite, which is documented and freely available for download online (http://surfer.nmr.mgh.harvard.edu/). The technical details of these procedures are described in other publications (Dale et al., 1999; Dale and Sereno, 1993; Fischl et al., 2004a; Fischl and Dale, 2000; Fischl et al., 2001). Briefly, this includes motion correction and averaging (Reuter et al., 2010) of multiple volumetric T1 weighted images, removal of non-brain tissue using a hybrid watershed/surface deformation procedure (Ségonne et al., 2004), automated Talairach transformation, intensity normalization (Sled and Pike, 1998), tessellation of the gray and white matter boundary, automated topology correction (Fischl et al., 2001; Ségonne et al., 2007), and surface deformation following intensity gradients to optimally place the gray/white and gray/cerebrospinal fluid (CSF) borders at the location where the greatest shift in intensity defines the transition to the other tissue class (Dale et al., 1999; Dale and Sereno, 1993; Fischl and Dale, 2000). Once the cortical models are complete, a number of deformable procedures can be performed for further data processing and analysis including surface inflation (Fischl et al., 1999), registration to a spherical atlas which is based on individual cortical folding patterns to match cortical geometry across subjects (Fischl et al., 1999), parcellation of the cerebral cortex into units with respect to the gyral and sulcal structures (Desikan et al., 2006; Fischl et al., 2004b), and creation of a variety of surface based data. This method uses both intensity and continuity information from the entire three-dimensional MR volume in the segmentation and deformation procedures to produce representations of cortical thickness, calculated as the closest distance from the gray/white boundary to the gray/CSF boundary at each vertex on the tessellated surface (Fischl and Dale, 2000). The maps are created using spatial intensity gradients across tissue classes and are therefore not simply reliant on absolute signal intensity.
The two cerebral hemispheres were processed separately. The surfaces were smoothed with a full-width-half-maximum Gaussian kernel of 30 mm (662 iterations). Each surface consisted of approximately 160,000 vertices arranged in a triangular grid, and estimates of the cortical area were obtained by computing the area of each triangle in the standardized, spherical atlas space surface tessellation when mapped into the individual subject space. Vertex-wise estimates of cortical area were then computed by assigning one-third of the area of each triangle to each of its vertices (Rimol et al., 2012). The cortical surface of each subject was automatically parcellated using defined gyri and sulci as landmarks, and the surface was divided into 34 anatomical regions for each brain hemisphere defined in FreeSurfer (Desikan et al., 2006; Fischl et al., 2004a), which were used to anatomically identify the affected regions after significance testing.
In the VLBW group, analyses were conducted based on MR-images from 37 children (21 females). Of the 57 who were eligible for MR-scanning, 10 children did not want to be scanned and had cognitive assessment only, and 10 images were excluded due to movement artifacts or disrupted scanning. In the control group we were able to attain 104 MPRAGE images of good quality (54 females). A total of 143 children were invited to MR imaging, 22 children did not want to participate and 17 of the images had to be excluded due to movement artifacts or disrupted scanning. The youngest participants (5–6 years of age) in both groups were most likely to decline MRI scanning or be excluded due to movement artifacts.
2.3. Cognitive measures
2.3.1. VLBW group
In the VLBW group, children <6 years of age were assessed with the age-appropriate, complete version of the Wechsler Preschool and Primary Scale of Intelligence, 3rd edition (WPPSI-III) (Wechsler, 2002), whereas children ≥ 6 years were assessed with Wechsler Intelligence Scale for Children, 4th edition (WISC- IV) (Wechsler, 2003). WPPSI-III provides three IQ indices: Full Scale IQ, Verbal IQ and Performance IQ, while WISC-IV comprises four indices: Verbal Comprehension Index, Perceptual Reasoning Index, Working Memory Index and Processing Speed Index, and Full Scale IQ.
2.3.2. Control group
Cognitive abilities in the controls who were ≥ 6.5 years of age were assessed with the Wechsler Abbreviated Scale of Intelligence (WASI) (Wechsler, 1999). The WASI is a validated screening test that is used to assess the following aspects of intelligence: verbal knowledge, visual information processing, spatial and nonverbal reasoning, and general intelligence. Three IQ scores can be extracted using the WASI: a Verbal IQ (VIQ) score (subtests: vocabulary and similarities) and a Performance IQ (PIQ) score (subtests: block design and matrices), which when combined provide an estimated Full-scale IQ (FSIQ) score. The controls who were younger than 6.5 years of age completed a short form of the Wechsler Preschool and Primary Scale of Intelligence, 3rd edition (WPPSI-III) (Wechsler, 2003), including similar subtests: vocabulary, similarities, block design and matrices, and Verbal IQ (VIQ), Performance IQ (PIQ) and Full-scale IQ (FSIQ) were calculated.
2.3.3. Statistical analysis
IBM SPSS Statistics 19 edition was used for the analysis of the clinical and cognitive measurements by independent samples t-tests and non-parametric tests. Data with non-equal variances were analyzed with non-parametric testing. Matlab 2011b was used for statistical analyses of morphometry data. To examine group differences, a general linear model was fitted with cortical surface area or cortical thickness as dependent variable and group, sex and age at MRI scan as independent variables in each vertex across the cortical surface. The regression of IQ on cortical morphology was tested with the same GLM with Full IQ as an added continuous predictor. Appropriate contrast vectors were set in order to perform the various significance tests. The hemispheres were analyzed separately, and effect size and p-maps were generated. Effect size is reported as Cohen's d for group comparisons and r = F / (F + df) for the continuous predictors (IQ and birth weight). The p-maps were thresholded and multiple comparisons were corrected for with a 5% false discovery rate (FDR) that was applied co-jointly across the hemispheres. Significance tests were performed to investigate differences in cortical morphology between the groups. For the clinical variables birth weight, gestational age, and days on ventilator general linear models were fitted in each vertex across the surface, with cortical surface area or cortical thickness as the dependent variable and one of the clinical variables as a covariate, and adjusted for sex and age at MRI scan. These analyses were performed in the VLBW group exclusively. Findings on any of these clinical variables were followed up with further exploratory analyses.
2.3.4. Imputation of missing data
Missing data in the independent variables (Full IQ and birth weight) were dealt with by multiple imputations. Pattern analysis was performed, showing that we had below 5% missing data and that we could assume that data were missing at random. Seven Full IQ data and two birth weights were imputed and pooled imputations were used in further analyses.
2.3.5. Socio-economic status
Hollingshead's (1975) two factor index of social position based on education and occupation of one parent or the mean index of both was used to calculate socio-economic status (SES).
2.3.6. Ethics
The Regional Committee for Medical Research Ethics approved the study protocol (project number: 2010/2359), and written informed consent was obtained from the parent/guardian of all participants.
3. Results
3.1. Group characteristics
Demographic and clinical characteristics of the study groups are shown in Table 1. In the VLBW group, mean birth weight was 1048 g and mean gestational age was 28.5 weeks. Detailed perinatal data for the VLBW children are presented in Appendix Table A1. There was no significant group difference in age at examination; however, the controls had higher mean socioeconomic status (SES) than the VLBW group. The VLBW group had significantly lower scores than controls on Full IQ, also after adjusting for socioeconomic status (n = 34/85).
Table 1.
Demographic and clinical characteristics.
| VLBW/Control number | VLBW Mean (SD/median) |
Controls Mean (SD) |
p value | |
|---|---|---|---|---|
| Age (years) | 37/104 | 7.8 (1.73) | 8.2 (1.02) | 0.352b |
| Gender (boys/girls) | 37/104 | 16/21 | 50/54 | 0.616 |
| Birth weight (grams) | 37/104 | 1050 (358) | 3657 (484) | < 0.001 |
| Gestational age (weeks) | 37 | 28.5 (28) | na | |
| SES | 34/85 | 3.9 (0.9 ) | 4.3 (0.8) | 0.021 |
| Full IQ | 37/104 | 98 (10) | 108 (14) | < 0.001a |
Abbreviations: VLBW: very low birth weight; SES: socio-economic status; SD: standard deviation; na: not available.
Adjusted for socio-economic status.
Non-parametric due to non-equal variance.
3.2. Structural MRI
3.2.1. Cortical surface area group differences
There were significant differences in cortical surface area between the VLBW and the control group. The VLBW group showed bilateral reduction in cortical surface area in the frontal, temporal, and parietal lobes (Fig. 1). The effect size of the group difference ranged from d = 0.4 to 0.8 in most cortical regions (see Appendix Fig. A1). Table 2 lists all cortical regions with significant group differences in surface area as determined by the GLM (after 5% FDR correction), where 20 out of 35 regions had ≥90% reduction of cortical surface area in the VLBW group compared with controls.
Fig. 1.
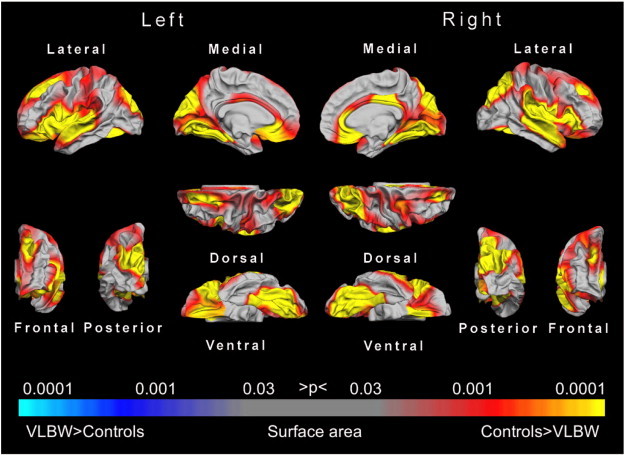
Statistical p-maps showing cortical regions with significant differences in surface area between the VLBW and the control groups. The maps were produced from GLM models fitted at each location (vertex) across the cortical surface, with cortical area as the dependent variable and group as the independent variable, co-varying for sex and age at scan. The maps were thresholded to yield an expected 5% FDR across both hemispheres. The red to yellow regions are those where the VLBW group showed reduced surface area, whereas blue regions would reflect areas with increased surface area in the VLBW group compared to controls. Abbreviations: FDR, false discovery rate; GLM, general linear model; VLBW, very low birth weight.
Table 2.
Proportion (%) of cortical regions showing significant differences in cortical surface area between VLBW and controls.
| Cortical region of interest |
Proportion (%) of region |
|
|---|---|---|
| Left | Right | |
| Banks of the superior temporal gyrus | 68 | 91 |
| Caudal anterior cingulate gyrus | 80 | 99 |
| Caudal middle frontal gyrus | 85 | 63 |
| Cuneus | 100 | 100 |
| Entorhinal cortex | 4 | 4 |
| Fusiform gyrus | 79 | 75 |
| Frontal pole | 100 | 1 |
| Inferior parietal gyrus | 58 | 66 |
| Inferior temporal gyrus | 10 | 16 |
| Isthmus cingulate | 51 | 97 |
| Insula | 99 | 98 |
| Lateral occipital gyrus | 51 | 47 |
| Lateral orbitofrontal gyrus | 100 | 99 |
| Lingual gyrus | 100 | 100 |
| Medial orbitofrontal gyrus | 100 | 84 |
| Middle temporal gyrus | 50 | 63 |
| Parahippocampal gyrus | 97 | 97 |
| Paracentral gyrus | 1 | 0 |
| Pars opercularis | 99 | 100 |
| Pars orbitalis | 100 | 79 |
| Pars triangularis | 96 | 95 |
| Pericalcarine sulcus | 100 | 100 |
| Postcentral gyrus | 90 | 54 |
| Posterior cingulate | 64 | 92 |
| Precentral gyrus | 62 | 79 |
| Precuneus | 62 | 58 |
| Rostral anterior cingulate | 99 | 100 |
| Rostral middle frontal gyrus | 37 | 21 |
| Superior frontal gyrus | 58 | 51 |
| Superior parietal gyrus | 75 | 86 |
| Superior temporal gyrus | 99 | 100 |
| Supramarginal gyrus | 71 | 91 |
| Temporal pole | 33 | 37 |
| Transverse temporal gyrus | 100 | 100 |
The table presents the percentage of surface area in each of the cortical parcellations (defined by the Desikan–Killiany parcellation scheme implemented in FreeSurfer) that showed a significant result in the GLM (after 5% FDR correction). The calculations of proportion of surface area were based on the fsaverage surface (∗h.white.avg.area.mgh).
Abbreviations: FDR, false discovery rate; GLM, general linear model; VLBW, very low birth weight.
3.2.2. Cortical surface area and IQ
In the control group, there were widespread cortical regions in both hemispheres showing a significant relationship between Full IQ scores and cortical surface area (see Appendix Fig. A2 and Table A2). In the VLBW group, the relationship between Full IQ scores and cortical surface area did not reach statistical significance. However, the correlation coefficients were 0.2–0.4 in several cortical regions in both groups, and as high as 0.6 in some regions in the VLBW group (Fig. 2). The lack of statistical significance in these analyses is readily explained by loss of statistical power due to the smaller sample size.
Fig. 2.
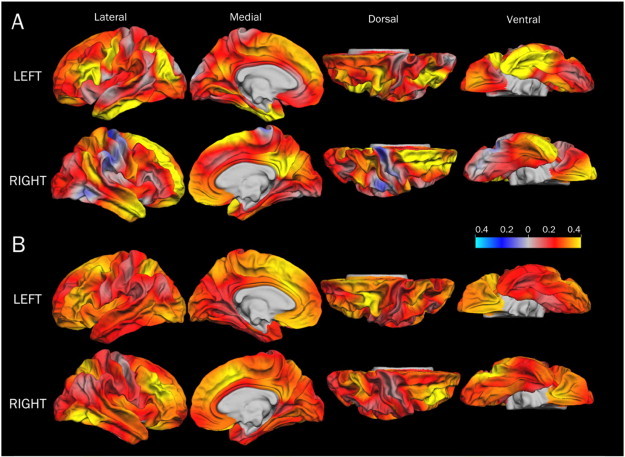
Effect size maps (r) for cortical surface area and Full IQ scores in the VLBW (A) and the control (B) groups. The effect sizes are based on GLMs with cortical surface area as the dependent variable, group and sex as categorical predictors, and age and Full IQ index score as continuous predictors. Red to yellow indicate a positive correlation and blue to light blue indicate a negative correlation. Only the results for the control group reached statistical significance (see Fig. A2). Abbreviations: GLM: general linear model; VLBW: very low birth weight.
3.2.3. Cortical thickness group differences
The VLBW group showed significantly thicker cortex in the frontal (medial orbitofrontal gyrus, rostral anterior cingulate, frontal pole) and occipital regions (pericalcarine sulcus) bilaterally, and a thinner cortex in the right posterior parietal lobe compared with controls (Fig. 3). Moderate to large effect sizes (d = 0.6–0.8) were observed in the frontal and occipital regions (Appendix Fig. A3).
Fig. 3.
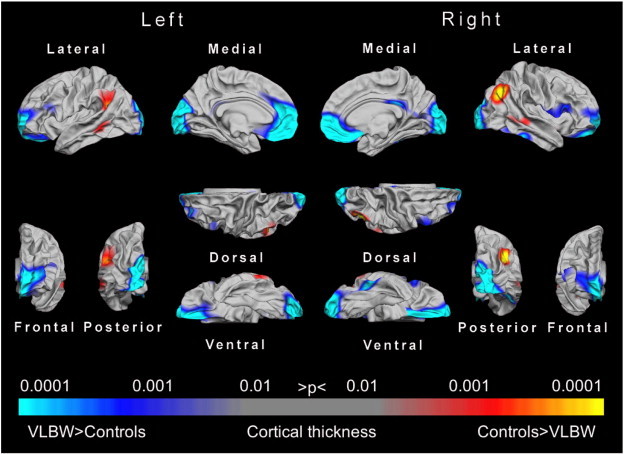
Statistical p-maps showing cortical regions with significant differences in cortical thickness between the VLBW group and the control group. The maps were produced from GLMs fitted at each location (vertex) across the cortical surface, with cortical thickness as the dependent variable and group as the independent variable, co-varying for sex and age. The maps were thresholded to yield an expected 5% FDR. The FDR threshold was obtained for the left and right hemispheres conjointly. Red to yellow denote regions with cortical thinning in the VLBW group, and blue to light blue denote regions with cortical thickening in the VLBW group. Abbreviations: FDR, false discovery rate; GLM, general linear model; VLBW, very low birth weight.
Proportion (%) of cortical regions with significant differences in thickness between the VLBW and the control groups is displayed in Table A3 (Appendix) with >90% involvement of the frontal poles, medial orbitofrontal gyri, left rostral anterior cingulate and right pericalcarine sulcus. Fig. A4 (Appendix) demonstrates the degree of spatial overlap between the observed between-group differences in cortical surface area and cortical thickness.
3.2.4. Cortical thickness and IQ
There were no significant correlations between cortical thickness and Full IQ in either group. However, the effect size maps in Fig. 4 demonstrate a trend-level negative relationship between cortical thickness and Full IQ in both groups in widespread cortical regions, i.e. the thinner the cortex, the higher the IQ scores (Fig. 4, blue regions). Some temporal and parietal regions showed a positive relationship to Full IQ in the VLBW group, i.e. thinner cortex was related to lower IQ scores (Fig. 4, red regions).
Fig. 4.
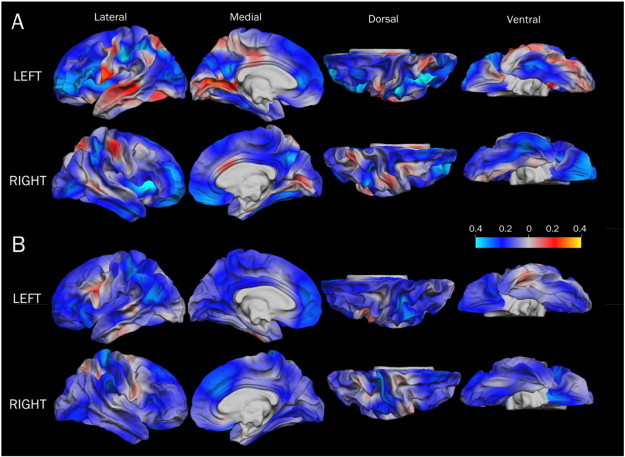
Effect size maps (r) for the association between cortical thickness and Full IQ in the VLBW group (A) and the control group (B). The effect sizes are based on GLMs with cortical thickness as dependent variable, sex as categorical predictors, and age at scan and Full IQ as continuous predictors. Red to yellow indicate a positive correlation and blue to light blue indicate a negative correlation. Abbreviations: GLM, general linear model; VLBW, very low birth weight.
3.2.5. Clinical variables: birth weight, gestational age and number of days on ventilator
There were no significant associations between birth weight or gestational age and cortical area or cortical thickness in the VLBW group. There was, however, a significant effect of days on ventilator on surface area bilaterally in the dorsal frontal regions, including the superior and medial frontal gyrus, precentral gyrus, and orbitofrontal cortex, as well as the left supramarginal and posterior superior temporal gyrus, and the right precuneus and superior parietal gyrus. There were two subjects with extreme scores on days on ventilator, i.e. more than 3 weeks on ventilator (35 and 47 days), and these subjects also had low gestational age (23.5, 26 weeks). Region-of-interest based examination of cortical surface area and cortical thickness showed that the child with 47 days on ventilator was an outlier on 5 of 36 cortical parcellations (>2 SD from the mean in the control group), and the child with 35 days on ventilator was an outlier in one parcellation. Excluding these two subjects from the analysis of group differences between VLBW and controls did not affect the results. Finally, in order to check the effect of prolonged exposure to the ventilator, we excluded children who had spent more than 10 days on ventilator. Since this reduces the statistical power to detect, because the sample is smaller than that in the full analysis, we compared maps of effect size (Cohen's d). The maps from the analyses with the reduced sample are presented in Appendix Fig. A5.
4. Discussion
We report significant reduction of cortical surface area in 5–10 year old VLBW children, relative to a term-born control group. Cortical area was reduced in frontal, temporal, parietal, and occipital regions, and cortical thickness was increased in the medial frontal and occipital lobes, in the VLBW group. Moreover, there were medium sized to large correlations between reduced surface area and thicker cortex and poorer IQ scores, in both the VLBW and the control group. However, only in the control group did correlations between reduced surface area and IQ reach statistical significance.
4.1. Widespread cortical surface area differences between the groups
The VLBW children showed significantly reduced cortical surface area in frontal, temporal, posterior parietal and medial occipital regions, as well as the right anterior cingulate (see Fig. 1). Cortical surface area expands significantly during preschool years and into adolescence in normally developing children, with the greatest changes occurring in higher order regions such as the prefrontal cortex and temporal association cortex (Brown and Jernigan, 2012). However, by the age of 10, the occipital and superior parietal lobes start to show a decrease in surface area, most probably due to pruning (Brown and Jernigan, 2012). Hence, the reduced surface area observed in the VLBW children could reflect altered maturation of cortical surface area.
Reduced cortical surface area has previously been reported in extremely low birth weight (ELBW) children at the age of 10 (Grunewaldt et al., 2014), VLBW adolescents at 15–16 years of age (Frye et al., 2010), and VLBW late adolescents at 19 years of age (Skranes et al., 2013). The magnitudes of reduction, and precisely which gyri/sulci are affected, differ somewhat between these studies. However, Skranes et al. (2013) reported reductions in cortical surface area similar to the reductions observed in the present study, both in terms of magnitude and localization of the affected regions. The fact that similar cortical regions are affected in cohorts aged 5–10 and 18–20, suggests that the morphological abnormalities observed in the present study may not simply reflect delayed maturation but rather aberrant development leading to permanently altered cortical architecture. These results also demonstrate that similar cortical changes are found both in VLBW survivors born in the late 80s and after year 2000, in spite of the advances in perinatal medicine. We speculate whether the explanation for this has to do with prenatal factors, such as fetal growth restriction, or that immature birth exposes the neonate to environmental factors such as inflammation that exert an epigenetic influence on the genes controlling normal cortical development.
Performing the analyses of group differences in cortical surface area without the two children who had extreme scores on days on ventilator (32 and 45 days), did not affect the results. Excluding children who had been on ventilator for more than 10 days, in order to exclude a possible effect of prolonged respiratory support on cortical surface area, we observed similar group differences in cortical morphometry as for the full sample, albeit with reduced effect sizes in most regions. However, excluding children with more than 10 days on ventilator implies excluding many of the most immature and sickest individuals, and leaves us with a sample that is not representative of the premature birth population. Nonetheless, it is worth noting that even when subjects with prolonged respiratory support were excluded, a number of cortical regions still showed group differences. One could speculate whether this may reflect adverse prenatal factors, since these regions show cortical deviations even in the individuals who require the least amount of neonatal care.
4.2. Frontal and occipital cortical thickening in VLBW children
The VLBW children showed thicker cortex in the frontal and occipital lobes bilaterally, which is consistent with previous studies reporting increased cortical thickness in both children and adolescents born prematurely (Bjuland et al., 2013; Grunewaldt et al., 2014; Martinussen et al., 2005; Mürner-Lavanchy et al., 2014; Phillips et al., 2011). With normal development of the cerebral cortex, thickness will increase during early childhood due to late arriving interneurons then decrease, due to pruning, as neural connectivity improves (Raznahan et al., 2011; Shaw et al., 2012; Wierenga et al., 2014). Sowell et al. (2004) reported that the pattern of progressive cortical thinning varies across development, in a longitudinal study of normally developing children 5–11 years old, observing a significant cortical thinning in the dorsolateral frontal regions and bilateral parietal–occipital regions, and cortical thickening in perisylvian regions of the ventral frontal lobe and superior temporal lobe with increasing age.
Children develop at varying paces and one possible explanation for the group differences in cortical thickness in our study is delayed maturation in the VLBW group. This would be consistent with Mürner-Lavancy's (2014) study of VLBW children and term-born controls, 7–12 years old, which reported thicker frontal and parietal cortices in the youngest VLBW children compared to controls but no such group difference in the oldest children. Also partly consistent with this, Grunewaldt et al. (2014) found cortical thickness differences exclusively in the occipital lobe at 10 years of age in a cohort of ELBW. On the other hand, Bjuland et al. (2013) found increased cortical thickness in frontal and occipital regions, but also thinner cortex in frontal, parietal and temporal regions, in 19 year old VLBW adolescents. Thus, it is unclear whether the differences observed in the present study reflect aberrant development and permanent cortical changes or, rather, divergent developmental cortical trajectories that converge with increasing age. Longitudinal studies are needed to answer such questions, in order to conclusively determine whether VLBW children born after 2000 have permanent changes in cortical thickness similar to what has been reported for children born in the late 80s.
4.3. The relationship between cortical surface area and thickness
Panizzon et al. (2009) demonstrated that cortical area and cortical thickness reflect at least two distinct sources of genetic influence, consistent with the developmental origin of cortical architecture described by the radial unit hypothesis (Rakic, 1988), and other studies have suggested independent and divergent developmental trajectories for area and thickness (Raznahan et al., 2011; Shaw et al., 2012; Wierenga et al., 2014). In line with this, we found that regions displaying group differences in surface area and cortical thickness overlapped to a limited extent (as shown in Fig. A4). Regions displaying overlapping effects were mainly located on the mesial aspect of the hemispheres; anteriorly in the anterior portion of the SFG, medial orbitofrontal cortex, and anterior cingulate, and posteriorly in the pericalcarine sulcus and cuneus.
The VLBW children in the present study were born between 23 and 35 weeks of gestation, which is a particularly sensitive period of neural migration and rapid cortical development. Disorders of migration are more likely to occur in the second trimester (Zhang et al., 2013) by either under-migration or over-migration of neurons, and both will lead to cortical abnormalities (Fogliarini et al., 2005). Preterm birth may affect processes like neuronal migration, synaptogenesis and apoptosis late in the 2nd and early 3rd trimesters (Tau and Peterson, 2010) resulting in the kind of deviant cortical thickness and reduced surface area observed here.
The migration of neuroprogenitor cells may be hindered in preterm children by germinal matrix hemorrhages that can destroy neuronal precursors, or by injury to guiding glial cells (Volpe, 2009). A reduced pool of neuroprogenitor cells and deficient migration can lead to a reduced number of founder cells in the ventricular zone and number of cerebral columns, which may result in decreased surface area (Rakic, 1995). However, in our study only three out of 37 VLBW children had intraventricular hemorrhages and none had focal PVL, suggesting that focal perinatal brain injury is probably not the cause of the cortical deviations seen in our VLBW group.
Within 28–32 weeks of gestation a fast emergence of short-range connectivity, in addition to the long-range association pathways, is observed (Takahashi et al., 2012). In the VLBW population, reduced fractional anisotropy has been reported in the inferior longitudinal and the longitudinal occipito-frontal fascicles (Eikenes et al., 2011; Skranes et al., 2007). Whether diffuse white matter injury causing disrupted connectivity and cortical reorganization leads to reductions in surface area and increased cortical thickness in the VLBW is not known, but cannot be excluded as an explanation for the presently observed cortical changes. The frontal, parietal and occipital regions with deviant cortical surface area and/or increased thickness in the VLBW children are all regions involved in networks receiving long-range association tracts. We therefore speculate that the deviations seen in cortical morphology in the VLBW group may be both primary changes due to cortical maldevelopment as well as secondary to altered white matter microstructure and connectivity.
4.4. Cortical morphology and cognitive measures
A positive association between cortical surface area and IQ was observed in both VLBW and control subjects, albeit as a non-significant trend in the VLBW group. However, the magnitude of the effect was larger in frontal, temporal and medial parietal regions in the VLBW group than that in the control group, although these structure–function associations survived significance testing only in the control group due to its larger sample size.
The frontal regions in which surface area was related with IQ included the caudal middle frontal gyrus, lateral orbitofrontal gyrus, medial orbitofrontal gyrus, pars orbitalis, rostral anterior cingulate, frontal pole and insula. These are regions where the VLBW children have significantly reduced surface area in comparison with controls, and are believed to be important for cognitive functions such as decision making, executive functions, semantics, attention, and working memory. Previous studies have consistently shown poorer executive abilities in individuals born with VLBW than term-born peers, as well as problems with attention and working memory (Aarnoudse-Moens et al., 2009; Bayless and Stevenson, 2007; Anderson, 2014; Lohaugen et al., 2010;Anderson et al., 2004), and in the present study, the VLBW group had lower IQ scores than those of the controls. Our results indicate that a larger surface area is positively correlated to higher IQ, consistent with Skranes et al. (2013), and it is tempting to speculate that reduced cognitive function in the VLBW group may be caused, at least in part, by the observed reduction in surface area.
There was a negative association, albeit not significant, between IQ and cortical thickness in both groups. In the VLBW group, the regions with the strongest negative associations between IQ and cortical thickness were also the regions where the VLBW children displayed thicker cortex than controls. This is consistent with previous studies of the relationship between cortical thickness and cognitive functions in normally developing 5–11 year old children, where cortical thinning in the left dorsal frontal and parietal lobes was correlated with improved verbal performance (Sowell et al., 2004). Moreover, in VLBW adolescents with low IQ, Full IQ and cortical thickness were negatively correlated in the frontal and positively correlated in the parietal lobes (Bjuland et al., 2013). Taken together, our findings suggest that altered cortical development in VLBW children seems to affect their cognitive abilities; however, longitudinal studies are needed to determine whether these deviations persist during further brain maturation throughout school age, adolescence and into early adulthood also for these recent year cohorts of VLBW children.
4.5. Conclusion
The present study demonstrates altered development of cortical surface and cortical thickness in VLBW children born in 2003–2007, and these deviations are associated with poorer cognitive abilities. The present brain morphological deviations are evident even in VLBW children without cerebral palsy who have received state of the art medical treatment in the perinatal period, and who did not present with focal brain injuries on neonatal ultrasonography.
Conflicts of interest
The authors declare no competing financial interests.
Acknowledgments
We thank the children and their parents for participating in the study. We also want to thank our project collaborators Profs. Kristine B. Walhovd and Anders M. Fjell at the Department of Psychology, University of Oslo, Norway. This study received funding from the Research Council of Norway (Frimed program — project number 204935/F20).
Appendix A. Supplementary data
Supplementary material.
References
- Aarnoudse-Moens C.S.H., Weisglas-Kuperus N., van Goudoever J.B., Oosterlaan J. Meta-analysis of neurobehavioral outcomes in very preterm and/or very low birth weight children. Pediatrics. 2009;124(2):717–728. doi: 10.1542/peds.2008-2816. 19651588 [DOI] [PubMed] [Google Scholar]
- Ajayi-Obe M., Saeed N., Cowan F.M., Rutherford M.A., Edwards A.D. Reduced development of cerebral cortex in extremely preterm infants. Lancet. 2000;356(9236):1162–1163. doi: 10.1016/s0140-6736(00)02761-6. 11030298 [DOI] [PubMed] [Google Scholar]
- Anderson P.J. Neuropsychological outcomes of children born very preterm. Semin. Fetal Neonat. Med. 2014;19:90–96. doi: 10.1016/j.siny.2013.11.012. 24361279 [DOI] [PubMed] [Google Scholar]
- Anderson P.J., Doyle L.W., Victorian Infant Collaborative Study Group Executive functioning in school-aged children who were born very preterm or with extremely low birth weight in the 1990s. Pediatrics. 2004;114(1):50–57. doi: 10.1542/peds.114.1.50. 15231907 [DOI] [PubMed] [Google Scholar]
- Ball G., Srinivasan L., Aljabar P., Counsell S.J., Durighel G., Hajnal J.V., Rutherford M.A., Edwards A.D. Development of cortical microstructure in the preterm human brain. Proc. Natl. Acad. Sci. U. S. A. 2013;110(23):9541–9546. doi: 10.1073/pnas.1301652110. 23696665 [DOI] [PMC free article] [PubMed] [Google Scholar]
- Bayless S., Stevenson J. Executive functions in school-age children born very prematurely. Early Hum. Dev. 2007;83(4):247–254. doi: 10.1016/j.earlhumdev.2006.05.021. 16837146 [DOI] [PubMed] [Google Scholar]
- Grunewaldt K.H., Fjørtoft T., Bjuland K.J., Brubakk A.-M., Eikenes L., Håberg A.K., Løhaugen G.C., Skranes J. Follow-up at age 10 years in ELBW children — functional outcome, brain morphology and results from motor assessments in infancy. Early Hum. Dev. 2014;90(10):571–578. doi: 10.1016/j.earlhumdev.2014.07.005. 25103790 [DOI] [PubMed] [Google Scholar]
- Bjuland K.J., Løhaugen G.C.C., Martinussen M., Skranes J. Cortical thickness and cognition in very-low-birth-weight late teenagers. Early Hum. Dev. 2013;89(6):371–380. doi: 10.1016/j.earlhumdev.2012.12.003. 23273486 [DOI] [PubMed] [Google Scholar]
- Bjuland K.J., Rimol L.M., Løhaugen G.C.C., Skranes J. Brain volumes and cognitive function in very-low-birth-weight (VLBW) young adults. Eur. J. Paediatr. Neurol. 2014;18(5):578–590. doi: 10.1016/j.ejpn.2014.04.004. 24775377 [DOI] [PubMed] [Google Scholar]
- Brown T.T., Jernigan T.L. Brain development during the preschool years. Neuropsychol. Rev. 2012;22(4):313–333. doi: 10.1007/s11065-012-9214-1. 23007644 [DOI] [PMC free article] [PubMed] [Google Scholar]
- Dale A.M., Fischl B., Sereno M.I. Cortical surface-based analysis. I. Segmentation and surface reconstruction. Neuroimage. 1999;9(2):179–194. doi: 10.1006/nimg.1998.0395. 9931268 [DOI] [PubMed] [Google Scholar]
- Dale A.M., Sereno M.I. Improved localization of cortical activity by combining EEG and MEG with MRI cortical surface reconstruction: a linear approach. J. Cogn. Neurosci. 1993;5(2):162–176. doi: 10.1162/jocn.1993.5.2.162. 23972151 [DOI] [PubMed] [Google Scholar]
- Desikan R.S., Ségonne F., Fischl B., Quinn B.T., Dickerson B.C., Blacker D., Buckner R.L., Dale A.M., Maguire R.P., Hyman B.T., Albert M.S., Killiany R.J. An automated labeling system for subdividing the human cerebral cortex on MRI scans into gyral based regions of interest. Neuroimage. 2006;31(3):968–980. doi: 10.1016/j.neuroimage.2006.01.021. 16530430 [DOI] [PubMed] [Google Scholar]
- Eikenes L., Løhaugen G.C., Brubakk A.M., Skranes J., Håberg A.K. Young adults born preterm with very low birth weight demonstrate widespread white matter alterations on brain DTI. Neuroimage. 2011;54(3):1774–1785. doi: 10.1016/j.neuroimage.2010.10.037. 20965255 [DOI] [PubMed] [Google Scholar]
- Fischl B., Dale A.M. Measuring the thickness of the human cerebral cortex from magnetic resonance images. Proc. Natl. Acad. Sci. U. S. A. 2000;97(20):11050–11055. doi: 10.1073/pnas.200033797. 10984517 [DOI] [PMC free article] [PubMed] [Google Scholar]
- Fischl B., Liu A., Dale A.M. Automated manifold surgery: constructing geometrically accurate and topologically correct models of the human cerebral cortex. I. E.E.E. Transactions Med. Imaging. 2001;20(1):70–80. doi: 10.1109/42.906426. 11293693 [DOI] [PubMed] [Google Scholar]
- Fischl B., Salat D.H., Van Der Kouwe A.J.W., Makris N., Ségonne F., Quinn B.T., Dale A.M. Sequence-independent segmentation of magnetic resonance images. Neuroimage. 2004;23(Suppl. 1):S69–S84. doi: 10.1016/j.neuroimage.2004.07.016. 15501102 [DOI] [PubMed] [Google Scholar]
- Fischl B., Sereno M.I., Dale A.M. Cortical surface-based analysis. II: inflation, flattening, and a surface-based coordinate system. Neuroimage. 1999;9(2):195–207. doi: 10.1006/nimg.1998.0396. 9931269 [DOI] [PubMed] [Google Scholar]
- Fischl B., Sereno M.I., Tootell R.B.H., Dale A.M. High-resolution intersubject averaging and a coordinate system for the cortical surface. Hum. Brain Mapp. 1999;8(4):272–284. doi: 10.1002/(SICI)1097-0193(1999)8:4<272::AID-HBM10>3.0.CO;2-4. 10619420 [DOI] [PMC free article] [PubMed] [Google Scholar]
- Fischl B., Van Der Kouwe A., Destrieux C., Halgren E., Ségonne F., Salat D.H., Busa E., Seidman L.J., Goldstein J., Kennedy D., Caviness V., Makris N., Rosen B., Dale A.M. Automatically parcellating the human cerebral cortex. Cereb. Cortex. 2004;14(1):11–22. doi: 10.1093/cercor/bhg087. 14654453 [DOI] [PubMed] [Google Scholar]
- Fogliarini C., Chaumoitre K., Chapon F., Fernandez C., Lévrier O., Figarella-Branger D., Girard N. Assessment of cortical maturation with prenatal MRI. Part I: normal cortical maturation. Eur. Radiol. 2005;15(8):1671–1685. doi: 10.1007/s00330-005-2782-1. 15856237 [DOI] [PubMed] [Google Scholar]
- Frye R.E., Malmberg B., Swank P., Smith K., Landry S. Preterm birth and maternal responsiveness during childhood are associated with brain morphology in adolescence. J Int Neuropsychol Soc. 2010;16(5):784–794. doi: 10.1017/S1355617710000585. 20609271 [DOI] [PubMed] [Google Scholar]
- Hollingshead A.d.B. Four Factor Index of Social Status. Yale Univ., Department of Sociology; 1975. [Google Scholar]
- Kapellou O., Counsell S.J., Kennea N., Dyet L., Saeed N., Stark J. Abnormal cortical development after premature birth shown by altered allometric scaling of brain growth. PLOS Med. 2006;3(8):e265. doi: 10.1371/journal.pmed.0030265. 16866579 [DOI] [PMC free article] [PubMed] [Google Scholar]
- Løhaugen G.C., Gramstad A., Evensen K.A., Martinussen M., Lindqvist S., Indredavik M., Vik T., Brubakk A.M., Skranes J. Cognitive profile in young adults born preterm at very low birthweight. Dev. Med. Child Neurol. 2010;52(12):1133–1138. doi: 10.1111/j.1469-8749.2010.03743.x. 21175467 [DOI] [PubMed] [Google Scholar]
- Magnus P., Irgens L.M., Haug K., Nystad W., Skjærven R., Stoltenberg C., MoBa Study Group Cohort profile: the Norwegian Mother and Child Cohort Study (MoBa) International. J. Epidemiol. 2006;35(5):1146–1150. doi: 10.1093/ije/dyl170. 16926217 [DOI] [PubMed] [Google Scholar]
- Martinussen M., Fischl B., Larsson H.B., Skranes J., Kulseng S., Vangberg T.R., Vik T., Brubakk A.M., Haraldseth O., Dale A.M. Cerebral cortex thickness in 15-year-old adolescents with low birth weight measured by an automated MRI-based method. Brain. 2005;128(11):2588–2596. doi: 10.1093/brain/awh610. 16123146 [DOI] [PubMed] [Google Scholar]
- Mürner-Lavanchy I., Steinlin M., Nelle M., Rummel C., Perrig W.J., Schroth G., Everts R. Delay of cortical thinning in very preterm born children. Early Hum. Dev. 2014;90(9):443–450. doi: 10.1016/j.earlhumdev.2014.05.013. [DOI] [PubMed] [Google Scholar]
- Nosarti C., Giouroukou E., Micali N., Rifkin L., Morris R.G., Murray R.M. Impaired executive functioning in young adults born very preterm. J Int Neuropsychol Soc. 2007;13(4):571–581. doi: 10.1017/S1355617707070725. 17521479 [DOI] [PubMed] [Google Scholar]
- Nosarti C., Nam K.W., Walshe M., Murray R.M., Cuddy M., Rifkin L., Allin M.P.G. Preterm birth and structural brain alterations in early adulthood. Neuroimage Clin. 2014;6:180–191. doi: 10.1016/j.nicl.2014.08.005. 25379430 [DOI] [PMC free article] [PubMed] [Google Scholar]
- Panizzon M.S., Fennema-Notestine C., Eyler L.T., Jernigan T.L., Prom-Wormley E., Neale M., Jacobson K., Lyons M.J., Grant M.D., Franz C.E., Xian H., Tsuang M., Fischl B., Seidman L., Dale A., Kremen W.S. Distinct genetic influences on cortical surface area and cortical thickness. Cereb. Cortex. 2009;19(11):2728–2735. doi: 10.1093/cercor/bhp026. 19299253 [DOI] [PMC free article] [PubMed] [Google Scholar]
- Phillips J.P., Montague E.Q., Aragon M., Lowe J.R., Schrader R.M., Ohls R.K., Caprihan A. Prematurity affects cortical maturation in early childhood. Pediatr. Neurol. 2011;45(4):213–219. doi: 10.1016/j.pediatrneurol.2011.06.001. 21907880 [DOI] [PMC free article] [PubMed] [Google Scholar]
- Rakic P. Specification of cerebral cortical areas. Science. 1988;241(4862):170–176. doi: 10.1126/science.3291116. 3291116 [DOI] [PubMed] [Google Scholar]
- Rakic P. A small step for the cell, a giant leap for mankind: a hypothesis of neocortical expansion during evolution. Trends Neurosci. 1995;18(9):383–388. doi: 10.1016/0166-2236(95)93934-p. 7482803 [DOI] [PubMed] [Google Scholar]
- Raznahan A., Shaw P., Lalonde F., Stockman M., Wallace G.L., Greenstein D., Clasen L., Gogtay N., Giedd J.N. How does your cortex grow? J. Neurosci. 2011;31(19):7174–7177. doi: 10.1523/JNEUROSCI.0054-11.2011. 21562281 [DOI] [PMC free article] [PubMed] [Google Scholar]
- Reuter M., Rosas H.D., Fischl B. Highly accurate inverse consistent registration: a robust approach. Neuroimage. 2010;53(4):1181–1196. doi: 10.1016/j.neuroimage.2010.07.020. 20637289 [DOI] [PMC free article] [PubMed] [Google Scholar]
- Rimol L.M., Nesvåg R., Hagler D.J., Jr, Bergmann O., Fennema-Notestine C., Hartberg C.B., Haukvik U.K., Lange E., Pung C.J., Server A., Melle I., Andreassen O.A., Agartz I., Dale A.M. Cortical volume, surface area, and thickness in schizophrenia and bipolar disorder. Biol. Psychiatry. 2012;71(6):552–560. doi: 10.1016/j.biopsych.2011.11.026. 22281121 [DOI] [PubMed] [Google Scholar]
- Ségonne F., Dale A.M., Busa E., Glessner M., Salat D., Hahn H.K., Fischl B. A hybrid approach to the skull stripping problem in MRI. Neuroimage. 2004;22(3):1060–1075. doi: 10.1016/j.neuroimage.2004.03.032. 15219578 [DOI] [PubMed] [Google Scholar]
- Ségonne F., Pacheco J., Fischl B. Geometrically accurate topology-correction of cortical surfaces using nonseparating loops. I. E.E.E. Transactions Med. Imaging. 2007;26(4):518–529. doi: 10.1109/TMI.2006.887364. 17427739 [DOI] [PubMed] [Google Scholar]
- Shaw P., Malek M., Watson B., Sharp W., Evans A., Greenstein D. Development of cortical surface area and gyrification in attention-deficit/hyperactivity disorder. Biol. Psychiatry. 2012;72(3):191–197. doi: 10.1016/j.biopsych.2012.01.031. 22418014 [DOI] [PMC free article] [PubMed] [Google Scholar]
- Skranes J., Løhaugen G.C.C., Martinussen M., Håberg A., Brubakk A.M., Dale A.M. Cortical surface area and IQ in very-low-birth-weight (VLBW) young adults. Cortex. 2013;49(8):2264–2271. doi: 10.1016/j.cortex.2013.06.001. 23845237 [DOI] [PubMed] [Google Scholar]
- Skranes J., Vangberg T.R., Kulseng S., Indredavik M.S., Evensen K.A.I., Martinussen M., Dale A.M., Haraldseth O., Brubakk A.M. Clinical findings and white matter abnormalities seen on diffusion tensor imaging in adolescents with very low birth weight. Brain. 2007;130(3):654–666. doi: 10.1093/brain/awm001. 17347255 [DOI] [PubMed] [Google Scholar]
- Sled J.G., Pike G.B. Standing-wave and RF penetration artifacts caused by elliptic geometry: an electrodynamic analysis of MRI. I. E.E.E. Transactions Med. Imaging. 1998;17(4):653–662. doi: 10.1109/42.730409. 9845320 [DOI] [PubMed] [Google Scholar]
- Sowell E.R., Thompson P.M., Leonard C.M., Welcome S.E., Kan E., Toga A.W. Longitudinal mapping of cortical thickness and brain growth in normal children. J. Neurosci. 2004;24(38):8223–8231. doi: 10.1523/JNEUROSCI.1798-04.2004. 15385605 [DOI] [PMC free article] [PubMed] [Google Scholar]
- Takahashi E., Folkerth R.D., Galaburda A.M., Grant P.E. Emerging cerebral connectivity in the human fetal brain: an MR tractography study. Cereb. Cortex. 2012;22(2):455–464. doi: 10.1093/cercor/bhr126. 21670100 [DOI] [PMC free article] [PubMed] [Google Scholar]
- Tau G.Z., Peterson B.S. Normal development of brain circuits. Neuropsychopharmacology. 2010;35(1):147–168. doi: 10.1038/npp.2009.115. 19794405 [DOI] [PMC free article] [PubMed] [Google Scholar]
- Taylor H.G., Minich N.M., Klein N., Hack M. Longitudinal outcomes of very low birth weight: neuropsychological findings. J Int Neuropsychol Soc. 2004;10(2):149–163. doi: 10.1017/S1355617704102038. 15012835 [DOI] [PubMed] [Google Scholar]
- Volpe J.J. Brain injury in premature infants: a complex amalgam of destructive and developmental disturbances. Lancet Neurol. 2009;8(1):110–124. doi: 10.1016/S1474-4422(08)70294-1. 19081519 [DOI] [PMC free article] [PubMed] [Google Scholar]
- Wechsler D. Wechsler Abbreviated Scale of Intelligence. Pearson; San Antonio: 1999. [Google Scholar]
- Wechsler D. Wechsler Preschool and Primary Scale of Intelligence — Third Edition. Norwegian version, 2008 edition. Pearson; San Antonio: 2002. [Google Scholar]
- Wechsler D. Wechsler Intelligence Scale for Children. fourth edition. Pearson; London: 2003. (Norweigan version, 2009 Ed.) [Google Scholar]
- Wierenga L.M., Langen M., Oranje B., Durston S. Unique developmental trajectories of cortical thickness and surface area. Neuroimage. 2014;87:120–126. doi: 10.1016/j.neuroimage.2013.11.010. 24246495 [DOI] [PubMed] [Google Scholar]
- Zhang J., Zhang J., Zhou Y., Wu Y.J., Ma L., Wang R.J., Huang S.Q., Gao R.R., Liu L.H., Shao Z.H., Shi H.J., Cheng L.M., Yu L. Novel cerebellum-enriched miR-592 may play a role in neural progenitor cell differentiation and neuronal maturation through regulating Lrrc4c and Nfasc in rat. Curr. Mol. Med. 2013;13(9):1432–1445. doi: 10.2174/15665240113139990072. 23971736 [DOI] [PubMed] [Google Scholar]
Associated Data
This section collects any data citations, data availability statements, or supplementary materials included in this article.
Supplementary Materials
Supplementary material.