

Abstract
We proposed a diffeomorphometry‐based statistical pipeline to study the regional shape change rates of the bilateral hippocampus, amygdala, and ventricle in mild cognitive impairment (MCI) and Alzheimer's disease (AD) compared with healthy controls (HC), using sequential magnetic resonance imaging (MRI) scans of 713 subjects (3,123 scans in total). The subgroup shape atrophy rates of the bilateral hippocampus and amygdala, as well as the expansion rates of the bilateral ventricles, for a majority of vertices were found to follow the order of . The bilateral hippocampus and the left amygdala were subsegmented into multiple functionally meaningful subregions with the help of high‐field MRI scans. The largest group differences in localized shape atrophy rates on the hippocampus were found to occur in CA1, followed by subiculum, CA2, and finally CA3/dentate gyrus, which is consistent with the neurofibrillary tangle accumulation trajectory. Highly nonuniform group differences were detected on the amygdala; vertices on the core amygdala (basolateral and lateral nucleus) revealed much larger atrophy rates, whereas those on the noncore amygdala (mainly centromedial) displayed similar or even smaller atrophy rates in AD relative to HC. The temporal horns of the ventricles were observed to have the largest localized ventricular expansion rate differences; with the AD group showing larger localized expansion rates on the anterior horn and the body part of the ventricles as well. Significant correlations were observed between the localized shape change rates of each of these six structures and the cognitive deterioration rates as quantified by the Alzheimer's Disease Assessment Scale‐Cognitive Behavior Section increase rate and the Mini Mental State Examination decrease rate. Hum Brain Mapp 36:2093–2117, 2015. © 2015 Wiley Periodicals, Inc.
Keywords: Alzheimer's disease, mild cognitive impairment, medial temporal lobe, diffeomorphometry, regional shape change rates, longitudinal analysis
INTRODUCTION
Magnetic resonance imaging (MRI) has been widely used in morphometric studies of the human brain in normal aging and dementia of the Alzheimer type. Of particular interest are the medial temporal lobe (MTL) structures, such as the hippocampus, the amygdala, and the entorhinal cortex, because of their central role in memory function [Cahill et al., 1995; McDonald and White, 1993; Squire, 1992]. The MTL structures have been identified as the earliest and the most severely affected in the neuropathology of the Alzheimer dementia [Hyman et al., 1984]. To directly examine the effects of either aging or the dementia on a certain brain structure, longitudinal studies are usually used to unveil the temporal dynamics of the underlying biological processes [Jack et al., 2012]. In longitudinal studies, serial measurements of the structures of interest are obtained, from which the structural change (atrophy or expansion) rates can be measured. The longitudinal rates of change quantify the effects of the biological process on the structure.
Various longitudinal pipelines have been proposed for measuring changes of the brain in terms of the whole brain or regional structures of interest. For the whole brain, a typical approach is to measure the differences between follow‐up and baseline brain images after being coregistered to a common coordinate system. Representative approaches include but are not limited to a normalized subtraction of the images followed by a calculation of the area differences [Lemieux et al., 1998], an estimation of the relative brain surface motions [Freeborough and Fox, 1997; Smith et al., 2001, 2002], or voxel‐based morphometry (VBM). In VBM, relative changes are quantified based on accurate registration maps between intrasubject scans [Chételat et al., 2005; Davatzikos et al., 2001]. For regional structures of interest such as the hippocampus, the usual approach is to first segment the structures (either manually or automatically) from MR images and then rely on regression models to compute the structural changes over time.
Thus far, investigation of the MTL structural change rates has been primarily limited to volumetric measurements. It has been reported by various longitudinal studies that subjects with Alzheimer dementia, including mild cognitive impairment (MCI) and Alzheimer's disease (AD), have higher hippocampal and amygdalar volumetric atrophy rates [Barnes et al., 2009; Jack et al., 2004, 1998; Miller et al., 2013; van de Pol et al., 2007; Wolz et al., 2010], as well as higher ventricular volumetric expansion rates [Carlson et al., 2008; Frisoni et al., 2010; Nestor et al., 2008], compared with the normal aging population. The main limitation of examining the volumetric change rates is that it does not aid in clarifying whether these increases in structural change rates are homogeneous along the entire structure or restricted to some subregions. Indeed, studies have shown that the group differences between the dementia population and the normal aging population, in terms of regional hippocampal atrophy rates and ventricular expansion rates, are heterogeneous [Chou et al., 2009; Franko et al., 2013; Morra et al., 2009b; Thompson et al., 2004]. Given that the anatomical changes mainly occur at the boundary of a structure, the regional volume change can be effectively analyzed by examining the two‐dimensional (2D) surface contouring the 3D volume segmentation of the structure. The localized shape change rate of a structure is measured at each vertex of its surface, charting a spatiotemporal dynamic trajectory of the shape changes. Such spatiotemporal maps of the regional shape change rates can characterize the spreading patterns of the disease process over time.
With the advent of advanced surface mapping techniques have come surface‐based morphometric analyses that focus on studying the deformations connecting different anatomical surface coordinates rather than the surfaces themselves. Herein, our efforts have largely relied on the large deformation diffeomorphic metric mapping (LDDMM) technique [Miller et al., 2002, 2006], in which a diffeomorphism (a smooth and bijective infinite‐dimensional transformation with a smooth inverse) connecting two coordinate systems is obtained as the endpoint of a geodesic. In this framework, the space of anatomies is turned into a metrizable space, with a metric induced by the length of the geodesic obtained from LDDMM. We term the morphometric analysis performed in this metric space “diffeomorphometry” [Miller et al., 2014]. Diffeomorphometry has been successfully applied to the study of subcortical and ventricular structures in various neurodegenerative diseases [Csernansky et al., 1998, 2000, 2002, 2005; Miller et al., 2013; Qiu et al., 2007, 2008, 2013; Tang et al., 2014; Wang et al., 2007, 2006, 2003; Younes et al., 2014b]. Most existing diffeomorphometry‐based analyses focus on cross‐sectional group comparisons in terms of the regional volume or shape computed from a single scan (usually the baseline scan), rather than the longitudinal rates of change computed from multiple sequential scans.
In this article, we propose a diffeomorphometry‐based statistical analysis pipeline to study the regional shape change rates of the bilateral amygdala, hippocampus, and lateral ventricle in MCI and AD populations, compared to an age‐matched healthy control (HC) population, based on a sequential MRI dataset. The amygdala and the hippocampus are two important MTL structures that have been implicated to be affected by the neuropathology of the Alzheimer dementia. Concentration of senile plaques and neurofibrillary tangles, as well as cell loss, has been observed in the amygdala [Brady and Mufson, 1990; Brun and Englund, 1981; Wenk, 2003] and the hippocampus [Ball et al., 1985; Price and Morris, 1999; Price et al., 1991, 2001] in patients with AD. The lateral ventricle, especially the temporal horn, is also a structure of interest in the study of AD given its spatial adjacency to the MTL structures. The primary goal of this article is to quantitatively assess whether the regional shape change (atrophy or expansion) rates of these three structures (both left and right) differ as a function of disease severity during the progression toward AD. As we will demonstrate, a diffeomorphometric analysis of the regional change rates of a brain structure can characterize the spatial profile of the disease spreading pattern within that structure, as well as the temporal evolution dynamics of that structure.
Both the hippocampus and the amygdala consist of multiple distinct subregions that are highly differentiated functionally. It has been suggested that atrophy occurs first on selected subregions [Tang et al., 2014; Thompson et al., 2004; Wang et al., 2003], such as the CA1 and the subiculum of the hippocampus. It thus becomes of great importance to study the dynamics of shape change rates of the amygdala and the hippocampus restricted to different subregions. In this article, we characterize the diffeomorphometry of localized shape change rates of vertices belonging to each of the four subregions of the bilateral hippocampus—CA1, CA2, CA3 together with the dentate gyrus (CA3/DG), and the subiculum, as well as each of the four subregions of the left amygdala—basolateral, basomedial, centromedial, and lateral nucleus, by integration of high‐field imaging techniques. Individual 0.8mm isotropic 7 Tesla T1‐weighted images are used to separately delineate the bilateral hippocampus and the left amygdala, giving definitions of each structure's four subregions. These subregion definitions are then transferred, via LDDMM, to the template surfaces used in this study.
Currently, a diagnosis of AD relies mainly on documenting cognitive decline. An assessment of the dementia severity and the progression velocity toward AD is usually based on psychometric tests and quantified by severity rating scales, which are considered as the de facto gold standard. Two of the most typically used cognitive measures are the Alzheimer's Disease Assessment Scale‐Cognitive Behavior Section (ADAS‐cog) [Mohs et al., 1983; Rosen et al., 1984] and the Mini Mental State Examination (MMSE) [Folstein et al., 1975]. ADAS‐cog measures a number of cognitive domains, including components of memory, language, and praxis. This scale is scored from 0 to 70 with higher values indicating greater cognitive impairment. MMSE is the most widely used global measure in cognitive evaluation; it provides a continuous scale to assess primary cognitive functions that affect the dementia of the Alzheimer type, including orientation, registration, attention, recall, language, and constructional praxis [Folstein et al., 1975]. The MMSE score ranges from 0 to 30 and, in contrast to ADAS‐cog, lower MMSE scores indicate more severe cognitive impairment.
One of the most important goals for neuroimaging studies is to provide surrogate biomarkers for the early detection and diagnosis of AD with high sensitivity and precision. Imaging‐based biomarkers would not be useful in clinical applications if they could not be significantly linked with cognitive declines [Black, 1999]. The volume change rates of various brain regions have been suggested to be associated with the rates of cognitive decline occurring in the neuropathology of AD [Fox et al., 1999; Jack et al., 2000, 2004]. However, there have been relatively few studies focusing on the statistical linkage between the localized shape change rates of brain structures of interest and the rates of cognitive decline [Thompson et al., 2004]. In this article, we hypothesize that there is a significant association between the localized shape change rates of the three structures of interest (the hippocampus, the amygdala, and the ventricle) and the rates of change in the two aforementioned cognitive measures (ADAS‐cog and MMSE). We aim to characterize quantitative correlation maps between the localized shape change rate, indexed at each vertex of the structural template surfaces, and the rates of cognitive decline.
Data for our investigation comes from subjects in the Alzheimer's Disease Neuroimaging Initiative (ADNI) study, including a total of 203 HC subjects, 343 MCI subjects, and 167 AD subjects, each with sequential MRI dataset obtained over 6‐ or 12‐month intervals within a follow‐up of 6–36 months, resulting in a total of 3,123 scans included in the analysis. The results that will be covered in this article are: (1) annualized volume change rates of the bilateral amygdala, hippocampus, and ventricle for each of the three groups (HC, MCI, and AD); (2) vertex‐based localized shape change rate differences, between HC and AD, HC and MCI, as well as MCI and AD, in those three structures in both hemispheres with the average annualized shape change rates in the HC group being the benchmark; (3) statistically significant differences between every two of the three groups in terms of the shape change rate at each vertex of the CA1, CA2, CA3/DG, and subiculum of the bilateral hippocampus; (4) localized shape change rate difference at each vertex of the basolateral, basomedial, centromedial, and lateral nucleus of the left amygdala between every two of the three groups. The results are spatial indices quantifying how MCI and AD affect the three structures over time. Regarding the linkage to cognitive deterioration, we will present results from two aspects: (1) correlation results (correlation coefficients and the associated p‐values), for the whole sample (all three groups together), between the annualized rates of change in the volume of each of the six structures and the annualized rates of change in ADAS‐cog and MMSE; (2) significant correlation maps between the localized shape change rate, indexed at each vertex of the template surface for each structure of interest, and the rates of changes in ADAS‐cog and MMSE. These correlations will be quantified by the Pearson product–moment correlation coefficient (PCC).
METHOD
Alzheimer's Disease Neuroimaging Initiative
Data used in preparation of this article were obtained from the ADNI database (http://adni.loni.usc.edu). The ADNI was launched in 2003 by the National Institute on Aging, the National Institute of Biomedical Imaging and Bioengineering, the Food and Drug Administration, private pharmaceutical companies and nonprofit organizations, as a $60 million, 5‐year public‐and‐private partnership. The primary goal of ADNI has been to test whether serial MRI, positron emission tomography, other biological markers, and clinical and neuropsychological assessment can be combined to measure the progression of MCI and early AD. Determination of sensitive and specific markers of very early AD progression is intended to aid researchers and clinicians to develop new treatments and monitor their effectiveness, as well as lessen the time and cost of clinical trials.
The Principal Investigator of this initiative is Michael W. Weiner, MD, VA Medical Center and University of California—San Francisco. ADNI is the result of efforts of many co‐investigators from a broad range of academic institutions and private corporations, and subjects have been recruited from over 50 sites across the United States and Canada. The initial goal of ADNI was to recruit 800 adults, ages 55–90, to participate in the research, approximately 200 cognitively normal older individuals to be followed for 3 years, 400 people with MCI to be followed for 3 years and 200 people with early AD to be followed for 2 years. For up‐to‐date information, see http://www.adni-info.org.
Participants
In this study, we included data from subjects with at least one follow‐up scan, resulting in a total of 203 HC subjects, 343 MCI subjects, and 167 subjects with AD. Subjects were followed for up to 36 months, with a 6‐ or 12‐month interval between sequential scans. The total number of available scans varies from subject to subject and a summary of the sequential scans in the three groups (HC, MCI, and AD) is listed in Table 1. The clinical and demographic data of the baseline scans for the three groups, the subjects of which are included in this study, are presented in Table 2. In brief, subjects are 55–92 years old, and are not depressed. The control subjects have MMSE scores of 25–30 and a clinical dementia rating (CDR) of 0. The subjects with MCI have MMSE scores of 23–30, a CDR of 0.5, preserved ability to perform daily living activities, and an absence of dementia. The subjects with AD have MMSE scores of 20–28, a CDR of 0.5 or 1.0 and meet the criteria for probable AD. The three groups did not differ significantly in terms of age (F = 2.53, P = 0.081). All groups differed on MMSE and clinical dementia rating scale sum of boxes (CDR‐SOB) as expected based on diagnostic criteria (all p < 0.001).
Table 1.
The total number of scans, for each of the three groups (HC, MCI, and AD), at each longitudinal time point
| Scan1 (baseline) | Scan2 | Scan3 | Scan4 | Scan5 | Scan6 | |
|---|---|---|---|---|---|---|
| HC | 210 | 203 | 194 | 0 | 161 | 88 |
| MCI | 369 | 343 | 325 | 284 | 242 | 100 |
| AD | 175 | 167 | 148 | 4 | 105 | 1 |
The interval between each time point and the one before it is 6 months except for Scan6. The time interval between Scan5 and Scan6 is 12 months.
Table 2.
Demographic information for the baseline dataset included in this study
| HC (n = 203) | MCI (n = 343) | AD (n = 167) | |
|---|---|---|---|
| Age (yr) | 76.13 ± 5.01 | 75.03 ± 7.27 | 75.2 ± 7.54 |
| NO. male | 108 | 221 | 90 |
| MMSE score | 29.11 ± 1.01 | 27.03 ± 1.75 | 23.48 ± 2.01 |
| CDR‐SOB score | 0.027 ± 0.113 | 1.58 ± 0.884 | 4.204 ± 1.639 |
Image Preprocessing and Volumetric Segmentation
The original MRI scans, in DICOM format, were downloaded from the public ADNI website (http://adni.loni.usc.edu/data-samples/mri/). Locally, the raw MR data were automatically corrected for spatial distortion due to gradient nonlinearity [Jovicich et al., 2006] and B1 field inhomogeneity [Sled et al., 1998]. For each subject, the two T1‐weighted baseline images were rigid‐body aligned to each other, averaged to improve the signal‐to‐noise ratio, and then resampled to be isotropic with 1‐mm voxel resolution. Based on the transformation of the full brain mask into atlas space, the total cranial vault value was estimated from the atlas scaling factor [Buckner et al., 2004], so as to control the individual differences in the head size. Volumetric segmentations of the bilateral amygdala, hippocampus, and ventricle were automatically obtained from FreeSurfer [Fischl et al., 2002]. Qualitative review of the automated segmentations from FreeSurfer was performed, with blinding to the diagnostic status, by three technicians who had been trained and supervised by an expert neuroanatomist with more than 10 years of experience. The technicians had a minimum of 4 months of experience reviewing brain MR images prior to their involvement in this project. Images that suffered degradation due to motion artifacts, technical problems (change in scanner model or change in RF coil during the time‐series), or significant clinical abnormalities (e.g., hemispheric infarction) were excluded.
Surface Generation
Our approach to converting each baseline volume segmentation, obtained from FreeSurfer, to a triangulated surface is identical to the one published in our recent study [Tang et al., 2014]. Briefly, for each 3D subvolume of a structure, its bounding 2D surface was approximated with the resulting surface obtained from applying an optimal diffeomorphism to the CFA template surface [Qiu et al., 2010]. The CFA template surfaces of the six structures were created from manual delineations, ensuring smooth boundary, and correct anatomical topology. For each subject, the diffeomorphism connecting the template space and the subject space was obtained from a six‐channel LDDMM‐image mapping [Ceritoglu et al., 2009] with the segmentation volume of each structure being a single channel in the mapping procedure. More details and validation of this surface‐generation methodology can be found in Tang et al. [2014].
We now briefly describe our approach to creating the structure surfaces for each follow‐up scan. For each subject, the dual 3D follow‐up structural scans (T1‐weighted images) at each time point were rigid‐body aligned to each other, averaged, and then aligned to the averaged T1‐weighted image of the subject's baseline scan via an affine transformation. Following on from that, a deformation field between the T1‐weighted image of the baseline scan and that of each follow‐up scan, for each individual subject, was calculated using a nonlinear registration algorithm that was designed for effectively mapping multiple sequential T1‐weighted images of a single subject [Holland and Dale, 2011]. A merit function is calculated in this longitudinal registration algorithm, which expresses the intensity difference between the T1‐weighted images at each voxel, and depends on the displacement field for the voxel centers of the T1‐weighted image being transformed; it is also regularized to keep the displacement field spatially smooth. The merit function by design will have a minimum when the displacement field induces a good match between the images. It is minimized efficiently using standard numerical methods. This algorithm has been demonstrated to yield very precise registration involving large or subtle deformations, even at small spatial scales with low boundary contrast. This deformation field can be used to align scans at the sub‐voxel level.
For each subject, given the baseline surfaces for all structures of interest and the whole‐brain deformation field connecting the baseline scan with each follow‐up scan, the follow‐up surfaces were obtained by applying the deformation field to the baseline surfaces. The significant improvements achieved by this approach relative to that of other representative methods (such as a direct extraction using the software FreeSurfer) in creating the structural segmentations/surfaces were demonstrated in Holland et al. [2011]. This is the primary reason why we adopted this longitudinal T1‐weighted image registration approach for obtaining the time series surfaces rather than directly segmenting the structures of interest from the follow‐up MR images.
Measuring Localized Shape Change Rates
Figure 1 is a schematic of the diffeomorphometric analysis pipeline for characterizing the group differences in localized shape change rates for each structure of interest. There are two levels of registration involved in this pipeline. For each subject, its baseline surface was first mapped to a common “population‐averaged” template surface via LDDMM‐surface mapping [Vaillant and Glaunès, 2005]. The LDDMM‐surface mapping was performed separately for each structure of interest. The template surface was created from a subset of the baseline surfaces as demonstrated in Tang et al. [2014]. Briefly, all surfaces in that subset were first rigidly aligned to a common spatial position. Following that, an “averaged” template surface was computed using the estimation algorithm described in Ma et al. [2010]. Constructing an “averaged” template surface that lies in the center of the population allows for more accurate mappings between the template space and each subject space compared with using an arbitrary template. From each template‐to‐baseline LDDMM‐surface mapping, a scalar field is calculated as the determinant of the Jacobian of the diffeomorphism from LDDMM, where indicates the vertex on the template surface, represents the specific subject, and the subscript “1” is used to indicate that this measurement is computed from the baseline surface. This scalar field is indexed at each vertex of the common template surface, measuring the localized surface area expansion or contraction of the subject, relative to the template, at each vertex: that is, a value larger than 1 corresponds to localized surface area expansion of the subject relative to the template while a value smaller than 1 suggests localized surface area contraction in the subject. We shall call this scalar field the deformation marker.
Figure 1.
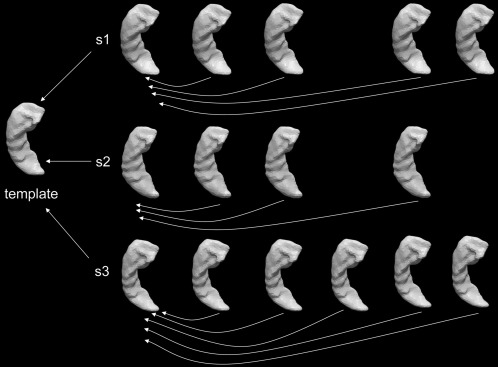
Schematic of the mapping pipeline for the diffeomorphometric study of the regional shape change rates. For each subject, each of the follow‐up scans is first mapped to the baseline scan to create intrasubject localized shape change rate maps. The baseline of each subject is then mapped to a common “population‐averaged” template surface for the purpose of performing statistical group comparisons at identical spatial locations. All mappings are performed via LDDMM‐surface mapping. [Color figure can be viewed in the online issue, which is available at http://wileyonlinelibrary.com.]
In the pipeline's second level of registration, for each subject, all follow‐up surfaces were individually mapped to their baseline surfaces via an LDDMM‐surface mapping. In this way, subject‐specific deformation markers can be computed for each follow‐up scan, measuring the surface changes over time. To ensure that the localized shape change rates can be computed at the corresponding surface locations for each subject and then compared to each other statistically in 3D, all subject‐specific deformation markers were transferred to the common template space via nearest neighbor assignment. The template surface vertices are not necessarily in one‐to‐one correspondence with the subject baseline surface vertices even if the numbers of vertices in those two surfaces are the same. The cost function in LDDMM‐surface matching, that is, current matching [Vaillant and Glaunès, 2005], is designed specifically not to identify point‐to‐point correspondence, only to bring surfaces close to each other. Each template‐to‐baseline LDDMM‐surface mapping established a vertex‐by‐vertex correspondence between the template surface and the deformed template surface. For each vertex of the template surface, a value from the original subject‐specific time series deformation marker was assigned by taking that of the vertex of the baseline surface that is spatially closest to the corresponding deformed template surface vertex. Thus yielding the time‐series deformation markers as defined in the template coordinates; these determine the amount of expansion or contraction in the follow‐up surface for the th scan of subject , relative to the common template surface, at vertex . Changes in these deformation markers over time can, therefore, be used to measure the subject‐specific localized shape change rates indexed by a common coordinate system, which allows for statistical intergroup comparisons at equivalent surface vertices. It is worth noting that the aforementioned procedure for measuring the localized shape change rates was performed separately for each single structure.
Diffeomorphometry of Regional Shape Change Rates
For each structure, to statistically compare the localized shape change rate between groups at each vertex of the template surface, we used the following statistical model
| (1) |
where
| (2) |
The notation is defined as follows:
is the deformation marker for the th scan of subject at vertex on the template surface.
denotes the age of subject at their th scan with years as the unit.
is a binary group variable. In comparing HC with a disease group (MCI or AD), if subject belongs to the HC group and otherwise. Similarly, in the comparison of MCI and AD, if subject belongs to the MCI group and if that subject belongs to the AD group.
denotes the covariate information of subject included in the analysis; baseline age, sex, and the estimated intracranial volume.
represents the random noise. A linear mixed‐effects model is used to model the noise structure as a sum of two different processes, . The first one is a “random effect” that measures the intersubject variation while the second one measures the intrasubject variation within a series. The two processes are assumed to both be Gaussian and .
The parameters and were obtained from maximum‐likelihood estimation, for details see Miller et al. [2013]. To check for a group difference, at vertex , we tested the null hypothesis against the general hypothesis . The complete null hypothesis is for all . The test statistic is computed at each vertex, as , where is the log‐likelihood under the null hypothesis and is the log‐likelihood under the general hypothesis.
To correct for multiple comparisons, we control the familywise error rate (FWER) at a level of , with the maximum statistic defined as . The statistical significance of group differences is quantified by p‐values obtained from Fisher's method of randomization. To be specific, p‐values are computed based on permutation tests by randomizing the model residuals. More details on the implementation of our permutation testing can be found in Younes et al. [2014a].
We used Monte Carlo simulations to generate 40,000 uniformly distributed random permutations which gave rise to a collection of statistics, one from each permutation. The p‐value is then given by the fraction of permutations in the collection that have values larger than the value obtained from the true groupings. The set of vertices on which the null hypothesis is not valid is estimated to be where is the 95th percentile of the statistic collection [Nichols and Hayasaka, 2003] and is the observed statistic at vertex (with the true labels). The localized group difference in terms of the annualized shape change rates (atrophy or expansion rates) at vertex is quantified as .
Dividing the Template Surface into Subregions
The amygdala and the hippocampus both consist of multiple subregions, each with their own distinct functions [Ball et al., 2007; Kesner et al., 2004; Lee and Kesner, 2002]. With this in mind, we aim to divide the amygdalar and the hippocampal template surfaces into functionally meaningful subregions, allowing one to localize and analyze the shape change rate differences that are specific to those subregions. As described in our previous study [Tang et al., 2014], this division was achieved using pre‐delineated surfaces of high‐field segmentations and a transfer of the boundary definitions of those subregions to our “population‐averaged” template surfaces. Specifically, we projected the subregions defined on high‐resolution MR images to our template surfaces via the LDDMM‐surface mapping algorithm. The reliability of the subregion definitions in our template surfaces was established via visual examinations by two neuroanatomists.
Given the limited availability of manually segmented high‐field scans, we will only be considering the bilateral hippocampus and the left amygdala in this study. Two high‐resolution (of isotropic 0.8mm voxel resolution) T1‐weighted images were acquired using high‐field 7 Tesla image acquisition technology. One subject (sub#1) was used for manually segmenting the bilateral hippocampus into subregions while the other (sub#2) was used for the left amygdala subsegmentation. Sub#1 is a 30‐year‐old male, and sub#2 is a 42‐year‐old male. Both are considered healthy by self‐report. The two subjects were scanned using a standard MPRAGE protocol in a Philips Achieva 7.0T scanner (repetition time (TR) = 4.3 ms, echo time (TE) = 1.95 ms, flip = 7, field of view (FOV) = 220 × 220 × 180). The hippocampus (both left and right) was manually divided into four distinct subregions: CA1, CA2, CA3/dentate gyrus, and subiculum. Those four subregion definitions on the high‐field bilateral hippocampus and their corresponding projections onto the template surfaces of this study are illustrated in Figure 2. In addition, the high‐field left amygdala was subsegmented into four distinct subregions: basolateral, basomedial, centromedial, and lateral nucleus. Figure 3 shows the four subregion definitions on the high‐field left amygdala as well as their projections onto the template surface of our study.
Figure 2.
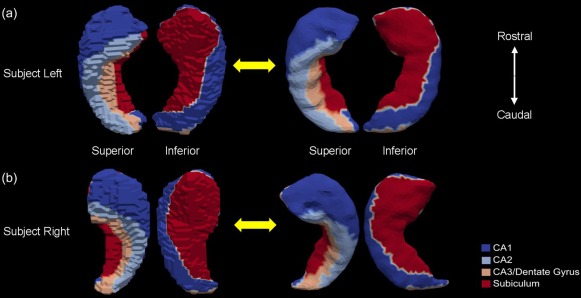
Figure shows the four subregions (CA1, CA2, CA3/Dentate Gyrus, and Subiculum) of the left hippocampus [panel (a)] and the right hippocampus [panel (b)] on the high‐field 7 Tesla segmentations (left in each panel) and their projections to the “population‐averaged” template surfaces (right in each panel). In each case, two views are presented. [Color figure can be viewed in the online issue, which is available at http://wileyonlinelibrary.com.]
Figure 3.
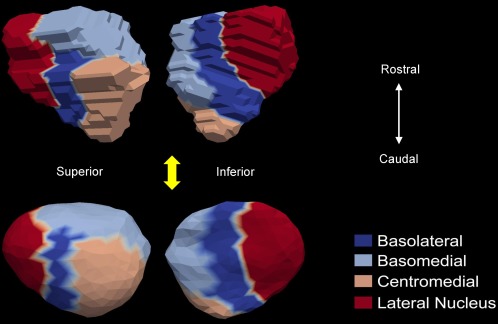
Demonstration of the four subregion (basolateral, basomedial, centromedial, and lateral nucleus) correspondences between the high‐field 7 Tesla left amygdala (top panel) and the “population‐averaged” template surface (bottom panel). For each segmentation, two views are shown. [Color figure can be viewed in the online issue, which is available at http://wileyonlinelibrary.com.]
Correlating Shape Change Rates with Cognitive Decline Rates
For each subject, the annualized rates of change in the ADAS‐cog score and the MMSE score were calculated separately using linear regression. The mean and standard deviations of the annualized rates of increase in the ADAS‐cog score and decrease in the MMSE score for each of the three groups (HC, MCI, and AD) are tabulated in Table 3.
Table 3.
Mean and standard deviations of the annualized rates of changes in ADAS‐cog and MMSE for the three groups (HC, MCI, and AD)
| ADAS‐cog | MMSE | |
|---|---|---|
| HC | 0.0011 ± 0.3767 | −0.0049 ± 0.0397 |
| MCI | 0.1372 ± 0.3331 | −0.0357 ± 0.0883 |
| AD | 0.2877 ± 0.4027 | −0.1089 ± 0.1855 |
To quantify the linkage between the annualized rates of cognitive decline, as measured by the ADAS‐cog and MMSE change rates, and the annualized shape change rate at each vertex of the structures' template surfaces, we calculated the Pearson product‐moment correlation coefficients (PCCs). Statistical significance of the correlation at each vertex is measured by a p‐value obtained from nonparametric permutation tests, similar to the strategy adopted in the Diffeomophometry of Regional Shape Change Rates section. For each structure, since multiple correlation tests were performed simultaneously at all vertices of the template surface, we need to correct for multiple comparison. To do that, we adjusted the p‐values in a way that controls the FWER at a level of 0.05 based on the “maximum statistic” method described in Groppe et al. [2011] and Nichols and Hayasaka [2003].
RESULTS
Overall Volume Change Rate
The overall magnitude of the volume change rate for each of the six structures (left and right amygdala, hippocampus, and ventricle), when used to order the three groups, consistently yields . To be specific, for the left hippocampus, the annualized volume change rate was: −1.88 ± 1.34% per year for the AD subjects, −1.36 ± 0.92% per year for the MCI population, and −0.42 ± 0.68% per year for the HC subjects. Note that, negative values indicate atrophy over time while positive values suggest expansion over time. For the right hippocampus, the annualized volume change rate was: −1.36 ± 1.21% per year for the AD subjects, −0.96 ± 0.85% per year for the MCI population, and −0.2 ± 0.84% per year for the HC subjects. For the left amygdala, the volume change rates for the three populations (AD, MCI, and HC) were, respectively, −2.34 ± 1.62% per year, −1.32 ± 1.1% per year, and −0.81 ± 0.73% per year. For the right amygdala, the three corresponding statistics were −1.65 ± 1.82% per year, −1.16 ± 1.07% per year, and −0.37 ± 1.10% per year. The annualized volume change rates of the left ventricle for the three groups were, respectively, 7.57 ± 2.57% per year, 4.8 ± 2.3% per year, and 2.89 ± 1.27% per year. For the right ventricle, the rate statistics were: 7.55 ± 2.67% per year for AD, 4.73 ± 2.13% per year for MCI, and 2.81 ± 1.27% per year for HC. For these annualized volume change rates, statistical significance was reached for all of the group differences when compared via a Student's t‐test (p < 0.03), except for the right amygdalar atrophy rate between MCI and AD (p = 0.19).
Regional Shape Change Rate
Three‐structure analysis
In Figures 4, 5, 6, we present the shape change rate results at each vertex of the bilateral hippocampus, amygdala, and ventricle, respectively. In Figures 4 and 5, the top panel presents the results for the corresponding structure in the left hemisphere while the bottom panel presents the results for right hemisphere. In Figure 6, the results for the ventricle on both sides are presented together. In each of the three figures, panel (a) represents the group‐averaged annualized shape change rate of the HC subjects at each vertex of the structure template surface, which is illustrated as a benchmark. Significant group differences between HC and AD (panel b, in each figure), HC and MCI (panel c, in each figure), as well as MCI and AD (panel d, in each figure) are also demonstrated in Figures 4, 5, 6, in each panel of which vertices are highlighted on the structure template surface at which a significantly smaller or larger shape change rate was detected in the latter group relative to the former one at the significance level of p = 0.05 after multiple comparison correction. For the amygdala and the hippocampus in both hemispheres, positive values suggest larger atrophy rates while negative values suggest smaller atrophy rates in the latter group when compared to the former one. For the bilateral ventricles, a negative value indicates a greater expansion rate and a positive value indicates a smaller expansion rate in the latter group relative to the former one. For each group comparison, we calculated the percentage of the area on the template surface showing statistically significantly smaller, equivalent, or larger shape change rates in the latter group when compared with the former one, the results of which are listed in Table 4 for the three structures of interest in both hemispheres. The percentages were calculated based on the vertex‐based surface areas; we attributed to each vertex of the template surface the average area of the surface faces (triangles) that contain it and then calculated the percentage of the surface area with smaller, equivalent, or larger shape change rates as the ratio between the total area of the vertices showing smaller, equivalent, or larger shape change rates and the total area of all vertices on the template surface.
Figure 4.
Top and bottom panels show the shape analysis results for the left hippocampus and the right hippocampus respectively. In each panel, subpanel (a) shows the average annualized shape atrophy rate of the HC group at each vertex of template surface for the corresponding structure. Subpanels (b)–(d) illustrate the regional shape atrophy rate differences between HC and AD [subpanel (b)], HC and MCI [subpanel (c)], as well as MCI and AD [subpanel (d)], that are statistically significant after multiple comparison correction at a level of 0.05. In each subplot, results from two views are presented. [Color figure can be viewed in the online issue, which is available at http://wileyonlinelibrary.com.]
Figure 5.
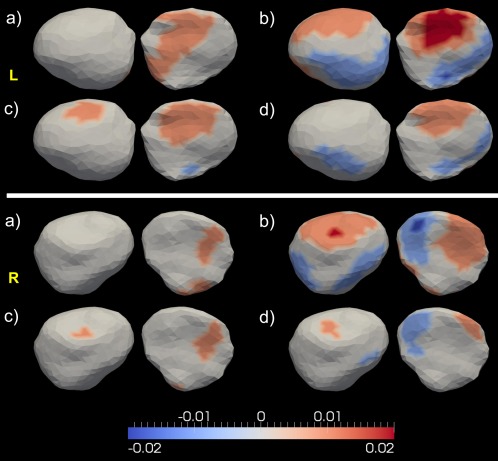
Top and bottom panels show the shape analysis results for the left and right amygdala respectively. In each panel, subpanel (a) represents the average annualized shape atrophy rate in HC at each vertex of the amygdala. Subpanels (b)–(d) illustrate that structure's regional shape atrophy rate differences between every two of the three groups [HC vs. AD—subpanel (b), HC vs. MCI—subpanel (c), MCI vs. AD—subpanel (d)], that are statistically significant after multiple comparison correction at a level of 0.05. In each subplot, results from two views are presented. [Color figure can be viewed in the online issue, which is available at http://wileyonlinelibrary.com.]
Figure 6.
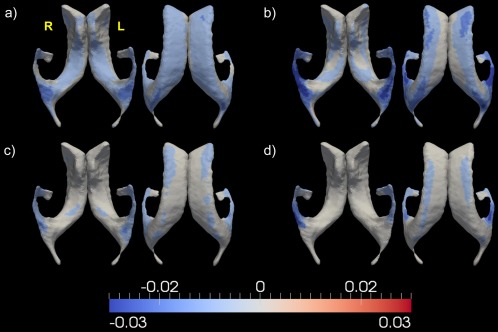
Demonstration of the shape analysis results for the bilateral ventricles. Panel (a) shows the vertex‐based mean values of the annualized shape expansion rates of the bilateral ventricles in the HC group. Panels (b)–(d), respectively, illustrate the annualized regional shape expansion rate differences of that structure between HC and AD, HC and MCI, as well as MCI and AD, that are statistically significant after multiple comparison correction at a level of 0.05. In each panel, results from two views are presented. [Color figure can be viewed in the online issue, which is available at http://wileyonlinelibrary.com.]
Table 4.
Percentage of the surface area of each structure showing smaller regional change rates (1st column in each comparison block), equivalent regional change rates (2nd column in each comparison block), as well as larger regional change rates (3rd column in each comparison block) in the latter group when compared with the former group
| HC vs. AD | HC vs. MCI | MCI vs. AD | |||||||
|---|---|---|---|---|---|---|---|---|---|
| Smaller rate (%) | Equal rate (%) | Larger rate (%) | Smaller rate (%) | Equal rate (%) | Larger rate (%) | Smaller rate (%) | Equal rate (%) | Larger rate (%) | |
| lhi | 3.40 | 48.59 | 48.01 | 0.52 | 65.47 | 34.01 | 0.00 | 83.68 | 16.32 |
| rhi | 8.25 | 48.19 | 43.55 | 1.37 | 75.08 | 23.55 | 0.66 | 78.29 | 21.06 |
| lam | 22.90 | 38.46 | 38.65 | 3.87 | 71.02 | 25.11 | 8.88 | 80.55 | 10.57 |
| ram | 18.17 | 48.17 | 33.66 | 0.96 | 88.84 | 10.19 | 5.76 | 89.99 | 4.24 |
| lvl | 0.57 | 42.36 | 57.07 | 0.00 | 77.28 | 22.72 | 0.00 | 88.70 | 11.30 |
| rvl | 0.66 | 41.52 | 57.82 | 0.00 | 77.60 | 22.40 | 0.12 | 87.14 | 12.73 |
Keys: lhi—left hippocampus; rhi—right hippocampus; lam—left amygdala; ram—right amygdala; lvl—left ventricle; rvl—right ventricle.
According to the statistics listed in Table 4, compared with HC, the AD subjects have significantly larger atrophy rates on a large amount of surface areas of the bilateral hippocampus (48.01% for the left and 43.55% for the right). A small amount of area on the hippocampal surfaces has been detected to undergo atrophy more slowly in AD relative to HC (3.4% for the left and 8.25% for the right). A similar trend can be found in the HC‐versus‐MCI comparison, with the percentage of surface area on the left hippocampus displaying larger atrophy rates in MCI being 34.01% while 0.52% displaying relatively smaller atrophy rates compared to those in HC. The corresponding statistics for the right hippocampus were found to be 23.55% (larger atrophy rates in MCI relative to HC) and 1.37% (smaller atrophy rates in MCI relative to HC). Quantitative maps of the regional atrophy rate differences between every two of the three groups (Fig. 4) reveal that the largest annualized atrophy rate difference that is statistically significant is 3%/year between HC and AD, 1.5%/year between HC and MCI, and 2%/year between MCI and AD for the bilateral hippocampus. According to the volume atrophy results, the annualized volume atrophy rate differences of the bilateral hippocampus are 1.46%/year (left) and 1.16%/year (right) between HC and AD, 0.94%/year (left) and 0.76%/year (right) between HC and MCI, 0.52%/year (left) and 0.4%/year (right) between MCI and AD. This suggests that the regional shape atrophy rate of the hippocampus is a more sensitive measure than the overall volume loss rate while also being capable of characterizing the disease spreading pattern within the hippocampus.
For the amygdala atrophy process, even though the overall volume atrophy rate is larger in the AD group when compared with the HC group, shape analysis reveals heterogeneous results. Compared with that of a normal aging subject, 38.65% of the surface area on the left amygdala of AD subjects undergo atrophy at a higher rate while 22.9% exhibit a smaller rate (Table 4). A similar pattern was found in the right amygdala—larger atrophy rates for 33.66% and smaller atrophy rates for 18.17% of the surface area in AD relative to HC. Comparing HC and MCI, the latter has a greater surface area showing larger atrophy rates (25.11% vs. 3.87% for the left amygdala, and 10.19% vs. 0.96% for the right amygdala). The percentage of surface area with larger atrophy rates is similar in value to that with smaller rates when considering AD relative to MCI (10.57% vs. 8.88% for the left amygdala, and 4.24% vs. 5.76% for the right amygdala). Maps of the atrophy rate differences of the amygdala, as shown in Figure 5, suggest that larger atrophy rates in MCI and AD, relative to the normal aging group, are prevalent. According to Figure 5, it is plausible that the reason why no significant volume atrophy rate difference was observed between MCI and AD for the right amygdala is because there are similar portions of vertices on that structure showing smaller and larger atrophy rates between MCI and AD. The largest value of significant annualized regional atrophy rate difference for the bilateral amygdala is 2%/year between HC and AD, 1.5%/year between HC and MCI, and 1.5%/year between MCI and AD. This generally agrees with the volume atrophy rate results, in which we found significant group differences of 1.53%/year (left) and 1.28%/year (right) between HC and AD, 0.51%/year (left) and 0.79%/year (right) between HC and MCI, and 1.02%/year for the left amygdala between MCI and AD.
The most striking structural change rate contrasts were found in the ventricles, in terms of both volume expansion rates and regional shape expansion rates. The group differences in the overall ventricular volume expansion rates were found to be 4.68%/year (left) and 4.74%/year (right) between HC and AD, 1.92%/year (left) and 1.91%/year (right) between HC and MCI, and 2.78%/year (left) and 2.82%/year (right) between MCI and AD. According to our results on the localized shape expansion of the bilateral ventricles, as shown in Table 4 and Figure 6, the expansion rates of a large amount of regions on the ventricular template surfaces order the three groups as , which is in agreement with the volume expansion rate findings. The largest group difference in terms of the annualized shape expansion rates for the bilateral ventricle is 5% between HC and AD, 2% between HC and MCI, and 3% between MCI and AD. The shape expansion rate difference maps, as illustrated in Figure 6, indicate that significant group differences in terms of the ventricular expansion rates mainly occur at the temporal horns of the lateral ventricles.
Subregion analysis
Figures 7, 8, 9 provide maps of the pairwise group differences in the localized atrophy rates, on the whole structure surface and the restriction to each of its four subregions, of the left hippocampus, the right hippocampus, and the left amygdala, respectively.
Figure 7.
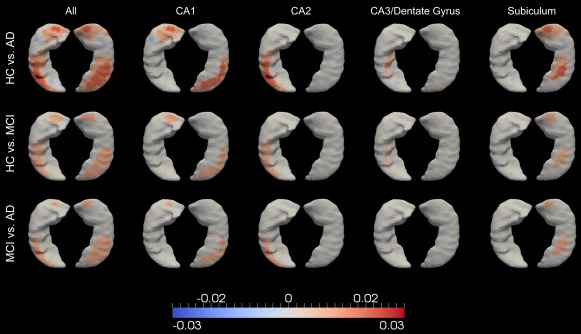
Spatial maps of the atrophy rate differences of the left hippocampus, between every group pair (out of HC, MCI, and AD), for the entire surface (leftmost column) and the restrictions to the CA1 zone (2nd column from left), the CA2 zone (middle column), the CA3/dentate gyrus zone (4th column from left), and the subiculum zone (5th column from left). Colors with positive values indicate greater atrophy in the latter group relative to the former group. [Color figure can be viewed in the online issue, which is available at http://wileyonlinelibrary.com.]
Figure 8.
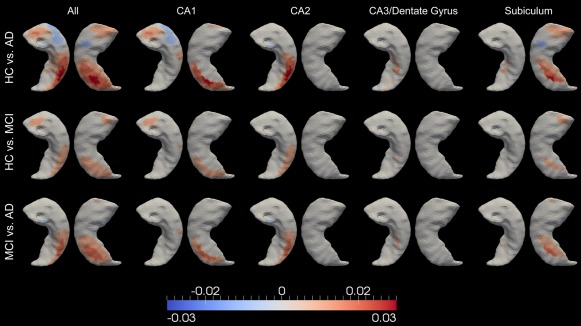
Spatial maps of the atrophy rate differences of the right hippocampus, between every group pair (out of HC, MCI, and AD), for the entire surface (leftmost column) and the restrictions to the CA1 zone (2nd column from left), the CA2 zone (middle column), the CA3/dentate gyrus zone (4th column from left), and the subiculum zone (5th column from left). Colors with positive values indicate greater atrophy in the latter group relative to the former group. [Color figure can be viewed in the online issue, which is available at http://wileyonlinelibrary.com.]
Figure 9.
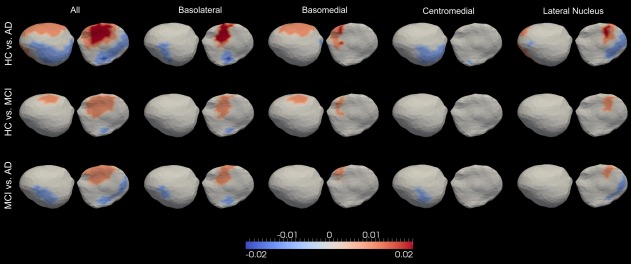
Significant differences between every group pair (out of HC, MCI, and AD), in terms of the atrophy rates of the entire left amygdala (leftmost column), the left basolateral amygdala (2nd column from left), the left basomedial amygdala (3rd column from left), the left centromedial amygdala (4th column from left), and the left lateral nucleus of the amygdala (5th column from left). Colors with positive values indicate greater atrophy in the latter group relative to the former group. [Color figure can be viewed in the online issue, which is available at http://wileyonlinelibrary.com.]
The atrophy rate difference maps restricted to each subregion of the left and right hippocampus, which, respectively, comprise Figures 7 and 8, indicate that the largest hippocampal atrophy rate difference, in each group comparison, occurs at CA1, followed by the subiculum and CA2, whereas the smallest difference occurs at the compartment containing CA3 and the dentate gyrus. In each hippocampal subregion, a similar spatial pattern of the atrophy rate difference was observed for each group comparison. It is clear that within each subregion, the atrophy rates obey the order . Within each single group, Figures 7 and 8 reveal that the atrophy rates are in the order of .
From the left amygdala subregion analysis, similar spatial shape atrophy patterns were observed for all group comparisons within each compartment, as illustrated in Figure 9. Vertices showing the largest atrophy rate differences were found to belong to the basolateral compartment in the HC versus AD comparison. In each group comparison, the magnitudes of those differences follow the order of basolateral > lateral nucleus ≥ basomedial > centramedial. Within each subregion of the left amygdala, the atrophy rates of a majority of vertices follow the order .
Linkage to Cognitive Decline Rates
Volume change rate correlation
For the whole sample (all three groups together), correlations between the annualized volume change rates of the six structures and the annualized change rate in cognitive performance were evaluated for ADAS‐cog and MMSE. The PCC values and the p‐values measuring the significance of the correlations are given in Table 5. The volume change rates of all structures were significantly correlated with that of the ADAS‐cog score (p < 0.05). To be specific, the volume change rates of the bilateral hippocampus and amygdala were all negatively correlated with the ADAS‐cog change rate. Given that higher ADAS‐cog scores indicate greater cognitive impairment and that the annualized ADAS‐cog increase rate follows the order (as shown in Table 3), it clearly suggests that larger volume atrophy rates (more extreme negative values) for both amygdala and hippocampus are indicative of greater impairment in cognitive functions. For the bilateral ventricles, the volume change rates were found to be positively correlated with the change rate of ADAS‐cog, indicating that greater cognitive impairment is proportional to larger ventricular volume expansion rates.
Table 5.
Correlation between the annualized volume change rate in each of the six structures of interest and the annualized rates of change in cognitive test performance among all subjects
| ADAS‐cog | MMSE | |
|---|---|---|
| Left hippocampus | −0.21 (8.31 E−09)* | 0.29 (2.22 E−16)* |
| Right hippocampus | −0.08 (0.03)* | 0.22 (7.21 E−10)* |
| Left amygdala | −0.11 (4.41 E−03)* | 0.14 (1.45 E−04)* |
| Right amygdala | −0.07 (0.04)* | 0.02 (0.54) |
| Left ventricle | 0.33 (<0.00)* | −0.39 (<0.00)* |
| Right ventricle | 0.33 (<0.00)* | −0.37 (<0.00)* |
Values represent the Pearson product–moment correlation coefficient, with the associated p‐value in parentheses. The symbol * indicates that p < 0.05.
For the linkage between the volume change rates and the cognitive decline rate as evaluated by the MMSE decrease rate, statistically significant correlations (p < 0.05) were observed for all structures except the right amygdala (p = 0.54). In contrast to the ADAS‐cog results, positive correlations were found between the MMSE change rate and the volume change rates of the hippocampus and the amygdala in both hemispheres while negative correlations were observed for the bilateral ventricles. This finding agrees with the established theorem that MMSE is in negative correlation with ADAS‐cog, with smaller MMSE values being indicative of more severe cognitive deteriorations, and thus larger ADAS‐cog values.
Comparing all six structures, the volume change rates of the bilateral ventricles were found to have the strongest correlation with both the ADAS‐cog increase rate and the MMSE decrease rate, followed by the hippocampus in both hemispheres, and lastly the amygdala. The correlation results of the two cognitive measures are highly consistent with each other for each structure except for the right hippocampus where the correlation with MMSE is much stronger than that with ADAS‐cog in terms of both the PCC value and the P‐value.
Shape change rate correlation
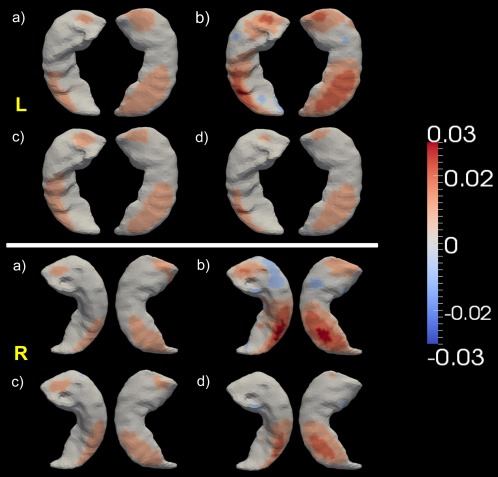
Maps of the correlations between the annualized rates of change in ADAS‐cog and MMSE and the annualized shape change rate at each vertex of the “population‐averaged” template surfaces of the bilateral hippocampus, the bilateral amygdala, and the bilateral ventricles, are, respectively, shown in Figures 10, 11, and 12. In each figure, PCCs are demonstrated only for vertices where the shape change rates correlated statistically significantly with the rates of change in the two cognitive measures after performing multiple comparison correction by controlling the FWER at a level of 0.05.
Figure 10.
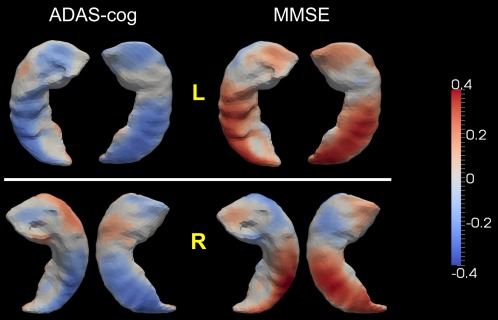
Statistically significant correlation between the localized shape change rates of the hippocampus (top: left, bottom: right) and the rates of change in ADAS‐cog and MMSE. Colors represent the Pearson product–moment correlation coefficients. [Color figure can be viewed in the online issue, which is available at http://wileyonlinelibrary.com.]
Figure 11.
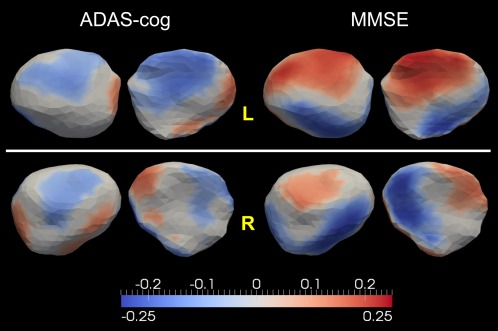
Top and bottom panels show the statistically significant correlation maps between the localized shape change rates and the rates of changes in ADAS‐cog and MMSE for the left and right amygdalae, respectively. Colors represent the Pearson product–moment correlation coefficients. [Color figure can be viewed in the online issue, which is available at http://wileyonlinelibrary.com.]
Figure 12.
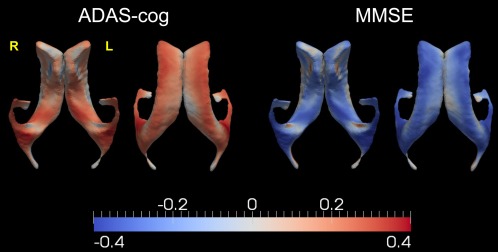
Demonstration of the statistically significant correlation maps between the localized ventricular shape expansion rates and the rates of changes in ADAS‐cog and MMSE. Results from two views are presented for each clinical measure. [Color figure can be viewed in the online issue, which is available at http://wileyonlinelibrary.com.]
For a majority of vertices on both the left and the right hippocampus, significant correlations were observed between the localized shape atrophy rates and the rates of change in ADAS‐cog and MMSE. Agreeing with the volume atrophy rate correlation results, the shape atrophy rates of the bilateral hippocampus, especially the left hippocampus, were mostly negatively correlated with the ADAS‐cog increase rate and positively correlated with the MMSE decrease rate, with an inhomogeneity across vertices in terms of the correlation strength. This observation implies that a large localized shape atrophy rate of the hippocampus (both left and right) is indicative of the cognitive deterioration that occurs in the progression toward AD. We also note that a few vertices, most notably on the right hippocampus, possess the reverse correlation results (positively correlated with ADAS‐cog and negatively correlated with MMSE), which agrees with the group comparison results presented in Figure 4. The spatial maps of the ADAS‐cog and MMSE correlations are highly consistent with each other, revealing reverse correlation trends at the same spatial locations on the template surfaces. This again strengthens the validity of our findings.
For the left amygdala, negative correlations with the ADAS‐cog increase rate as well as positive correlations with the MMSE decrease rate are prevalent across the entire surface although heterogeneity exists in that some vertices have the reverse correlation direction (negatively correlated with the ADAS‐cog change rate and positively correlated with the MMSE change rate). In linking the localized shape change rates of the right amygdala to the cognitive decline rates, we noticed that there are similar portions of vertices revealing correlation results with the reverse directions. This may well explain our finding that there is no significant correlation between the right amygdala volume atrophy rate and the MMSE decrease rate. Comparing the amygdala correlation results with ADAS‐cog and those with MMSE, we found that the localized shape change rates of both the left and the right amygdala are more sensitive to the rate of change in MMSE than that in ADAS‐cog. More vertices are found to be significantly correlated with the rate of change in MMSE than those with that of ADAS‐cog. In addition, the correlation strength with MMSE is in general stronger than that with ADAS‐cog.
According to the results illustrated in Figure 12, the localized shape expansion rates of most vertices on the bilateral ventricles were significantly correlated with the rates of change in ADAS‐cog and MMSE. To be specific, the localized shape expansion rates of the ventricle in both hemispheres were in general positively correlated with the rate of increase in ADAS‐cog and negatively correlated with the rate of decrease in MMSE, which is consistent with the correlation findings on the ventricular volume expansion rates. Vertices displaying the strongest linkage with the cognitive decline rates were found to belong to the temporal horns of the lateral ventricles, a region that has been implicated to be strongly affected by the pathology of AD [Jack et al., 1997, 1998, 2004; Thompson et al., 2004]. This observation is in line with the group comparison results in terms of the localized shape expansion rates of the bilateral ventricle (Fig. 6), wherein the largest group differences occurred on the temporal horns. The correlation maps shown in Figure 12 imply that the expansion rates of the ventricles, especially of the temporal horns, are potentially powerful predictors of the cognitive declines in progressing to AD.
DISCUSSION
In this study, we developed a surface‐based statistical diffeomorphometry method for studying the localized temporal dynamics of three structures, the amygdala, the hippocampus, and the ventricle, in normal aging, MCI, and AD. Specifically, we compared the localized shape change rates of those three structures between every two of the three groups (HC, MCI, and AD) using sequential MRI scans. A total of 713 subjects, each of which has at least one 6‐ or 12‐month follow‐up scan, were included in our analysis, including 203 HC subjects, 343 MCI subjects, and 167 subjects with AD. All MRI scans were obtained from the ADNI database. In addition to statistical comparisons in terms of the localized shape change rates across different groups, we evaluated the linkage between the structural change rates (both volume and shape) and the rates of change in cognitive performance as evaluated by ADAS‐cog and MMSE.
Our interest primarily lies in the evolution of the 2D surface enclosing the 3D subvolume of each structure. For each subject in this study, the annualized regional shape change rate of each structure was computed at each vertex of the common “population‐averaged” template surface, which enables statistical group comparisons at the corresponding spatial locations. A linear mixed‐effects statistical model was constructed to examine the regional differences between every two of the three groups. The mixed effects arise in representing the noise structure of the statistical model as a mixture of two Gaussian processes, one associated to the intersubject cross‐sectional variation and the other associated to the intrasubject longitudinal variation. A similar model has also been used in Bernal‐Rusiel et al. [2012]. We explored more subtle group differences by examining our hippocampus and amygdala data at the level of histological subparts. The bilateral hippocampal template surfaces were divided into four subregions (CA1, CA2, a combined CA3 and dentate gyrus region, and the subiculum) via separate projections, for each structure in each hemisphere, of the subregion definitions from manually delineated 7 Tesla high‐field segmentations. Similarly, the left amygdalar template surface was subsegmented into four compartments: basolateral, basomedial, centromedial, and lateral nucleus.
According to our analysis, the atrophy of the amygdala and the hippocampus, as well as the ventricular expansion, progresses at different local rates and with different spatial patterns depending on the subject's grouping. As shown in Figures 4, 5, 6, compared with HC, both MCI and AD subjects have higher, but nonuniform, shape change rates at most regions of the three structure surfaces. At any specific time point, comparing the rates of shape change generally orders the populations as with the localized rate difference varying from vertex to vertex on the template surface.
Based on the correlation results between the structural change rates, in terms of both the entire volume and the localized shape, and the rates of change in cognitive decline, we found that the rates of structural changes of all six structures are statistically significantly linked with the cognitive deterioration rate (the rate of ADAS‐cog increase and of MMSE decrease). The results suggest that the atrophy rates of the amygdala and the hippocampus in both hemispheres, as well as the expansion rates of the bilateral ventricles, are promising measures for monitoring disease progression in the AD pathology. Quantitative maps (Figs. 10, 11, 12), characterizing the strength and direction of the correlation between each vertex‐based shape change rate and the cognitive decline rates, show some heterogeneity, especially in the bilateral amygdala, which may contribute to the reason why there have been rare findings established when evaluating the volume atrophy of the entire amygdala in MCI and AD.
In the following subsections, we will discuss our findings for each of the three structures in more detail.
Hippocampus analysis
The hippocampus is a structure of interest in the analysis of MCI and AD. Indeed, there has been evidence showing that the neuropathological changes that occur in Alzheimer dementia cause neuronal loss in the hippocampus [Price et al., 2001], with a resultant volume reduction over time [Bobinski et al., 1996]. Extensive studies have been dedicated to the hippocampal atrophy rates of normal aging and Alzheimer populations including MCI and AD [Franko et al., 2013; Holland et al., 2012; Jack et al., 2004, 1998; Macdonald et al., 2013; Miller et al., 2013; Morra et al., 2009b; Schuff et al., 2009; Thompson et al., 2004; Wolz et al., 2010; Younes et al., 2014a]. The general conclusions have been that the hippocampal atrophy rates decreased in the order of , in spite of reports in which the absolute atrophy rates for the same group vary from study to study. The absolute atrophy rates largely depend on the method employed in obtaining the hippocampal volume segmentations. Preprocessing of the MR images and volumetric segmentations of the hippocampus, on the dataset used in this study, are the same as the one published in Holland et al. [2012]. Our hippocampal volume atrophy rate results for all three groups are in the same range as those reported in that study [Holland et al., 2012]; any slight disagreement may be due to a difference in subjects included in the analysis. To be specific, for the left and right hippocampus, the group‐averaged annualized volume atrophy rates computed from our dataset were observed to be −1.88 and −1.36% for AD, −1.36 and −0.96% for MCI, and −0.42 and −0.2% for HC. Shape analysis results revealed that the largest localized atrophy rates in the hippocampus of both sides were −2%/year in the HC group while the largest significant increases were −1.5%/year in the MCI group and −3%/year in the AD group (Fig. 4) relative to HC.
Figure 4 suggests that the patterns of hippocampal atrophy for HC is similar to those for MCI and AD except for magnitude. Conjecturally, an explanation is that the normal aging process causes brain atrophy in a way that is similar to that of the Alzheimer dementia. There have been studies, in both animal models and humans, demonstrating that there are significant cognitive and neurobiological changes with aging in the absence of disease [see Samson and Barnes, 2013 for a review]. A related observation is that the AD pathophysiological processes are evident in a subset of older adults who are cognitively normal [Sperling et al., 2011]. What is more, other studies have reported that the normal aging process will lead to a pattern of regional brain volume loss that is similar to that occurring in patients with MCI and AD, also with a distinction in terms of the magnitude of volume loss and the rate of volume loss [Driscoll et al., 2009]. Our shape diffeomorphometry results could be the logical extension of these findings.
According to our group comparison analysis, we found that the annualized hippocampal (both left and right) volume atrophy rates follow the order with statistical significance (p ≤ 0.03). This conclusion is in line with the majority of existing published results on hippocampal atrophy rates though there have been studies showing that the statistical significance of some group differences was not reached. For example, Franko et al. [2013] showed that the atrophy rates of the left hippocampus in all three groups are not statistically different from each other. This disagreement may be related to differences in sample size between studies. Indeed, a limited number of subjects could be a potential issue in earlier studies. For example, a total of 277 subjects (85 HC, 102 MCI, and 90 AD) were included in Franko et al. [2013], 490 subjects (148 HC, 245 MCI, and 97 AD) were studied in Morra et al. [2009b], and a total of 31 subjects (14 HC and 17 AD) were used in Thompson et al. [2004]. The sample size of our study is relatively large—a total of 713 subjects (203 HC, 343 MCI, and 167 AD) were included, which may have strengthened the statistical power of this study in detecting group differences in the hippocampal atrophy rates.
Recently, statistical shape analysis of the hippocampus has become popular due to its ability to characterize regional abnormalities in MCI and AD. Most shape analysis studies focus on cross‐sectional comparisons between the HC group and a disease group (MCI or AD) or between two disease groups (MCI and AD) based on a single MRI scan per subject (usually the baseline scan) [Apostolova et al., 2006; Csernansky et al., 2002; Morra et al., 2009a; Pluta et al., 2012; Qiu et al., 2009; Tang et al., 2014; Wang et al., 2006]. This kind of case–control analyses reflects the group differences in terms of regional shape areas or volumes rather than the regional shape change rates along time. To characterize the spatial patterns of the temporal atrophy dynamics of the hippocampus, longitudinal studies are usually required, in which multiple sequential MRI scans are obtained for the same subject [Apostolova et al., 2010; Franko et al., 2013; Morra et al., 2009b; Thompson et al., 2004; Wang et al., 2003].
As revealed by our statistical shape analysis results on the longitudinal surface data (Fig. 4), most hippocampal vertices have localized shape atrophy rates that order the groups as while heterogeneity exists across the entire surface in terms of the group differences in the atrophy rates. This trend is in line with our previous cross‐sectional analysis results [Tang et al., 2014], wherein we found that for age‐matched HC, MCI, and AD, the regional hippocampal volume measurements obey the order of . With the help of the subregion segmentations of a high‐field 7 Tesla hippocampus, we were able to morphometrically analyze the atrophy rates restricted to each subregion. For each group comparison (HC vs. AD, HC vs. MCI, and MCI vs. AD), we found that the atrophy rate differences across different subregions admit the order (Figs. 7 and 8). We also found that the largest group differences in regional volumes occurred at CA1 in Tang et al. [2014].
Our subregion group comparison results for the bilateral hippocampus ( ) are consistent with the neurofibrillary tangle accumulation trajectory as suggested in Schonheit et al. [2004]. The tangles are suggested to be first observed in the entorhinal cortex, and then CA1 and subicular areas. They then spread to CA2, CA3, and finally CA4 of the hippocampal formation. The neurofibrillary tangle accumulation is regarded as the main reason why the hippocampus is affected in Alzheimer dementia. This spatial spreading pattern in the hippocampus ( ) has been suggested in Bobinski et al. [1997, 1995] as well. CA1 has also been reported, in other MRI studies on Alzheimer dementia [Csernansky et al., 2005; Wang et al., 2003], to be the subregion with the largest group differences in terms of atrophy over time. In our study, we observed similar patterns for the left and right hippocampus as opposed to the observation in Csernansky et al. [2005] that the group difference was restricted to the left hippocampus only. Our finding is consistent with the general conclusion that the neuropathology of AD is symmetric at all stages of the disease [Price and Morris, 1999].
We observed significant correlations between the volume atrophy rates of the hippocampus in both hemispheres and the rates of change in cognitive performance (negatively correlated with the ADAS‐cog increase rate and positively correlated with the MMSE decrease rate; Table 5) rather than the observation that there is no significant correlation between the hippocampus loss rate and the cognitive decline rate published in Jack et al. [2004] and Thompson et al. [2004]. This variation may be related to differences in sample sizes between the three studies (713 subjects in this study, 31 subjects in Thompson et al. [2004], and 160 subjects in Jack et al. [2004]) as well as a difference in the number of sequential MRI scans (2–6 MRI scans were obtained for subjects in this study while only two scans for the other two studies). Given that the rates of change in those two cognitive measures both follow the order (Table 3) and that the hippocampal atrophy rates are significantly positively correlated to those rates of change in cognition, we conclude that higher hippocampal atrophy rates suggest more severe cognitive impairment and thus an increase in the atrophy rates of the bilateral hippocampus provides predictive information about degeneration from normal aging toward AD. Spatial maps of the association between the localized shape atrophy rates and the cognitive decline rates (Fig. 10) indicate that the shape atrophy rates of most hippocampal vertices are statistically significantly correlated with the cognitive decline rates, and the associations are in the expected direction: the localized rates of shape atrophy are in negative correlation with the ADAS‐cog increase rate and positive correlation with the MMSE decrease rate, although the correlation strength varies from vertex to vertex.
The correlation results between the localized hippocampal shape atrophy rates and the rates of cognitive declines (Fig. 10) confirm and strengthen the validity of our diffeomorphometry‐based group comparison results for the localized shape atrophy rates (Fig. 4) in that the shape atrophy rates of almost all vertices are in significant positive correlation with the deteriorating velocity of cognitive functions and thus we should theoretically have atrophy rates following the order of , which matches what we have observed in Figure 4. In addition, comparing Figures 4 and 10, we observe that the spatial maps from those two types of analyses are well matched in two respects: (1) vertices with significantly stronger correlation between the shape atrophy rates and the ADAS‐cog/MMSE change rates are found to have larger statistically significantly group differences in the shape atrophy rates; (2) vertices showing positive correlations between the shape atrophy rates and the cognitive decline rates are found to follow the order of in terms of atrophy rate magnitudes, whereas vertices showing negative correlations (e.g., blue‐colored vertices in the MMSE panel of the right hippocampus in Fig. 10) were found to have atrophy rates in the order of . Compared to the volume change rates, the localized shape atrophy rates in the hippocampus provide more detailed cognitive correlation information, and potentially more powerful biomarkers for measuring and predicting the cognitive declines in AD.
Amygdala analysis
The amygdala has been implicated to play a central role in enhancing the explicit memory related to emotional stimuli, by modulating the consolidation of memory [Hamann, 2001]. This is particularly true of the basolateral amygdala [Vazdarjanova and McGaugh, 1999]. Even though there are strong neural connections between the amygdala and the hippocampus [Phelps, 2004], the amygdala has been the focus of very few studies while the hippocampus formation and its role in the AD pathology has been widely studied and well established. Recently, the research community has started to investigate the amygdala's involvement in MCI and AD, based on cross‐sectional studies of both the volume measurement [Basso et al., 2006; Horinek et al., 2007; Jack et al., 1997; Poulin et al., 2011] and the shape measurement [Cavedo et al., 2011; Miller et al., 2012, 2013; Qiu et al., 2009; Tang et al., 2014]. These cross‐sectional analyses have suggested reduced amygdala volume in MCI and AD compared with the normal aging controls. Longitudinal statistical analyses of the amygdala in MCI or AD populations have so far been very rare. To the best of our knowledge, the recently published [Miller et al., 2013] was the only study prior to this one focusing on comparing the volume atrophy rates of the amygdala in preclinical AD and normal aging subjects. Significantly higher annualized atrophy rates were observed in preclinical AD compared with the normal aging subjects in [Miller et al., 2013].
In this study, we observed a sequential increase in the amygdala atrophy rates in HC, MCI, and AD. To be specific, the annualized volume atrophy rates for the left and right amygdala were found to be −0.81% and −0.37% in HC, −1.32% and −1.16% in MCI, and −2.34% and −1.65% in AD. From the shape analysis results, as demonstrated in Figure 5, the largest localized shape atrophy rate in HC is −1%/year for the amygdala in both hemispheres with the maximum value of the statistically significant increase being −1.5%/year in MCI and −2%/year in AD, relative to that in HC, for both sides. We note that the group differences in the amygdala shape atrophy rates are highly inhomogeneous (Fig. 5), especially those between HC and AD. For both the left and the right amygdala, some vertices were found to atrophy faster in AD than in HC, while some were found to atrophy faster in HC than in AD. A similar, but weaker, inhomogeneous pattern was observed in the comparison of MCI and AD while the difference between HC and MCI is relatively slight. The subregion analysis of the left amygdala (Fig. 9) revealed that, in each group comparison, the atrophy rate differences are in the following order . In our previous study [Tang et al., 2014], we also observed this ordering of the regional amygdala volume reduction magnitudes in MCI and AD, compared to HC.
It has been suggested that the amygdala can be parcellated into core (consisting of the lateral, basal, and accessory basal nuclei) and noncore (remaining nuclei, which include the central, medial, and periamygdaloid nuclei) subregions based on functional characteristics [Munn et al., 2007; Price, 2003; Sheline et al., 1998]. Our subregion analysis results suggest that the core part of the left amygdala (containing the two subregions—basolateral and lateral nucleus) in MCI, and especially in AD, atrophy much faster than that in normal aging while the noncore part of the left amygdala (containing the basomedial and the centromedial) exhibits relatively small differences, displaying slightly larger (mainly restricted to the basomedial), similar, or even smaller (mainly restricted to the centromedial) atrophy rates in MCI and AD compared to the normal aging population. Even within the core amygdala in the left hemisphere, the shape atrophy rates in AD are not uniformly larger than those in HC. There are vertices in the basolateral as well as the lateral nucleus showing smaller atrophy rates in AD compared to HC. The observation that the largest atrophy rate differences between HC and AD occur mainly in the basolateral is consistent with the fact that the basolateral amygdala is responsible for modulating the consolidation of memory [Vazdarjanova and McGaugh, 1999]. There are vertices, mainly belonging to the central medial amygdala, with larger atrophy rates in HC than AD. One plausible reason is that the central medial is the subregion of the amygdala that is furthest from the hippocampus. This separation may be related to why the central medial amygdala is affected by the Alzheimer dementia in a fashion rather different from the hippocampus, which atrophies much faster in AD subjects than HC ones.
The volume atrophy rates of both the left and the right amygdala were found to have significantly negative correlation with the rate of change in ADAS‐cog, with the significance level of the left amygdala being much higher than that of the right (0.0044 vs. 0.046 in terms of p‐values). For the correlation with the MMSE change rate, only the volume loss rate of the left amygdala was found to be significantly positively correlated ( ) compared to the right amygdala's . This clearly suggests that the volume loss rate of the left amygdala performs better than that of the right amygdala in predicting the cognitive declines in progression toward AD. One natural conjecture regarding this observation is that AD significantly affects the patients' ability to use and process language. Therefore, left brain structures have been found to degenerate more than right ones in patients with AD. The observation that the left hemisphere is more severely affected in AD has also been reported in other literature, both metabolically and structurally [Janke et al., 2001; Johnson et al., 1998; Loewenstein et al., 1989; Thompson et al., 2001, 2003]. The left amygdala has been suggested to be closely related to affective information encoding, with a higher affinity to language, and to detailed feature extraction [Markowitsch, 1998]. This may explain why the left amygdala is more predictive of MMSE than the right amygdala.
The linkage between the localized shape atrophy rates and the rates of change in cognitive performance, as shown in Figure 11, was found to be highly inhomogeneous: (1) the atrophy rates of some vertices were found to be significantly correlated with the rates of cognitive declines while those of some other vertices were not; (2) some vertices on the amygdala surfaces were found to have positive correlation with the rate of cognitive deterioration (negative correlation with the rate of change in ADAS‐cog and positive correlation with that in MMSE) while some others were found to have negative correlation; (3) for vertices that were significantly positively correlated with the rates of cognitive decline, the degree of correlation varies from vertex to vertex. These highly heterogeneous observations provide good explanations for the weak or even complete lack of correlation with the volume loss rates as well as the heterogeneity observed in the atrophy rate differences of the bilateral amygdala among groups (Fig. 5). An examination of Figures 5 and 11 reveals that the group differences match the correlation results very well. For example, vertices on the left amygdala exhibiting the strongest group differences between HC and AD (panel b, in the top panel of Fig. 5) also displayed the most powerful correlation with the MMSE change rate (the top right of Fig. 11). These vertices belonged to the basolateral subregion. In addition, vertices with larger atrophy rates in AD compared to that in HC (Fig. 5) correspond to the vertices with positive correlations with the MMSE change rate (Fig. 11), whereas vertices that atrophy slower in AD match the ones with negative correlations with the MMSE change rate. Furthermore, the larger the group difference, the stronger the correlation. Comparing the correlation results of the two cognitive measures with each other (Fig. 11), it is apparent that the localized amygdala shape change rates are more sensitive to the rate of changes in MMSE than that of ADAS‐cog while the volume change rates (especially of the right amygdala) are more sensitive to the change rate in ADAS‐cog (Table 4). This may suggest that the volume change rates and the localized shape change rates of the amygdala provide compatible and complementary prediction information for the cognitive declines associated with AD.
Ventricle analysis
The ventricle is a target of analysis in the study of MCI and AD because of its spatial adjacency to the MTL structures (the hippocampus, the amygdala, and the entorhinal cortex). Neuronal loss in those structures over time results in an expansion of the neighboring ventricles. Of particular interest is the temporal horn of the lateral ventricles. Indeed, there is evidence that the expansion rates of the ventricles (especially the temporal horns) in the AD group are larger than those in the normal aging group [Carlson et al., 2008; Chou et al., 2009; Jack et al., 2004; Nestor et al., 2008; Schott et al., 2005; Thompson et al., 2004].
In this longitudinal study, the ventricles were found to be the structure that changes the fastest among all three structures of interest, with the annualized volume expansion rates for the left and right being 7.57% and 7.55% for the AD group, 4.8% and 4.73% for the MCI group, and 2.89% and 2.81% for the HC group. The shape analysis results, as shown in Figure 6, indicate that the largest localized expansion rate in both the left and the right ventricle is 3%/year in the normal aging subjects with the maximum value of the statistically significant increase being 2%/year in MCI and 5%/year in AD, relative to that in HC, for both sides. We found that the expansion rates of a majority of vertices on the ventricular template surfaces are in the order of with the degree of group differences varying from vertex to vertex (Fig. 6). Careful inspection of the spatial maps of the ventricular expansion rate differences indicates that the main group differences occur on the temporal horns in both hemispheres. This observation agrees with most existing ventricular findings on MCI and AD [Chou et al., 2009; Schott et al., 2005; Thompson et al., 2004]. In addition to the expansion rate increases in MCI and AD in the temporal horns, we also found that the expansion rates of the vertices on the anterior horns (Fig. 6) vary from group to group (again, ). A subset of vertices on the body of the lateral ventricles (both left and right) showed larger expansion rates in AD compared to the normal aging group. A small portion of vertices on the body of the left lateral ventricle revealed group expansion rate differences between HC and MCI, as well as MCI and AD.
The expansion rates of the bilateral ventricle volumes were found to be the most tightly linked with the rates of change in ADAS‐cog and MMSE (all p‐values < 0.00), and linked in the expected direction: the expansion rates of the bilateral ventricles were positively correlated with the rate of ADAS‐cog changes and negatively correlated with the rate of MMSE changes. This observation is consistent with existing findings on the correlation between temporal horn change rates and rates of cognitive declines [Jack et al., 2004; Thompson et al., 2004] as well as our observation that the group differences in the ventricular expansion rates are much bigger than those in the amygdalar and hippocampal atrophy rates.
Examining the linkage maps between the localized shape expansion rates and the rates of change in cognitive measures, we observed highly significant positive correlations with the rate of ADAS‐cog increases and negative correlations with the rate of MMSE decreases for almost all vertices on the bilateral ventricles (Fig. 12). This clearly indicates that the bilateral ventricle change rates, in terms of not only the entire volume but also the localized shape, are much more powerful than the amygdalar and hippocampal change rates in predicting the cognitive deteriorations in AD. Vertices close to the temporal horns were found to have the strongest correlation with cognitive declines compared to other vertices on the template surfaces. This finding matches the general consensus and also our observation that the biggest group differences occur on the temporal horns.
CONCLUSION
In conclusion, we have developed a statistical shape analysis method that uses diffeomorphometry to examine the localized shape change rates of the bilateral amygdala, hippocampus, and ventricle in normal aging, MCI, and AD subjects. Facilitated by high‐field 7 Tesla subregion segmentations of the hippocampus in both hemispheres and the left amygdala, we evaluated the atrophy processes restricted to each subregion compartment. This allowed for a detailed characterization of the local temporal progression dynamics of those three structures and the local comparison of these dynamics in the three populations. Significant correlation maps between the localized shape change rates and the rates of change in two cognitive measures (ADAS‐cog and MMSE) further reveal the power of localized shape change rates in monitoring and predicting the impairment severity as well as the progression velocity toward dementia of the Alzheimer type. The proposed method not only helps to identify how the disease progresses over time but also reveals the spatial spreading pattern within each single structure. The results presented in this study, which were obtained from a large sample of subjects, strongly suggest that this regional shape change rate method could be used as a diagnostic and prognostic tool in future clinical trials in Alzheimer dementia. Spatial maps of the temporal change dynamics of the amygdala, the hippocampus, and the ventricle, are very likely to offer alternate and potentially more powerful biomarkers of AD progression.
ACKNOWLEDGMENTS
The authors would like to thank Pamela Belmonte‐Mahon for collecting the two 7T scans. The authors would also like to thank Thi Lan Huong and Timothy Brown for manually segmenting the left amygdala and the hippocampi into subregions. ADNI data are disseminated by the Laboratory for Neuro Imaging at the University of California, Los Angeles. Anders M. Dale is a founder and holds equity in CorTechs Labs, Inc, and also serves on its Scientific Advisory Board. Michael I. Miller owns an equal share in Anatomyworks LLC. The terms of this arrangement have been reviewed and approved by the Johns Hopkins University, as well as the University of California, San Diego in accordance with their conflict of interest policies.
Data used in preparation of this article were obtained from the Alzheimer's Disease Neuroimaging Initiative (ADNI) database (http://adni.loni.usc.edu). As such, the investigators within the ADNI contributed to the design and implementation of ADNI and/or provided data but did not participate in analysis or writing of this report.
REFERENCES
- Apostolova LG, Dinov ID, Dutton RA, Hayashi KM, Toga AW, Cummings JL, Thompson PM (2006): 3D comparison of hippocampal atrophy in amnestic mild cognitive impairment and Alzheimer's disease. Brain 129:2867–2873. [DOI] [PubMed] [Google Scholar]
- Apostolova LG, Mosconi L, Thompson PM, Green AE, Hwang KS, Ramirez A, Mistur R, Tsui WH, de Leon MJ (2010): Subregional hippocampal atrophy predicts Alzheimer's dementia in the cognitively normal. Neurobiol Aging 31:1077–1088. [DOI] [PMC free article] [PubMed] [Google Scholar]
- Ball T, Rahm B, Eickhoff SB, Schulze‐Bonhage A, Speck O, Mutschler I (2007): Response properties of human amygdala subregions: Evidence based on functional MRI combined with probabilistic anatomical maps. PLoS One 2:e307. [DOI] [PMC free article] [PubMed] [Google Scholar]
- Ball MJ, Hachinski V, Fox A, Kirshen AJ, Fisman M, Blume W, Kral VA, Fox H, Merskey H (1985): A new definition of Alzheimer's disease: A hippocampal dementia. Lancet 325:14–16. [DOI] [PubMed] [Google Scholar]
- Barnes J, Bartlett JW, van de Pol LA, Loy CT, Scahill RI, Frost C, Thompson P, Fox NC (2009): A meta‐analysis of hippocampal atrophy rates in Alzheimer's disease. Neurobiol Aging 30:1711–1723. [DOI] [PMC free article] [PubMed] [Google Scholar]
- Basso M, Yang J, Warren L, MacAvoy MG, Varma P, Bronen RA, van Dyck CH (2006): Volumetry of amygdala and hippocampus and memory performance in Alzheimer's disease. Psychiatry Res 146:251–261. [DOI] [PubMed] [Google Scholar]
- Bernal‐Rusiel JL, Greve DN, Reuter M, Fischl B, Sabuncu MR, for the Alzheimer's Disease Neuroimaging Initiative (2012): Statistical analysis of longitudinal neuroimage data with linear mixed effects models. Neuroimage 66C:249–260. [DOI] [PMC free article] [PubMed] [Google Scholar]
- Black SE (1999): The search for diagnostic and progression markers in AD: So near but still too far? Neurology 52:1533–1534. [DOI] [PubMed] [Google Scholar]
- Bobinski M, Wegiel J, Tarnawski M, Bobinski M, Reisberg B, de Leon MJ, Miller DC, Wisniewski HM (1997): Relationships between regional neuronal loss and neurofibrillary changes in the hippocampal formation and duration and severity of Alzheimer disease. J Neuropathol Exp Neurol 56:414–420. [DOI] [PubMed] [Google Scholar]
- Bobinski M, Wegiel J, Wisniewski HM, Tarnawski M, Bobinski M, Reisberg B, De Leon MJ, Miller DC (1996): Neurofibrillary pathology—Correlation with hippocampal formation atrophy in Alzheimer disease. Neurobiol Aging 17:909–919. [DOI] [PubMed] [Google Scholar]
- Bobinski M, Wegiel J, Wisniewski HM, Tarnawski M, Reisberg B, Mlodzik B, de Leon MJ, Miller DC (1995): Atrophy of hippocampal formation subdivisions correlates with stage and duration of Alzheimer disease. Dementia 6:205–210. [DOI] [PubMed] [Google Scholar]
- Brady DR, Mufson EJ (1990): Amygdaloid pathology in Alzheimer's disease: Qualitative and quantitative analysis. Dement Geriatr Cogn Disord 1:5–17. [Google Scholar]
- Brun A, Englund E (1981): Regional pattern of degeneration in Alzheimer's disease: Neuronal loss and histopathological grading. Histopathology 5:549–564. [DOI] [PubMed] [Google Scholar]
- Buckner RL, Head D, Parker J, Fotenos AF, Marcus D, Morris JC, Snyder AZ (2004): A unified approach for morphometric and functional data analysis in young, old, and demented adults using automated atlas‐based head size normalization: Reliability and validation against manual measurement of total intracranial volume. Neuroimage 23:724–38. [DOI] [PubMed] [Google Scholar]
- Cahill L, Babinsky R, Markowitsch HJ, McGaugh JL (1995): The amygdala and emotional memory. Nature 377:295–296. [DOI] [PubMed] [Google Scholar]
- Carlson NE, Moore MM, Dame A, Howieson D, Silbert LC, Quinn JF, Kaye JA (2008): Trajectories of brain loss in aging and the development of cognitive impairment. Neurology 70:828–833. [DOI] [PubMed] [Google Scholar]
- Cavedo E, Boccardi M, Ganzola R, Canu E, Beltramello A, Caltagirone C, Thompson PM, Frisoni GB (2011): Local amygdala structural differences with 3T MRI in patients with Alzheimer disease. Neurology 76:727–733. [DOI] [PMC free article] [PubMed] [Google Scholar]
- Ceritoglu C, Oishi K, Li X, Chou MC, Younes L, Albert M, Lyketsos C, van Zijl PC, Miller MI, Mori S (2009): Multi‐contrast large deformation diffeomorphic metric mapping for diffusion tensor imaging. Neuroimage 47:618–627. [DOI] [PMC free article] [PubMed] [Google Scholar]
- Chételat G, Landeau B, Eustache F, Mézenge F, Viader F, de la Sayette V, Desgranges B, Baron J‐(2005): Using voxel‐based morphometry to map the structural changes associated with rapid conversion in MCI: A longitudinal MRI study. Neuroimage 27:934–946. [DOI] [PubMed] [Google Scholar]
- Chou YY, Lepore N, Avedissian C, Madsen SK, Parikshak N, Hua X, Shaw LM, Trojanowski JQ, Weiner MW, Toga AW, Thompson PM, Alzheimer's Disease Neuroimaging Initiative (2009): Mapping correlations between ventricular expansion and CSF amyloid and tau biomarkers in 240 subjects with Alzheimer's disease, mild cognitive impairment and elderly controls. Neuroimage 46:394–410. [DOI] [PMC free article] [PubMed] [Google Scholar]
- Csernansky JG, Joshi S, Wang L, Haller JW, Gado M, Miller JP, Grenander U, Miller MI (1998): Hippocampal morphometry in schizophrenia by high dimensional brain mapping. Proc Natl Acad Sci USA 95:11406–11411. [DOI] [PMC free article] [PubMed] [Google Scholar]
- Csernansky JG, Wang L, Jones D, Rastogi‐Cruz D, Posener JA, Heydebrand G, Miller JP, Miller MI (2002): Hippocampal deformities in schizophrenia characterized by high dimensional brain mapping. Am J Psychiatry 159:2000–2006. [DOI] [PubMed] [Google Scholar]
- Csernansky JG, Wang L, Joshi S, Miller JP, Gado M, Kido D, McKeel D, Morris JC, Miller MI (2000): Early DAT is distinguished from aging by high‐dimensional mapping of the hippocampus. Dementia of the Alzheimer type. Neurology 55:1636–1643. [DOI] [PubMed] [Google Scholar]
- Csernansky JG, Wang L, Swank J, Miller JP, Gado M, McKeel D, Miller MI, Morris JC (2005): Preclinical detection of Alzheimer's disease: Hippocampal shape and volume predict dementia onset in the elderly. Neuroimage 25:783–792. [DOI] [PubMed] [Google Scholar]
- Davatzikos C, Genc A, Xu D, Resnick SM (2001): Voxel‐based morphometry using the RAVENS maps: Methods and validation using simulated longitudinal atrophy. Neuroimage 14:1361–1369. [DOI] [PubMed] [Google Scholar]
- Driscoll I, Davatzikos C, An Y, Wu X, Shen D, Kraut M, Resnick SM (2009): Longitudinal pattern of regional brain volume change differentiates normal aging from MCI. Neurology 72:1906–1913. [DOI] [PMC free article] [PubMed] [Google Scholar]
- Fischl B, Salat DH, Busa E, Albert M, Dieterich M, Haselgrove C, van der Kouwe A, Killiany R, Kennedy D, Klaveness S, Montillo A, Makris N, Rosen B, Dale AM (2002): Whole brain segmentation: Automated labeling of neuroanatomical structures in the human brain. Neuron 33:341–355. [DOI] [PubMed] [Google Scholar]
- Folstein MF, Folstein SE, McHugh PR (1975): “Mini‐mental state”: A practical method for grading the cognitive state of patients for the clinician. J Psychiatr Res 12:189. [DOI] [PubMed] [Google Scholar]
- Fox NC, Scahill RI, Crum WR, Rossor MN (1999): Correlation between rates of brain atrophy and cognitive decline in AD. Neurology 52:1687–1687. [DOI] [PubMed] [Google Scholar]
- Franko E, Joly O, Alzheimer's Disease Neuroimaging Initiative (2013): Evaluating Alzheimer's disease progression using rate of regional hippocampal atrophy. PLoS One 8:e71354. [DOI] [PMC free article] [PubMed] [Google Scholar]
- Freeborough PA, Fox NC (1997): The boundary shift integral: An accurate and robust measure of cerebral volume changes from registered repeat MRI. IEEE Trans Med Imaging 16:623–629. [DOI] [PubMed] [Google Scholar]
- Frisoni GB, Fox NC, Jack CR, Scheltens P, Thompson PM (2010): The clinical use of structural MRI in Alzheimer disease. Nat Rev Neurol 6:67–77. [DOI] [PMC free article] [PubMed] [Google Scholar]
- Groppe DM, Urbach TP, Kutas M (2011): Mass univariate analysis of event‐related brain potentials/fields I: A critical tutorial review. Psychophysiology 48:1711–1725. [DOI] [PMC free article] [PubMed] [Google Scholar]
- Hamann S (2001): Cognitive and neural mechanisms of emotional memory. Trends Cogn Sci 5:394–400. [DOI] [PubMed] [Google Scholar]
- Holland D, Dale AM, Alzheimer's Disease Neuroimaging Initiative (2011): Nonlinear registration of longitudinal images and measurement of change in regions of interest. Med Image Anal 15:489–497. [DOI] [PMC free article] [PubMed] [Google Scholar]
- Holland D, Desikan RS, Dale AM, McEvoy LK, Alzheimer's Disease Neuroimaging Initiative (2012): Rates of decline in Alzheimer disease decrease with age. PLoS One 7:e42325. [DOI] [PMC free article] [PubMed] [Google Scholar]
- Holland D, Dale AM (2011): Nonlinear registration of longitudinal images and measurement of change in regions of interest. Med Image Anal 15:489–497. [DOI] [PMC free article] [PubMed] [Google Scholar]
- Horinek D, Varjassyova A, Hort J (2007): Magnetic resonance analysis of amygdalar volume in Alzheimer's disease. Curr Opin Psychiatry 20:273–277. [DOI] [PubMed] [Google Scholar]
- Hyman BT, Van Hoesen GW, Damasio AR, Barnes CL (1984): Alzheimer's disease: Cell‐specific pathology isolates the hippocampal formation. Science 225:1168–1170. [DOI] [PubMed] [Google Scholar]
- Jack CR Jr, Petersen RC, Xu Y, O'Brien PC, Smith GE, Ivnik RJ, Boeve BF, Tangalos EG, Kokmen E (2000): Rates of hippocampal atrophy correlate with change in clinical status in aging and AD. Neurology 55:484–489. [DOI] [PMC free article] [PubMed] [Google Scholar]
- Jack CR Jr, Petersen RC, Xu YC, Waring SC, O'Brien PC, Tangalos EG, Smith GE, Ivnik RJ, Kokmen E (1997): Medial temporal atrophy on MRI in normal aging and very mild Alzheimer's disease. Neurology 49:786–794. [DOI] [PMC free article] [PubMed] [Google Scholar]
- Jack CR Jr, Shiung MM, Gunter JL, O'Brien PC, Weigand SD, Knopman DS, Boeve BF, Ivnik RJ, Smith GE, Cha RH, Tangalos EG, Petersen RC (2004): Comparison of different MRI brain atrophy rate measures with clinical disease progression in AD. Neurology 62:591–600. [DOI] [PMC free article] [PubMed] [Google Scholar]
- Jack CR Jr, Vemuri P, Wiste HJ, Weigand SD, Lesnick TG, Lowe V, Kantarci K, Bernstein MA, Senjem ML, Gunter JL, Boeve BF, Trojanowski JQ, Shaw LM, Aisen PS, Weiner MW, Petersen RC, Knopman DS, Alzheimer's Disease Neuroimaging Initiative (2012): Shapes of the trajectories of 5 major biomarkers of Alzheimer disease. Arch Neurol 69:856–867. [DOI] [PMC free article] [PubMed] [Google Scholar]
- Jack CR, Petersen RC, Xu Y, O'Brien PC, Smith GE, Ivnik RJ, Tangalos EG, Kokmen E (1998): Rate of medial temporal lobe atrophy in typical aging and Alzheimer's disease. Neurology 51:993–999. [DOI] [PMC free article] [PubMed] [Google Scholar]
- Janke AL, de Zubicaray G, Rose SE, Griffin M, Chalk JB, Galloway GJ (2001): 4D deformation modeling of cortical disease progression in Alzheimer's dementia. Magn Reson Med 46:661–666. [DOI] [PubMed] [Google Scholar]
- Johnson KA, Jones K, Holman BL, Becker JA, Spiers PA, Satlin A, Albert MS (1998): Preclinical prediction of Alzheimer's disease using SPECT. Neurology 50:1563–1571. [DOI] [PubMed] [Google Scholar]
- Jovicich J, Czanner S, Greve D, Haley E, van der Kouwe A, Gollub R, Kennedy D, Schmitt F, Brown G, Macfall J, Fischl B, Dale A (2006): Reliability in multi‐site structural MRI studies: Effects of gradient non‐linearity correction on phantom and human data. Neuroimage 30:436–443. [DOI] [PubMed] [Google Scholar]
- Kesner RP, Lee I, Gilbert P (2004): A behavioral assessment of hippocampal function based on a subregional analysis. Rev Neurosci 15:333–352. [DOI] [PubMed] [Google Scholar]
- Lee I, Kesner RP (2002): Differential contribution of NMDA receptors in hippocampal subregions to spatial working memory. Nat Neurosci 5:162–168. [DOI] [PubMed] [Google Scholar]
- Lemieux L, Wieshmann UC, Moran NF, Fish DR, Shorvon SD (1998): The detection and significance of subtle changes in mixed‐signal brain lesions by serial MRI scan matching and spatial normalization. Med Image Anal 2:227–242. [DOI] [PubMed] [Google Scholar]
- Loewenstein DA, Barker WW, Chang JY, Apicella A, Yoshii F, Kothari P, Levin B, Duara R (1989): Predominant left hemisphere metabolic dysfunction in dementia. Arch Neurol 46:146–152. [DOI] [PubMed] [Google Scholar]
- Ma J, Miller MI, Younes L (2010): A Bayesian generative model for surface template estimation. Int J Biomed Imaging 2010:974957. [DOI] [PMC free article] [PubMed] [Google Scholar]
- Macdonald KE, Bartlett JW, Leung KK, Ourselin S, Barnes J, ADNI investigators (2013): The value of hippocampal and temporal horn volumes and rates of change in predicting future conversion to AD. Alzheimer Dis Assoc Disord 27:168–173. [DOI] [PMC free article] [PubMed] [Google Scholar]
- Markowitsch HJ (1998): Differential contribution of right and left amygdala to affective information processing. Behav Neurol 11:233–244. [DOI] [PubMed] [Google Scholar]
- McDonald RJ, White NM (1993): A triple dissociation of memory systems: Hippocampus, amygdala, and dorsal striatum. Behav Neurosci 107:3. [DOI] [PubMed] [Google Scholar]
- Miller MI, Trouve A, Younes L (2002): On the metrics and euler‐lagrange equations of computational anatomy. Annu Rev Biomed Eng 4:375–405. [DOI] [PubMed] [Google Scholar]
- Miller MI, Trouve A, Younes L (2006): Geodesic shooting for computational anatomy. J Math Imaging Vis 24:209–228. [DOI] [PMC free article] [PubMed] [Google Scholar]
- Miller MI, Younes L, Ratnanather JT, Brown T, Trinh H, Postell E, Lee DS, Wang MC, Mori S, O'Brien R, Albert M, BIOCARD Research Team (2013): The diffeomorphometry of temporal lobe structures in preclinical Alzheimer's disease. NeuroimageClin 3:352–360. [DOI] [PMC free article] [PubMed] [Google Scholar]
- Miller MI, Younes L, Ratnanather JT, Brown T, Reigel T, Trinh H, Tang X, Barker P, Mori S, Albert M (2012): Amygdala atrophy in MCI/Alzheimer's disease in the BIOCARD cohort based on diffeomorphic morphometry. In: Medical image computing and computer‐assisted intervention: MICCAI International Conference on Medical Image Computing and Computer‐Assisted Intervention, Nice, France, pp 155. [PMC free article] [PubMed]
- Miller MI, Younes L, Trouvé A (2014): Diffeomorphometry and geodesic positioning systems for human anatomy. Technology 02:36–43. [DOI] [PMC free article] [PubMed] [Google Scholar]
- Mohs RC, Rosen WG, Davis KL (1983): The Alzheimer's disease assessment scale: An instrument for assessing treatment efficacy. Psychopharmacol Bull 19:448–450. [PubMed] [Google Scholar]
- Morra JH, Tu Z, Apostolova LG, Green AE, Avedissian C, Madsen SK, Parikshak N, Hua X, Toga AW, Jack CR Jr, Schuff N, Weiner MW, Thompson PM, Alzheimer's Disease Neuroimaging Initiative (2009a): Automated 3D mapping of hippocampal atrophy and its clinical correlates in 400 subjects with Alzheimer's disease, mild cognitive impairment, and elderly controls. Hum Brain Mapp 30:2766–2788. [DOI] [PMC free article] [PubMed] [Google Scholar]
- Morra JH, Tu Z, Apostolova LG, Green AE, Avedissian C, Madsen SK, Parikshak N, Toga AW, Jack CR Jr, Schuff N, Weiner MW, Thompson PM, Alzheimer's Disease Neuroimaging Initiative (2009b): Automated mapping of hippocampal atrophy in 1‐year repeat MRI data from 490 subjects with Alzheimer's disease, mild cognitive impairment, and elderly controls. Neuroimage 45:S3–15. [DOI] [PMC free article] [PubMed] [Google Scholar]
- Munn MA, Alexopoulos J, Nishino T, Babb CM, Flake LA, Singer T, Ratnanather JT, Huang H, Todd RD, Miller MI, Botteron KN (2007): Amygdala volume analysis in female twins with major depression. Biol Psychiatry 62:415–422. [DOI] [PMC free article] [PubMed] [Google Scholar]
- Nestor SM, Rupsingh R, Borrie M, Smith M, Accomazzi V, Wells JL, Fogarty J, Bartha R, the Alzheimer's Disease Neuroimaging Initiative (2008): Ventricular enlargement as a possible measure of Alzheimer's disease progression validated using the Alzheimer's disease neuroimaging initiative database. Brain 131:2443–2454. [DOI] [PMC free article] [PubMed] [Google Scholar]
- Nichols T, Hayasaka S (2003): Controlling the familywise error rate in functional neuroimaging: A comparative review. Stat Methods Med Res 12:419–446. [DOI] [PubMed] [Google Scholar]
- Phelps EA (2004): Human emotion and memory: Interactions of the amygdala and hippocampal complex. Curr Opin Neurobiol 14:198–202. [DOI] [PubMed] [Google Scholar]
- Pluta J, Yushkevich P, Das S, Wolk D (2012): In vivo analysis of hippocampal subfield atrophy in mild cognitive impairment via semi‐automatic segmentation of T2‐weighted MRI. J Alzheimers Dis 31:85–99. [DOI] [PMC free article] [PubMed] [Google Scholar]
- Poulin SP, Dautoff R, Morris JC, Barrett LF, Dickerson BC, Alzheimer's Disease Neuroimaging Initiative (2011): Amygdala atrophy is prominent in early Alzheimer's disease and relates to symptom severity. Psychiatry Res 194:7–13. [DOI] [PMC free article] [PubMed] [Google Scholar]
- Price JL (2003): Comparative aspects of amygdala connectivity. Ann N Y Acad Sci 985:50–58. [DOI] [PubMed] [Google Scholar]
- Price JL, Davis PB, Morris JC, White DL (1991): The distribution of tangles, plaques and related immunohistochemical markers in healthy aging and Alzheimer's disease. Neurobiol Aging 12:295–312. [DOI] [PubMed] [Google Scholar]
- Price JL, Ko AI, Wade MJ, Tsou SK, McKeel DW, Morris JC (2001): Neuron number in the entorhinal cortex and CA1 in preclinical Alzheimer disease. Arch Neurol 58:1395–1402. [DOI] [PubMed] [Google Scholar]
- Price JL, Morris JC (1999): Tangles and plaques in nondemented aging and "preclinical" Alzheimer's disease. Ann Neurol 45:358–368. [DOI] [PubMed] [Google Scholar]
- Qiu A, Brown T, Fischl B, Ma J, Miller MI (2010): Atlas Generation for Subcortical and Ventricular Structures With Its Applications in Shape Analysis. IEEE Trans Image Process 19:1539–1547. [DOI] [PMC free article] [PubMed] [Google Scholar]
- Qiu A, Younes L, Wang L, Ratnanather JT, Gillepsie SK, Kaplan G, Csernansky J, Miller MI (2007): Combining anatomical manifold information via diffeomorphic metric mappings for studying cortical thinning of the cingulate gyrus in schizophrenia. Neuroimage 37:821–833. [DOI] [PMC free article] [PubMed] [Google Scholar]
- Qiu A, Fennema‐Notestine C, Dale AM, Miller MI, Alzheimer's Disease Neuroimaging Initiative (2009): Regional shape abnormalities in mild cognitive impairment and Alzheimer's disease. Neuroimage 45:656–661. [DOI] [PMC free article] [PubMed] [Google Scholar]
- Qiu A, Younes L, Miller MI, Csernansky JG (2008): Parallel transport in diffeomorphisms distinguishes the time‐dependent pattern of hippocampal surface deformation due to healthy aging and the dementia of the Alzheimer's type. Neuroimage 40:68–76. [DOI] [PMC free article] [PubMed] [Google Scholar]
- Rosen WG, Mohs RC, Davis KL (1984): A new rating scale for Alzheimer's disease. Am J Psychiatry 141:1356–1364. [DOI] [PubMed] [Google Scholar]
- Samson RD, Barnes CA (2013): Impact of aging brain circuits on cognition. Eur J Neurosci 37:1903–1915. [DOI] [PMC free article] [PubMed] [Google Scholar]
- Schonheit B, Zarski R, Ohm TG (2004): Spatial and temporal relationships between plaques and tangles in Alzheimer‐pathology. Neurobiol Aging 25:697–711. [DOI] [PubMed] [Google Scholar]
- Schott JM, Price SL, Frost C, Whitwell JL, Rossor MN, Fox NC (2005): Measuring atrophy in Alzheimer disease: A serial MRI study over 6 and 12 months. Neurology 65:119–124. [DOI] [PubMed] [Google Scholar]
- Schuff N, Woerner N, Boreta L, Kornfield T, Shaw LM, Trojanowski JQ, Thompson PM, Jack CR Jr, Weiner MW, Alzheimer's Disease Neuroimaging Initiative (2009): MRI of hippocampal volume loss in early Alzheimer's disease in relation to ApoE genotype and biomarkers. Brain 132:1067–1077. [DOI] [PMC free article] [PubMed] [Google Scholar]
- Sheline YI, Gado MH, Price JL (1998): Amygdala core nuclei volumes are decreased in recurrent major depression. Neuroreport 9:2023–2028. [DOI] [PubMed] [Google Scholar]
- Sled JG, Zijdenbos AP, Evans AC (1998): A nonparametric method for automatic correction of intensity nonuniformity in MRI data. IEEE Trans Med Imaging 17:87–97. [DOI] [PubMed] [Google Scholar]
- Smith SM, De Stefano N, Jenkinson M, Matthews PM (2001): Normalized accurate measurement of longitudinal brain change. J Comput Assist Tomogr 25:466–475. [DOI] [PubMed] [Google Scholar]
- Smith SM, Zhang Y, Jenkinson M, Chen J, Matthews PM, Federico A, De Stefano N (2002): Accurate, robust, and automated longitudinal and cross‐sectional brain change analysis. Neuroimage 17:479–489. [DOI] [PubMed] [Google Scholar]
- Sperling RA, Aisen PS, Beckett LA, Bennett DA, Craft S, Fagan AM, Iwatsubo T, Jack CR Jr, Kaye J, Montine TJ, Park DC, Reiman EM, Rowe CC, Siemers E, Stern Y, Yaffe K, Carrillo MC, Thies B, Morrison‐Bogorad M, Wagster MV, Phelps CH (2011): Toward defining the preclinical stages of Alzheimer's disease: Recommendations from the National Institute on Aging‐Alzheimer's Association workgroups on diagnostic guidelines for Alzheimer's disease. Alzheimers Dement 7:280–292. [DOI] [PMC free article] [PubMed] [Google Scholar]
- Squire LR (1992): Memory and the hippocampus: A synthesis from findings with rats, monkeys, and humans. Psychol Rev 99:195. [DOI] [PubMed] [Google Scholar]
- Tang X, Holland D, Dale AM, Younes L, Miller MI, for the Alzheimer's Disease Neuroimaging Initiative (2014): Shape abnormalities of subcortical and ventricular structures in mild cognitive impairment and Alzheimer's disease: Detecting, quantifying, and predicting. Hum Brain Mapp 35:3701–3725. [DOI] [PMC free article] [PubMed] [Google Scholar]
- Thompson PM, Hayashi KM, De Zubicaray GI, Janke AL, Rose SE, Semple J, Hong MS, Herman DH, Gravano D, Doddrell DM, Toga AW (2004): Mapping hippocampal and ventricular change in Alzheimer disease. Neuroimage 22:1754–1766. [DOI] [PubMed] [Google Scholar]
- Thompson PM, Mega MS, Woods RP, Zoumalan CI, Lindshield CJ, Blanton RE, Moussai J, Holmes CJ, Cummings JL, Toga AW (2001): Cortical change in Alzheimer's disease detected with a disease‐specific population‐based brain atlas. Cereb Cortex 11:1–16. [DOI] [PubMed] [Google Scholar]
- Thompson PM, Hayashi KM, de Zubicaray G, Janke AL, Rose SE, Semple J, Herman D, Hong MS, Dittmer SS, Doddrell DM, Toga AW (2003): Dynamics of gray matter loss in Alzheimer's disease. J Neurosci 23:994–1005. [DOI] [PMC free article] [PubMed] [Google Scholar]
- Vaillant M, Glaunès J (2005): Surface matching via currents In: Christensen G, Sonka M, Editors. Information Processing in Medical Imaging. Lecture notes in computer sciences, New York: Springer‐Verlag; pp 381–392. [DOI] [PubMed] [Google Scholar]
- van de Pol LA, Barnes J, Scahill RI, Frost C, Lewis EB, Boyes RG, van Schijndel RA, Scheltens P, Fox NC, Barkhof F (2007): Improved reliability of hippocampal atrophy rate measurement in mild cognitive impairment using fluid registration. Neuroimage 34:1036–1041. [DOI] [PubMed] [Google Scholar]
- Vazdarjanova A, McGaugh JL (1999): Basolateral amygdala is involved in modulating consolidation of memory for classical fear conditioning. J Neurosci 19:6615–6622. [DOI] [PMC free article] [PubMed] [Google Scholar]
- Wang L, Beg F, Ratnanather T, Ceritoglu C, Younes L, Morris JC, Csernansky JG, Miller MI (2007): Large deformation diffeomorphism and momentum based hippocampal shape discrimination in dementia of the Alzheimer type. IEEE Trans Med Imaging 26:462–470. [DOI] [PMC free article] [PubMed] [Google Scholar]
- Wang L, Miller JP, Gado MH, McKeel DW, Rothermich M, Miller MI, Morris JC, Csernansky JG (2006): Abnormalities of hippocampal surface structure in very mild dementia of the Alzheimer type. Neuroimage 30:52–60. [DOI] [PMC free article] [PubMed] [Google Scholar]
- Wang L, Swank JS, Glick IE, Gado MH, Miller MI, Morris JC, Csernansky JG (2003): Changes in hippocampal volume and shape across time distinguish dementia of the Alzheimer type from healthy aging. Neuroimage 20:667–682. [DOI] [PubMed] [Google Scholar]
- Wenk GL (2003): Neuropathologic changes in Alzheimer's disease. J Clin Psychiatry 64:7–10. [PubMed] [Google Scholar]
- Wolz R, Heckemann RA, Aljabar P, Hajnal JV, Hammers A, Lotjonen J, Rueckert D, Alzheimer's Disease Neuroimaging Initiative (2010): Measurement of hippocampal atrophy using 4D graph‐cut segmentation: Application to ADNI. Neuroimage 52:109–118. [DOI] [PubMed] [Google Scholar]
- Younes L, Albert M, Miller MI, BIOCARD Research Team (2014a): Inferring change point times of medial temporal lobe morphometric change in preclinical Alzheimer's disease. Neuroimage Clin 5:178–187. [DOI] [PMC free article] [PubMed] [Google Scholar]
- Younes L, Ratnanather JT, Brown T, Aylward E, Nopoulos P, Johnson H, Magnotta VA, Paulsen JS, Margolis RL, Albin RL, Miller MI, Ross CA, PREDICT‐HD Investigators and Coordinators of the Huntington Study Group (2014b): Regionally selective atrophy of subcortical structures in prodromal HD as revealed by statistical shape analysis. Hum Brain Mapp 35:792–809. [DOI] [PMC free article] [PubMed] [Google Scholar]