Abstract
Circulating angiogenic factors (CAF) like vascular endothelial growth factor (VEGF), placental growth factor (PlGF), and sVEGFR2 have potential as biomarkers for antiangiogenic therapy. The interpretation of changes in CAF is complicated by the dynamic nature of the tumor and host cells emanating CAF in response to VEGF pathway inhibition. We developed a systems pharmacology model of anti-VEGF agents to investigate CAF modulation by tumor and host cells, and the relationship between overall CAF changes in response to sunitinib and antitumor efficacy. This model distinguishes between the tumor cells' contributions from tumor-independent response to therapy and total plasma CAF correlating with antitumor activity. Altered VEGF is more likely to serve as a useful biomarker reflecting tumor responses in cancer patients whose pretreatment VEGF is higher than baseline VEGF in healthy subjects. Our findings provide a mechanistic insight into tumor modulation of angiogenic molecules, and may explain the inconsistent results found in previous biomarker studies.
Although therapies targeting the vascular endothelial growth factor (VEGF) signaling pathway can be effective, not all patients benefit from treatment. Patients who do respond show transient response, illustrating the need for validated biomarkers.1 Biomarkers allow us to monitor treatment responses, select patients who are likely to respond, determine the optimum biological dose of treatment, design combination therapies, and identify resistance to therapies.2,3,4,5
Circulating angiogenic factors (CAF) are potential biomarkers for antiangiogenic therapies. Many govern angiogenesis, and are upregulated or downregulated following anti-VEGF therapies. These changes are observed as a class effect of antiangiogenic therapies, and are detectable systemically. VEGF, PlGF, and sVEGFRs were frequently evaluated in early research: results were inconsistent.4 These CAF are produced by tumor, cells within the tumor microenvironment, and host body cells. Host cells contribute to overall CAF as seen in non-tumor-bearing mice6 and healthy subjects7 receiving sunitinib. This complicates correlating CAF with treatment outcome in cancer patients. Distinguishing between tumor- and host-produced CAF is possible in mouse xenograft models, but not in humans. To determine tumor contribution to CAF changes following antiangiogenic therapies, we used a systems pharmacology approach integrating the mechanistic details of disease targets, pathways, response, and biomarker data into a quantitative framework.8,9
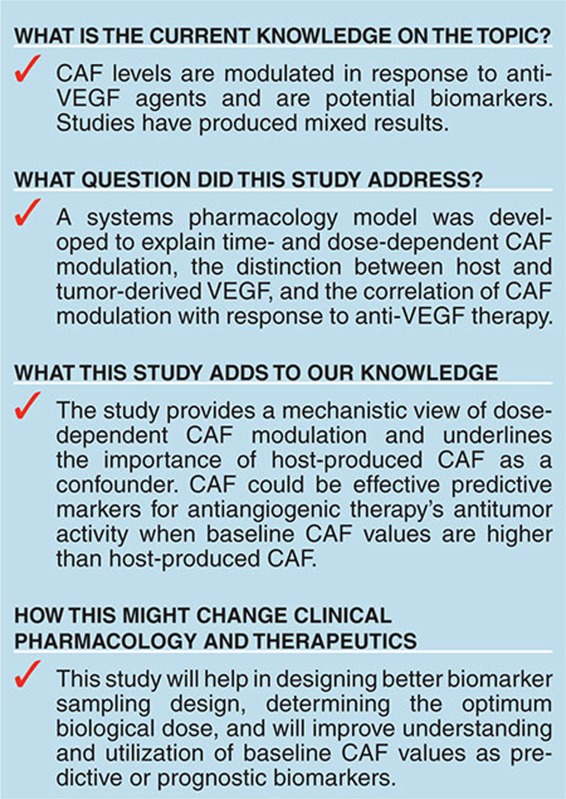
We first used mouse xenograft data and quantitatively described time- and dose-dependent CAF modulation following sunitinib with a systems pharmacology model delineating VEGF-induced VEGFR2 activation, signal transduction, tumor growth, antitumor activity, and feedback compensatory mechanisms. We then applied the model to explain VEGF modulation in cancer patients experiencing different treatment outcomes,10 and outlined the importance of baseline VEGF and its correlation to treatment outcome.
Results
Establishing a systems pharmacology model for anti-VEGF agents
Increased levels of circulating VEGF ligands are a class effect of anti-VEGF agents. Circulating soluble VEGFR-2 and -3 decrease after VEGFR-targeting treatments like sunitinib. These return to basal levels after treatment stops. This change reflects modulation of defined biological targets and is a potential pharmacodynamic biomarker, emphasizing the need to evaluate CAF dynamics quantitatively. We developed a systems pharmacology model of CAF's relationship with signaling activity in the tumor microenvironment and host body cells. It describes their connections to anti-VEGF therapy outcomes.
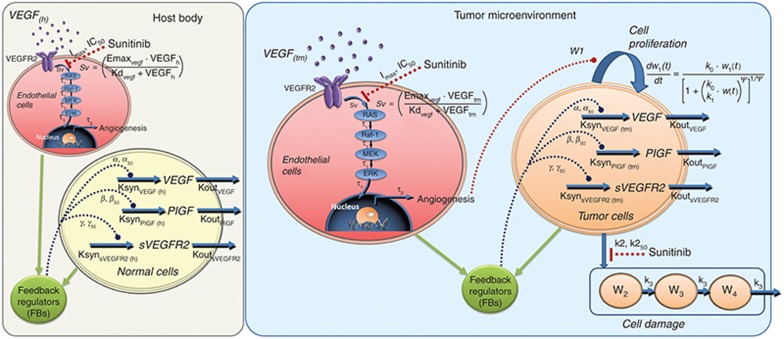
Our model characterizes (i) time- and dose-dependent angiogenic factor modulation, (ii) tumor progression after treatment with anti-VEGF agents, and (iii) host and tumor contributions to total CAF (Figure 1). Tumor cells secrete angiogenic factors, including VEGF. VEGF binds to its receptors (VEGFR2) which are expressed on endothelial cells, producing active phosphorylated receptor forms. The active signal (Sv) initiates canonical downstream cascades (Ras/Raf/MEK/ERK), causing endothelial cell proliferation and prolonged cell survival. Although different signaling cascades exist, we omitted the details of other intermediates, for simplicity. Sunitinib inhibits VEGFR2 activation in endothelial cells, exerting antiproliferative effect on tumors, and is cytotoxic at moderate to high concentrations. The model reflects these modes of action. CAF changes after anti-VEGF treatment occur as compensatory mechanisms to overcome VEGF inhibition.3,11 These are mediated by increased transcription factor HIF-1α following treatment-induced hypoxia from excessive anti-vascular effect.11,12 We described this functional adaption process using feedback regulation at the transcription factor level.
Figure 1.
Scheme of systems pharmacology model for sunitinib. Upon binding with VEGF, VEGFR2 is activated via phosphorylation of the tyrosine kinase domain (Sv), which in turn leads to activation of RAS/RAF-1/MEK/ERK cascade. Phosphorylated ERK translocates into the nucleus and regulates formation of cellular proteins and transcription factors for angiogenesis. Inhibition of the angiogenic signal by tyrosine kinase inhibitor sunitinib led to the feedback stimulation of circulating angiogenic factors from the host as well as tumor cells. Inhibition of angiogenic signals by sunitinib led to the inhibition of tumor proliferation. Sunitinib also exerts cytotoxic effects via targeting multiple kinases.
The host body contains normal cells that produce angiogenic factors (Figure 1). We assumed the same conserved mechanisms exist in CAF modulation following sunitinib treatment. We presumed sunitinib inactivates VEGF-mediated signaling pathways, but does not affect a normal cell pool. Angiogenic factor turnover, signal transduction, and tumor growth kinetics were described using a series of ordinary differential equations (see Methods section). We used a step-wise approach with increasing model complexity to improve parameter identifiability.
Tumor-independent CAF changes in non-tumor-bearing mice
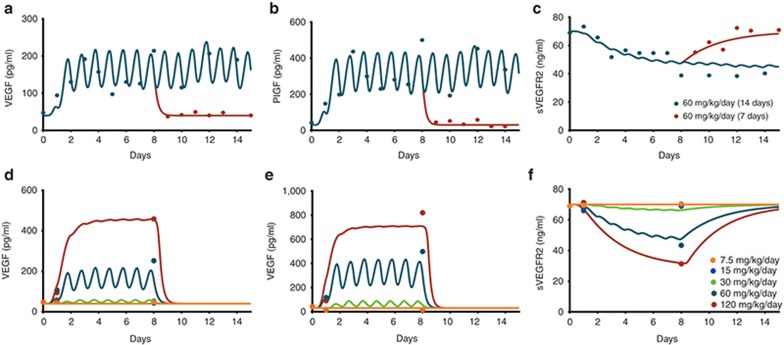
We first examined host-derived CAF modulation in non-tumor-bearing mice using data from the literature. Plasma VEGF, PlGF, and sVEGFR2 levels in normal mice receiving various sunitinib treatments (Figure 2 Supplementary Figure S1) were fitted simultaneously to the truncated model without tumor microenvironment (i.e., host body only). Following daily 60 mg/kg sunitinib, circulating VEGF and PlGF increased within 24 h and plateaued by day 5 (Figure 2a,b). Their change patterns coincided with PK profiles resulting from daily administration. The time to reach plateau matched the time taken to reach the PK steady-state. Such cyclical profiles reflect the drug elimination process compared with the biological VEGF-ligand family circulation half-lives (~3.5 h; Table 1). sVEGFR-2 levels changed slowly without fluctuating (Figure 2c), probably reflecting its longer circulation half-life (22 h). VEGF and PlGF remained elevated for the duration of therapy and returned to pretreatment values within 1–2 days of treatment withdrawal. Consistent with its turnover rate, sVEGFR2 levels returned slowly. Signal transmission from receptor phosphorylation to nucleus occurs in minutes.13,14 So, the time delay for signal transduction cascades was fixed at 0.001 (τ1). The time delay in transcriptional feedback regulation (τ2) inducing CAF modulation was within 24 h.
Figure 2.
Observed and predicted plasma concentrations of CAF following sunitinib at various dosing regimens in non-tumor-bearing mice. Top panels show changes in (a) VEGF, (b) PlGF, and (c) sVEGFR2 after 1- and 2-week administration of sunitinib at 60 mg/kg/day. Bottom panels show changes in (d) VEGF, (e) PlGF, and (f) sVEGFR2 after 1-week administration of sunitinib at a dose ranging from 7.5 to 120 mg/kg/day.
Table 1. Pharmacodynamic model parameters for angiogenic factors and tumor growth kinetics.
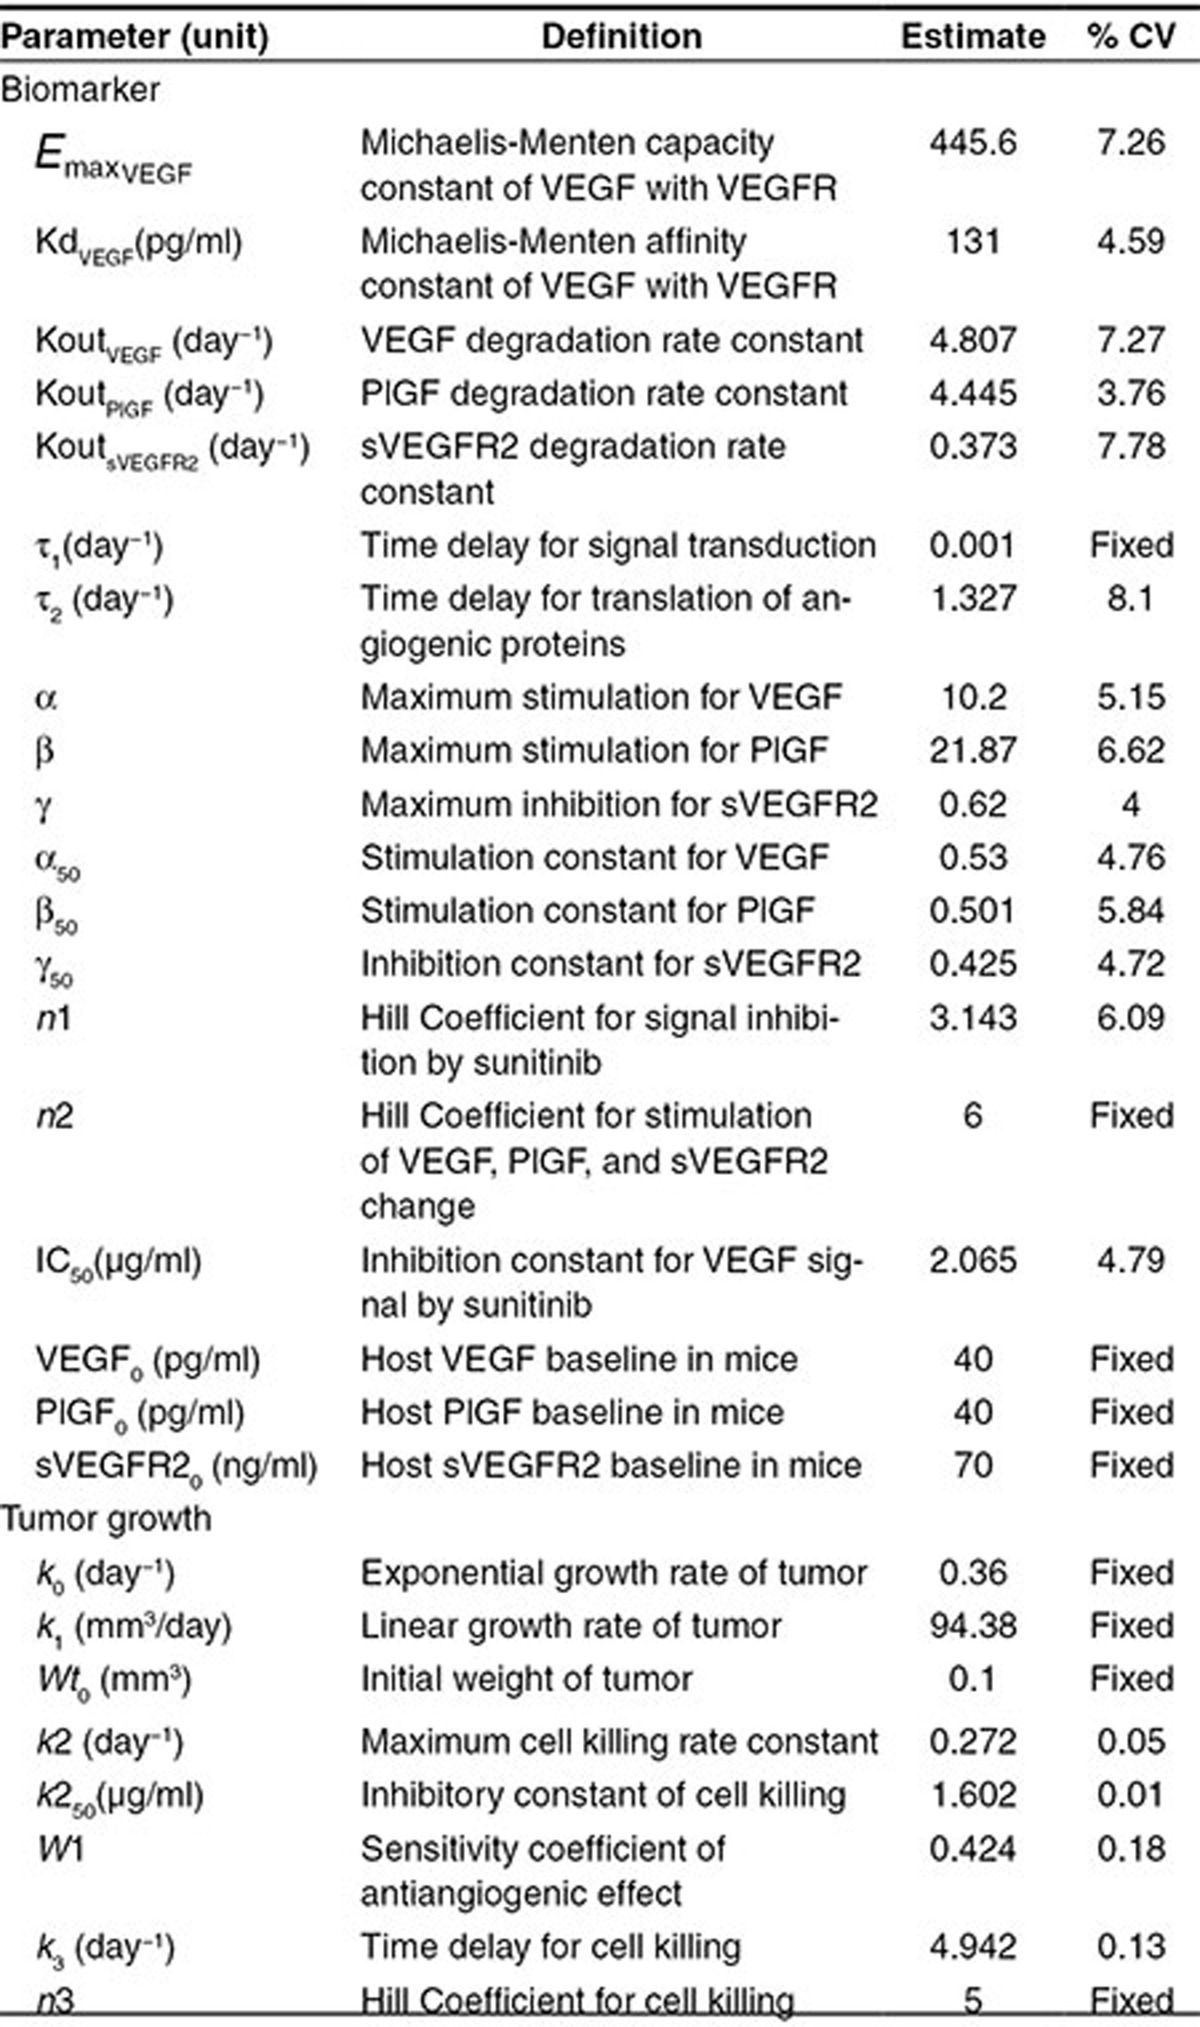
We observed a clear dose-dependency in modulating plasma CAF following 7.5 to 120 mg/kg/day sunitinib (Figure 2d–f). Doses below 30 mg/kg produced no significant changes. Doses 60 mg/kg or higher increased VEGF and PlGF and decreased sVEGFR2, suggesting a nonlinearity in sunitinib-mediated modulation with a high Hill Coefficient (n2 = 6). VEGF and PlGF had similar baseline values (40 pg/ml). The overall PlGF increase was two times higher (β = 20-fold) than VEGF (α = 10-fold). At the highest dose (γ = 0.62), sVEGFR2 decreased 62 percent from baseline (70 ng/ml).
Simulation for tumor-contributed VEGF in xenograft mice
We then simulated the tumor's contribution to systemic VEGF, using the tumor growth dynamic model describing sunitinib's antiangiogenic and cytotoxic effects. The tumor pharmacodynamic model explained the A431 tumor growth inhibition profile from sunitinib doses of 20–80 mg/kg/day (Figure 3a). Lower doses of sunitinib (20–40 mg/kg/day) decreased tumor VEGF, compared with VEGF in untreated animals. Higher doses (80 mg/kg/day) produced higher tumor VEGF than control baseline (Figure 3b). Compared with the increased VEGF by host cells (~400 pg/ml), tumor VEGF was low (Figure 3c). Overall, tumor-contributed VEGF accounted for a fraction (Figure 3d) of total plasma VEGF, consistent with reported values.15
Figure 3.
Time- and dose-dependent changes in tumor volume and plasma VEGF produced by tumor and host. (a) Tumor volume changes over time after two weeks of treatment with vehicle or sunitinib at 20, 40, and 80 mg/kg/day in A431 xenograft mice. Treatment began on day 23. (b) Simulated time profile of plasma VEGF produced by tumor after administration of vehicle, 20, 40, and 80 mg/kg/day dose of sunitinib. Corresponding tumor volume changes are shown in a. (c) Comparison of VEGF produced by host and tumor cells, after treatment with sunitinib at 40 and 80 mg/kg/day for two weeks starting at day 23. (d) Total VEGF concentrations and contribution of VEGF produced by host and tumor at the end of the study on day 36.
Simulation for VEGF changes in humans
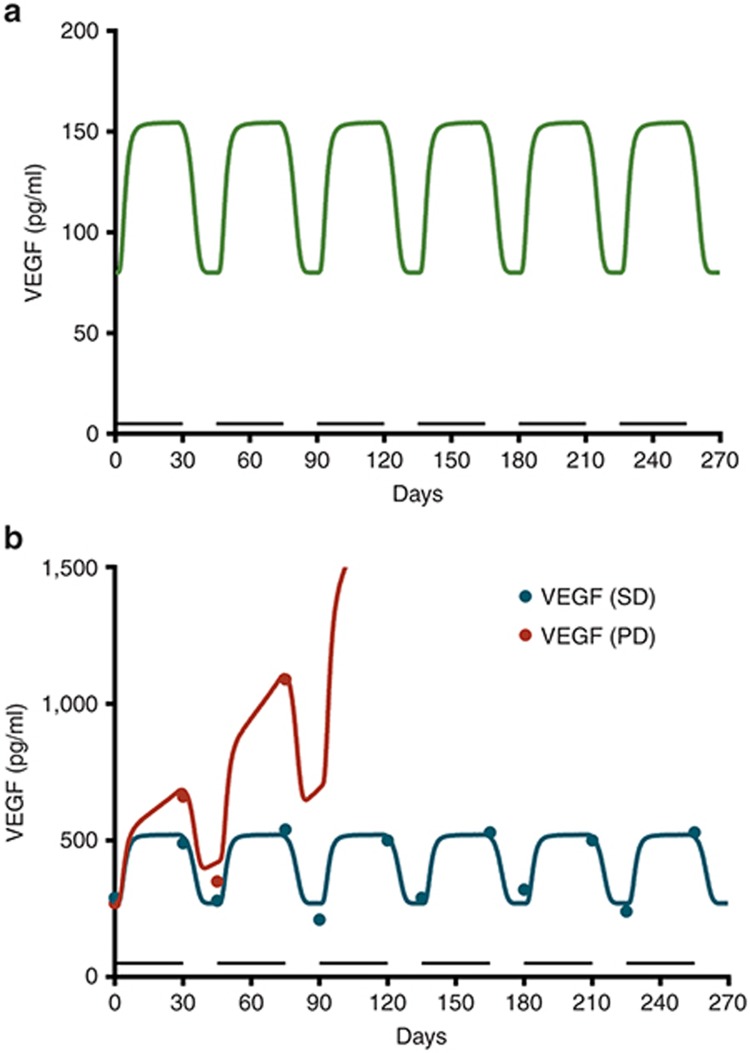
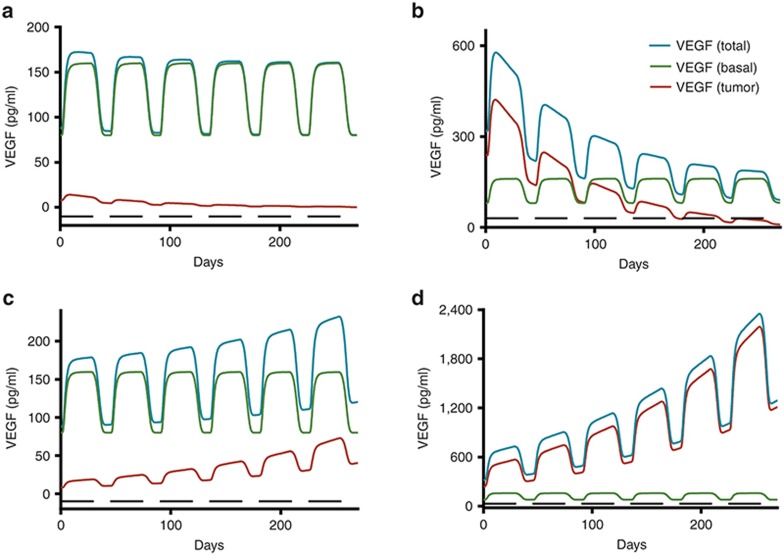
We modeled levels of clinical VEGF from the literature.7,10 We scaled the preclinical model up to capture the mean change in VEGF by modifying the sensitivity parameter (α50 = 1.46 vs. 0.53, preclinical data; Figure 4a). Then, we simulated the mean VEGF for patients with metastatic renal cell carcinoma (mRCC). Beginning treatment with 50 mg sunitinib, we showed stable disease (SD) and progressive disease (PD) with baseline VEGF of 290 and 270 pg/ml, respectively.10 Any difference in mean VEGF between cancer patients and healthy volunteers was inferred to be tumor-contributed. The model-predicted values were consistent with the mean VEGF changes in cancer patients (Figure 4b). The fold change relative to pretreatment VEGF was the same (approximately twofold) in healthy participants (80→ 160 pg/ml) as cancer patients with stable disease (290→ 530 pg/ml) who received the same dose. We inferred that tumor-contributed VEGF and total VEGF remained constant in stable disease, with no changes in tumor size. In patients with PD, growing tumors produced more VEGF, manifested as an increase in mean VEGF over time (Figure 4b). If the tumor contributes more VEGF than the healthy cells, systemic VEGF levels likely reflect changes in tumor growth (Figure 5b,d). This contrasts with the scenarios in which the tumor's contribution to VEGF is lower than the host cells (Figure 5a,c).
Figure 4.
Plasma concentrations of VEGF in healthy and metastatic renal cell carcinoma (mRCC) patients receiving sunitinib. (a) Simulated plasma concentrations of VEGF in healthy volunteers after daily sunitinib at 50 mg (4 weeks on/2 weeks off), (b) mRCC patients, after daily dose of sunitinib at 50 mg (4 weeks on/2 weeks off) in patients showing stable disease (SD), i.e., no growth of tumor, and progressive disease (PD) showing an increase in total systemic VEGF. Bar indicates the duration of sunitinib treatment (4 weeks on). The symbols are observed values.10
Figure 5.
Simulated plasma concentration time profiles of VEGF in cancer patients with partial response (PR: upper panels): either (a) with low VEGF levels ( = 88 pg/ml) or (b) with high VEGF levels (
 = 320 pg/ml); in cancer patients with progressive disease (PD: lower panels) either (c) with low VEGF levels or (d) with high VEGF levels. The low VEGF (
 = 88 pg/ml) was defined as tumor VEGF levels tenfold lower than endogenous VEGF in healthy subjects (
 = 80 pg/ml), whereas the high VEGF (
 = 320 pg/ml) was defined as tumor VEGF levels threefold higher than baseline VEGF in healthy subjects.
Discussion
We developed a systems pharmacology model to understand the relationship between CAF dynamics and in vivo antitumor activity in response to anti-VEGF agents. Antiangiogenic therapies target the stroma, not the tumor. Because these agents are cytostatic, monitoring clinical treatment outcomes is challenging. Finding the optimum biological dose is difficult.16 Identifying valid biomarkers would allow drug efficacy monitoring and clarify the optimum dose. CAF which increases or decreases following treatment suggest drug-related effects.4 Using CAF changes as predictive biomarkers for treatment response is challenging and produces inconclusive results.4 Contributing to these inconsistencies are tumor growth's dynamic nature,17 compensatory mechanisms,11,18 CAF production by healthy cells,4,6,7,19 and PK variability.20 There is a growing need for a computational modeling tool that can integrate these complex systems in a quantitative framework to enable translating knowledge about CAF changes into improved therapeutic outcomes for patients. Hansson et al. used a PK/PD model to correlate CAF changes with treatment outcome.21 Their results suggest sVEGFR3 as a potential predictive biomarker. However, their model does not explain the mechanistic basis of biomarker modulation in tumors or host cell contributions.
Host-derived CAF and how these might confound correlating CAF changes with treatment outcomes is a major concern, since angiogenesis is a conserved physiological process in healthy cells,22 which respond similarly to antiangiogenic therapy.7 Distinguishing between tumor-derived VEGF and host-derived VEGF is impossible with current technologies. Using xenograft mouse models is advantageous. Tumor- (human-) derived VEGF can be distinguished from host- (mouse-) derived VEGF. We used a mouse xenograft model and characterized host-derived CAF modulation in non-tumor-bearing mice following sunitinib treatment. The tumor's contribution was added with model assumptions based on the literature. Notably, estimates of the stimulation/inhibition capacity of VEGF (α), sVEGFR2 (γ), and the hill coefficient (n1) in mice were 10.2, 0.62, and 3.143, respectively. These values are similar to those reported in healthy volunteers: 10.2, 0.50, and 4.3,7 supporting the idea that system-specific parameters for conserved physiological processes like angiogenesis are comparable across species.
Our model provides a quantitative understanding of baseline CAF and an explanation for inconsistent results regarding CAF as predictive biomarkers. Hansson et al. showed that relative changes in sVEGFR3 from baseline predicted the GIST patients' survival following treatment.21 Changes in VEGF and sVEGFR2 did not. Baseline sVEGFR3 was approximately threefold higher than that of healthy volunteers.23 VEGF and sVEGFR2 values were close to their baseline values in healthy volunteers.7 Similarly, Kontovinis et al. reported VEGF as a predictive biomarker. Baseline VEGF was again approximately threefold higher than baseline VEGF in normal participants.7 VEGF was not a predictive biomarker in hepatocellular carcinoma24 or mRCC.25 This is consistent with our finding that CAF could be effective predictive markers when baseline values are higher than host-produced CAF. Although higher baseline CAF have potential as predictive and prognostic biomarkers, they also suggest higher tumor burden and aggressiveness of disease. Studies have reported that patients with higher baseline VEGF have shorter progression-free survival or overall survival compared with patients with lower baseline VEGF.26,27,28,29
Our findings suggest that CAF's biological circulation time is a factor in selecting suitable biomarkers and designing sampling times. VEGF ligands with short half-lives fluctuate and show high variability over time. Soluble receptors with longer half-lives were less sensitive to sampling schedules with lower variability. Hence, soluble receptors were better suited as biomarkers. Measuring CAF at the end of the washout period could relate levels to treatment efficacy and tumor burdens. Future biomarker research should seek factors selectively secreted only by tumors, to identify successful predictive biomarkers for antiangiogenic therapies.
Optimum antiangiogenic drug dosing leads to normalization of blood vessels and better therapeutic management of solid tumors.30,31 Higher doses lead to excessive blood vessel pruning producing increased hypoxia, leading to compensatory increase in proangiogenic signals. This is consistent with our findings that, at lower drug doses, tumor VEGF declined compared with controls (Figure 3b). Despite greater tumor suppression at 80 mg/kg doses, tumor VEGF increased. The therapeutic gain from increasing the dose above 40 mg/kg was modest, compared with the corresponding tumor VEGF elevation.
A bidirectional change in tumor VEGF following anti-VEGF therapy has been proposed.32 CAF upregulation occurs following anti-VEGF therapy, is dose dependent, and might contribute towards mechanisms helping the tumors escape VEGF inhibition.11 A higher dose might be counterproductive. This underlines the importance of the right treatment dose. A “VEGF Inhibition Index” using CAF changes would be valuable to determine the optimum drug dose balancing therapeutic benefits and excessive pruning. Our model could be used in such efforts.
Several signaling pathways mediate cell proliferation, migration, survival, and permeability. We focused on VEGF-VEGFR2 interaction and its canonical Ras/Raf/Mek/Erk signaling pathway, as this is the major pathway involved in endothelial cell proliferation.12,33,34 Our primary objective was to delineate time- and dose-dependent changes in CAF, determine their origin, and link these to anti-VEGF effects on tumor growth. Although we focused on the VEGFR2-mediated signaling pathway, we recognize the potential contribution of other VEGFR isoforms and families omitted from our model. VEGFR1 and soluble receptors can influence the ligand-receptor binding process by acting as negative regulators, since they have a higher binding affinity to VEGF than VEGFR2.35 Similarly, co-receptors increase VEGF's binding affinity to VEGFR, influencing binding kinetics.36 The estimate of KdVEGF (131 pg/ml or ≈3.3 pmol/l) from this study likely represents the overall average contributed from the isoforms of VEGF-VEGFR family present in vivo, and thus could be different from the binding affinity (Kd) estimated in vitro. Few studies have reported an in vitro estimation of Kd value: those that do report estimates of 1–400 pmol/l for VEGF to VEGFR1 and VEGFR2.37,38 The VEGF trap consists of the Ig domain of human VEGFR1 and VEGFR2, which binds to VEGF-A and its isoforms, VEGF-B, and PlGF. The Kd of the VEGF trap might better mimic the in vivo estimation. The reported Kd value for the VEGF trap is 0.36–29.3 pmol/l39 and is comparable with the estimate derived from our model. Popel et al. have contributed to a quantitative understanding of VEGFR2 receptor trafficking, transport, and kinetics of the VEGF ligand family, receptors, and co-receptors involved in angiogenesis.32,34,40,41 Knowledge from these studies will help us to expand our model.
Cancer signaling networks are complex. Knowledge about these networks is evolving. Recent work by Kirouac14 and Zhang et al.42 highlights systems pharmacology modeling approaches integrating diverse information about biomarkers and network activity to predict therapeutic response and identify key targets for inhibition.
We developed a base model which can be refined and improved with additional data and mechanistic information. The goal of the systems pharmacology model is also to generate hypotheses which can be further explored and tested.43 The model framework can be adapted for other antiangiogenic drugs showing a class effect.4
Our systems pharmacology model illustrates angiogenesis biomarker modulation in response to anti-VEGF therapy. We must recognize the relative contributions from host-derived CAF over tumor-derived CAF. Our findings will aid in biomarker study design and determining optimum drug doses, and highlight baseline CAF as a potential confounding factor.
Methods
Data collection and computational approaches
All datasets were obtained from the literature (Supplementary Table S1) and digitized using GetData Graph Digitizer (version 2.26.0.20). The model was constructed in a step-wise manner, connecting (i) host-derived CAF in non-tumor-bearing mice, (ii) tumor growth profile in xenograft mice, (iii) CAF emanating from xenografted tumor, and (iv) VEGF changes in healthy participants and cancer patients. Parameters obtained by fitting CAF modulation in host cells by sunitinib treatment were fixed for modeling tumor growth data. All model fittings used the maximum likelihood algorithm in ADAPT 5 (Biomedical Simulations Resource, CA Supplementary Data).44 For simulations, we used Berkeley Madonna (version 8.3.18, University of California at Berkeley, CA).
Pharmacokinetics
Preclinical PK parameters were estimated using a one-compartment model (Supplementary Table S2) from the plasma profile of sunitinib in rats.45 PK parameters were fixed in subsequent pharmacodynamic modeling. For humans, mean population PK parameters for sunitinib and its metabolite SU12662, estimated with a two-compartment model, were obtained.46 Plasma protein binding of sunitinib and the metabolite was assumed to be 95 and 90%.7
Ligand-receptor interactions and anti-VEGF effects
VEGF binds to and activates receptor tyrosine kinases. The VEGF-VEGFR family includes five ligands (VEGF-A through -D and PlGF), three receptors (VEGFR-1, -2, and -3), and two non-signaling co-receptors (NRP-1 and NRP-2). Our model described VEGF-A (called VEGF) stimulation of VEGFR-2 homodimers as the primary ligand-receptor initiating intracellular signaling pathways. Sunitinib, a small molecule tyrosine kinase inhibitor, competitively inhibits VEGFR phosphorylation and the downstream signaling pathway. The phosphorylated VEGFR signal (Sv) resulting from the VEGF-induced VEGFR activation and sunitinib-induced VEGFR inactivation was explained by a combination of competitive ligand–receptor binding and inhibitory Hill function model.
 |
where  is the maximum VEGFR activation by VEGF binding in fully stimulated cells, proportional to the steady-state VEGFR amount, and KdVEGF is an affinity constant of VEGFtotal toward VEGFR. Before sunitinib administration, the steady-state VEGFR activation (Sv0) by baseline
  is defined as:
 |
C represents sunitinib concentration. We assumed VEGFR activation is fully inhibited by sunitinib (Imax = 1). IC50 is the sunitinib concentration producing 50% of maximum VEGFR inactivation and n1 is the Hill Coefficient for signal inhibition and VEGFtotal represents the sum of VEGF from host and tumor.
Signal transduction
VEGFR2 activation initiates signaling pathways.33 Several intermediate steps are involved in signal transmission from active receptor to nucleus.42 We simplified this to the Ras/Raf/MEK/ERK downstream pathway. The signal transmits from the active receptor to the serial kinases within 15 min. The intermediaries are not experimentally measured. So, the extracellular ligand-induced Ras/Raf/MEK/ERK cascade activation was described by the signal transduction model.47 Cascades are initiated from phosphorylated receptor relative to the steady-state baseline (Sv/Sv0), converting into normalized intracellular signals. Signal transit compartments represent the activated kinases as a ratio of phosphorylated/total kinase (normalized to 1 at baseline). Phosphorylated ERK translocates to the nucleus (NUC) to regulate nuclear transcription factors and cellular proteins.
 |
 |
 |
 |
 |
 |
where ANG represents the angiogenic signal in the transcriptional level, induced by VEGF-VEGFR interaction, prompting VEGF-mediated angiogenic effects. Two delay time parameters accounted for delayed signal transmission from phosphorylated-receptor to translocation to nucleus (τ1) and delayed transcriptional factor regulation for angiogenic proteins (τ2). The initial condition is 1 for Eqs. 2–6 and τ2/τ1 for Eq. 7.
Host- and tumor-driven CAF modulation by feedback regulation following sunitinib
Continuous VEGF-pathway blockade leads to vessel pruning, which can produce hypoxia and CAF modulation as an acute phase functional adaptation.6,7 Time course and CAF modulation were described by indirect response models with non-linear feedback stimulation or inhibition function.
 |
 |
 |
where Xtotal is the total concentration of angiogenic factors produced from the host body (X(h)) and tumor (X(tm)). At the steady-state (before treatment), the baseline concentration of these factors  is defined as:
 |
 |
 |
KsynX(h) and KsynX(tm) refer to the zero-order production rate for host- and tumor-originated factors. The degradation rate constant (KoutX) is assumed the same for both host- and tumor-originated proteins.
Tumors, the microenvironment, and host cells contribute to these compensatory changes: similar patterns were observed in non-tumor-bearing mice receiving sunitinib. We expressed treatment-induced angiogenic factor modulations as a functional adaptation process mediated via a transcriptional feedback regulation. This feedback regulatory circuit (FB) is operated by the change in VEGF-VEGFR-mediated angiogenic signal relative to its baseline:
 |
where ANG0 is the basal angiogenic signal produced by VEGF-VEGFR interaction. As ANG is perturbed by anti-VEGF treatment, it produces a feedback signal and stimulates or inhibits angiogenic protein production. The α, β, γ parameters represent maximum fold changes: α50, β50, γ50 are the FB signal, producing 50% of the maximum changes. The Hill Coefficient (n2) was common for all three factors. We assumed feedback regulation works similarly for tumor and host cells.
Host-driven CAF changes in non-tumor-bearing mice
We characterized dynamic changes in plasma concentrations of VEGF, PlGF, and sVEGFR-2 over time in non-tumor-bearing mice receiving sunitinib as reported by Ebos et al.6 In non-tumor-bearing mice, the tumor contribution toward CAF production was set to zero  and KsynX(tm) = 0) in Eqs. 8–11. The host-driven CAF production rate (KsynX(h)) was expressed as a secondary parameter as:
 |
 |
 |
Tumor growth in xenograft mice
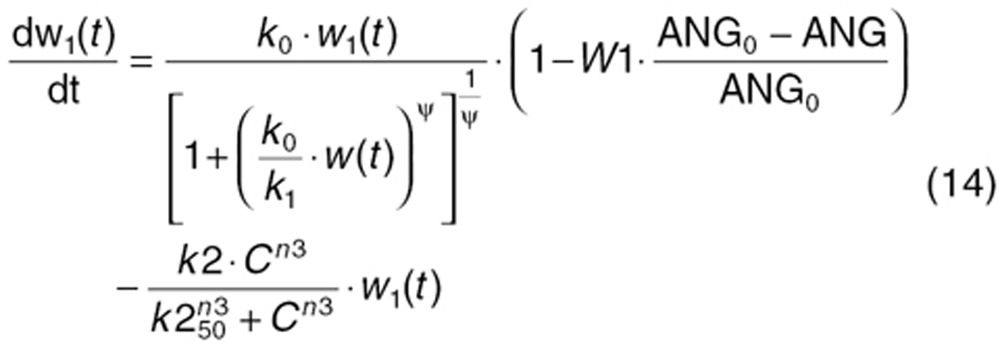
To characterize tumor contribution to total CAF, dynamic tumor size changes following anti-VEGF therapy must be linked to VEGF turnover: VEGF production changes as a function of tumor weight.15 The tumor growth model described sunitinib's antitumor effects in A431 xenograft mice.48,49 Tumor growth was explained by rate of exponential (k0) and linear growth (k1). Sunitinib's antiangiogenic effect was expressed as overall growth suppression resulting from angiogenic signal inhibition with a sensitivity index (W1). Cell death occurring at high concentrations was explained by a non-linear irreversible function where k250 is the sunitinib concentration at 50% of maximum cell death (k2), n3 is the Hill Coefficient, k3 is a first-order transduction rate constant for cell death, and ψ = 20, which leads to the transition from exponential to linear tumor growth.49
 |
 |
 |
 |
 |
Tumor-driven VEGF changes as a function of tumor growth in xenograft mice
The aforementioned dynamic change in VEGF production rate by tumor (KsynVEGF(tm); Eq. 8) was expressed as a function of tumor size (w(t)).
 |
where  is an intrinsic tumor VEGF production rate per tumor volume. This rate
  was calculated on the terminal tumor volume
  and plasma VEGF concentration (
 ) in control mice at study termination (
 = 1,600 mm3).
 |
The advantage of using  and
and  is these values are measurable, unlike initial tumor volume (
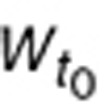 ) which is mathematically extrapolated. With small tumors, no tumor VEGF is detectable in mouse plasma. The baseline value of tumor-dependent VEGF (
 ; Eq. 11a) before treatment changes over time as the tumor grows, and is approximately based on tumor volume at treatment initiation (
 ).
).
 |
In mice xenografted with human cancer cells, the human VEGF form is tumor-originated and different from mouse VEGF (host-driven VEGF). We used  = 40 pg/ml in plasma from control SKOV3 xenograft mice using an ELISA kit specific to human VEGF (data not shown).
Dynamic VEGF changes in humans
We explored whether our model would translate into clinical settings to understand VEGF changes accompanying sunitinib treatment. We started with host-driven VEGF changes following sunitinib treatment in healthy volunteers, by setting the tumor VEGF contribution to zero. Tumor growth and tumor VEGF turnover process were added to account for cancer patients. To permit preclinical to clinical translation, we used the mean baseline VEGF in healthy subjects ( = 80 pg/ml).7 Accounting for interspecies differences, we kept VEGF stimulation capacity (α = 10) the same, but changed the sensitivity constant (α50), allowing a twofold VEGF increase in healthy subjects taking sunitinib, per a previous study.7
We modified the tumor growth model and intrinsic VEGF production rate to account for tumor cells' contribution to VEGF changes in cancer patients. Instead of preclinical tumor VEGF ( ) and tumor volume (
 ) measured at xenograft study termination (Eq. 20), the intrinsic tumor VEGF production rate in cancer patients (
 ) was calculated based on baseline tumor VEGF (
 ) and tumor volume (WTBL) at treatment initiation, both accessible, relevant parameters. The VEGF production rate from tumor (KsynVEGF(TM)) was expressed as a function of tumor volume (WT(t)). Tumor-derived VEGF (
 ) in total VEGF in cancer patients (
 ) was determined based on the difference from baseline VEGF in healthy volunteers (
 = 80 pg/ml).
 |
 |
 |
Clinical tumor growth WT(t) was modeled by a simple equation, using the first-order tumor growth rate (Kg) from baseline tumor (WTBL) before treatment.
 |
We performed simulations using Response Evaluation Criteria In Solid Tumors guidelines, to mimic clinical outcomes.50 Tumor VEGF and total VEGF time profiles were simulated for stable disease assuming no tumor growth (Kg = 0), partial response, and PD. Kg values were modified to allow a 30% decrease in the sum of tumor lesion diameters in partial response (Kg = −0.012 day−1), and 20% increase in the sum of tumor lesion diameters in PD (Kg = 0.006 day−1). Simulations were performed for PD and partial response with two VEGF baseline concentrations: (i) tumor VEGF threefold higher than endogenous VEGF in healthy volunteers ( = 320 pg/ml), and (ii) tumor VEGF tenfold lower than endogenous VEGF (
 = 88 pg/ml). Percentage change in tumor diameter was used to calculate percentage change in tumor volume, assuming the tumor to be spherical.
Conflict of Interest
The authors declared no conflict of interest.
Author Contributions
S.S. and S.W. wrote the manuscript, designed the research, performed the research, and analyzed the data.
Study Highlights
Acknowledgments
This work was supported by College of Pharmacy, OUHSC, and NIH grant number 1P20GM103639-01 from the COBRE program of the NIH to S.W.
Supplementary Material
References
- Murukesh N., Dive C., Jayson G.C. Biomarkers of angiogenesis and their role in the development of VEGF inhibitors. Br. J. Cancer. 2010;102:8–18. doi: 10.1038/sj.bjc.6605483. [DOI] [PMC free article] [PubMed] [Google Scholar]
- Sessa C., Guibal A., Del Conte G., Rüegg C. Biomarkers of angiogenesis for the development of antiangiogenic therapies in oncology: tools or decorations. Nat. Clin. Pract. Oncol. 2008;5:378–391. doi: 10.1038/ncponc1150. [DOI] [PubMed] [Google Scholar]
- Jahangiri A., Aghi M.K. Biomarkers predicting tumor response and evasion to anti-angiogenic therapy. Biochim. Biophys. Acta. 2012;1825:86–100. doi: 10.1016/j.bbcan.2011.10.004. [DOI] [PubMed] [Google Scholar]
- Jain R.K., et al. Biomarkers of response and resistance to antiangiogenic therapy. Nat. Rev. Clin. Oncol. 2009;6:327–338. doi: 10.1038/nrclinonc.2009.63. [DOI] [PMC free article] [PubMed] [Google Scholar]
- Duda D.G., Munn L.L., Jain R.K. Can we identify predictive biomarkers for antiangiogenic therapy of cancer using mathematical modeling. J. Natl. Cancer Inst. 2013;105:762–765. doi: 10.1093/jnci/djt114. [DOI] [PMC free article] [PubMed] [Google Scholar]
- Ebos J.M., Lee C.R., Christensen J.G., Mutsaers A.J., Kerbel R.S.Multiple circulating proangiogenic factors induced by sunitinib malate are tumor-independent and correlate with antitumor efficacy Proc. Natl. Acad. Sci. U.S.A 10417069–17074.2007. Copyright (2007) National Academy of Sciences, U.S.A. [DOI] [PMC free article] [PubMed] [Google Scholar]
- Lindauer A., et al. Pharmacokinetic/pharmacodynamic modeling of biomarker response to sunitinib in healthy volunteers. Clin. Pharmacol. Ther. 2010;87:601–608. doi: 10.1038/clpt.2010.20. [DOI] [PubMed] [Google Scholar]
- Vicini P., van der Graaf P.H. Systems pharmacology for drug discovery and development: paradigm shift or flash in the pan. Clin. Pharmacol. Ther. 2013;93:379–381. doi: 10.1038/clpt.2013.40. [DOI] [PubMed] [Google Scholar]
- van der Graaf P.H., Benson N. Systems pharmacology: bridging systems biology and pharmacokinetics-pharmacodynamics (PKPD) in drug discovery and development. Pharm. Res. 2011;28:1460–1464. doi: 10.1007/s11095-011-0467-9. [DOI] [PubMed] [Google Scholar]
- Kontovinis L.F., Papazisis K.T., Touplikioti P., Andreadis C., Mouratidou D., Kortsaris A.H. Sunitinib treatment for patients with clear-cell metastatic renal cell carcinoma: clinical outcomes and plasma angiogenesis markers. BMC Cancer. 2009;9:82. doi: 10.1186/1471-2407-9-82. [DOI] [PMC free article] [PubMed] [Google Scholar]
- Bergers G., Hanahan D. Modes of resistance to anti-angiogenic therapy. Nat. Rev. Cancer. 2008;8:592–603. doi: 10.1038/nrc2442. [DOI] [PMC free article] [PubMed] [Google Scholar]
- Cook K.M., Figg W.D. Angiogenesis inhibitors: current strategies and future prospects. CA. Cancer J. Clin. 2010;60:222–243. doi: 10.3322/caac.20075. [DOI] [PMC free article] [PubMed] [Google Scholar]
- Wagner J.P., et al. Receptor tyrosine kinases fall into distinct classes based on their inferred signaling networks. Sci. Signal. 2013;6:ra58. doi: 10.1126/scisignal.2003994. [DOI] [PMC free article] [PubMed] [Google Scholar]
- Kirouac D.C., et al. Computational modeling of ERBB2-amplified breast cancer identifies combined ErbB2/3 blockade as superior to the combination of MEK and AKT inhibitors. Sci. Signal. 2013;6:ra68. doi: 10.1126/scisignal.2004008. [DOI] [PubMed] [Google Scholar]
- Rudge J.S., et al. VEGF Trap complex formation measures production rates of VEGF, providing a biomarker for predicting efficacious angiogenic blockade. Proc. Natl. Acad. Sci. U.S.A. 2007;104:18363–18370. doi: 10.1073/pnas.0708865104. [DOI] [PMC free article] [PubMed] [Google Scholar]
- Bertolini F., Shaked Y., Mancuso P., Kerbel R.S. The multifaceted circulating endothelial cell in cancer: towards marker and target identification. Nat. Rev. Cancer. 2006;6:835–845. doi: 10.1038/nrc1971. [DOI] [PubMed] [Google Scholar]
- Manenti L., et al. Circulating plasma vascular endothelial growth factor in mice bearing human ovarian carcinoma xenograft correlates with tumor progression and response to therapy. Mol. Cancer Ther. 2005;4:715–725. doi: 10.1158/1535-7163.MCT-04-0305. [DOI] [PubMed] [Google Scholar]
- Yuasa T., Takahashi S., Hatake K., Yonese J., Fukui I. Biomarkers to predict response to sunitinib therapy and prognosis in metastatic renal cell cancer. Cancer Sci. 2011;102:1949–1957. doi: 10.1111/j.1349-7006.2011.02054.x. [DOI] [PubMed] [Google Scholar]
- Hori S.S., Gambhir S.S. Mathematical model identifies blood biomarker-based early cancer detection strategies and limitations. Sci. Transl. Med. 2011;3:109ra116. doi: 10.1126/scitranslmed.3003110. [DOI] [PMC free article] [PubMed] [Google Scholar]
- Klümpen H.J., Samer C.F., Mathijssen R.H., Schellens J.H., Gurney H. Moving towards dose individualization of tyrosine kinase inhibitors. Cancer Treat. Rev. 2011;37:251–260. doi: 10.1016/j.ctrv.2010.08.006. [DOI] [PubMed] [Google Scholar]
- Hansson E.K., et al. PKPD Modeling of VEGF, sVEGFR-2, sVEGFR-3, and sKIT as Predictors of Tumor Dynamics and Overall Survival Following Sunitinib Treatment in GIST. CPT. Pharmacometrics Syst. Pharmacol. 2013;2:e84. doi: 10.1038/psp.2013.61. [DOI] [PMC free article] [PubMed] [Google Scholar]
- Gavin T.P., Robinson C.B., Yeager R.C., England J.A., Nifong L.W., Hickner R.C. Angiogenic growth factor response to acute systemic exercise in human skeletal muscle. J. Appl. Physiol. 2004;96:19–24. doi: 10.1152/japplphysiol.00748.2003. [DOI] [PubMed] [Google Scholar]
- Mouawad R., Spano J.P., Comperat E., Capron F., Khayat D. Tumoural expression and circulating level of VEGFR-3 (Flt-4) in metastatic melanoma patients: correlation with clinical parameters and outcome. Eur. J. Cancer. 2009;45:1407–1414. doi: 10.1016/j.ejca.2008.12.015. [DOI] [PubMed] [Google Scholar]
- Harmon C.S., et al. Mechanism-related circulating proteins as biomarkers for clinical outcome in patients with unresectable hepatocellular carcinoma receiving sunitinib. J. Transl. Med. 2011;9:120. doi: 10.1186/1479-5876-9-120. [DOI] [PMC free article] [PubMed] [Google Scholar]
- Deprimo S.E., et al. Circulating protein biomarkers of pharmacodynamic activity of sunitinib in patients with metastatic renal cell carcinoma: modulation of VEGF and VEGF-related proteins. J. Transl. Med. 2007;5:32. doi: 10.1186/1479-5876-5-32. [DOI] [PMC free article] [PubMed] [Google Scholar]
- Llovet J.M., Peña C.E., Lathia C.D., Shan M., Meinhardt G., Bruix J. SHARP Investigators Study Group Plasma biomarkers as predictors of outcome in patients with advanced hepatocellular carcinoma. Clin. Cancer Res. 2012;18:2290–2300. doi: 10.1158/1078-0432.CCR-11-2175. [DOI] [PMC free article] [PubMed] [Google Scholar]
- Escudier B., et al. Sorafenib for treatment of renal cell carcinoma: Final efficacy and safety results of the phase III treatment approaches in renal cancer global evaluation trial. J. Clin. Oncol. 2009;27:3312–3318. doi: 10.1200/JCO.2008.19.5511. [DOI] [PubMed] [Google Scholar]
- Jürgensmeier J.M., et al. Prognostic and predictive value of VEGF, sVEGFR-2 and CEA in mCRC studies comparing cediranib, bevacizumab and chemotherapy. Br. J. Cancer. 2013;108:1316–1323. doi: 10.1038/bjc.2013.79. [DOI] [PMC free article] [PubMed] [Google Scholar]
- Rini B.I., et al. Antitumor activity and biomarker analysis of sunitinib in patients with bevacizumab-refractory metastatic renal cell carcinoma. J. Clin. Oncol. 2008;26:3743–3748. doi: 10.1200/JCO.2007.15.5416. [DOI] [PubMed] [Google Scholar]
- Goel S., Wong A.H., Jain R.K. Vascular normalization as a therapeutic strategy for malignant and nonmalignant disease. Cold Spring Harb. Perspect. Med. 2012;2:a006486. doi: 10.1101/cshperspect.a006486. [DOI] [PMC free article] [PubMed] [Google Scholar]
- Jain R.K. Normalization of tumor vasculature: an emerging concept in antiangiogenic therapy. Science. 2005;307:58–62. doi: 10.1126/science.1104819. [DOI] [PubMed] [Google Scholar]
- Finley S.D., Popel A.S. Effect of tumor microenvironment on tumor VEGF during anti-VEGF treatment: systems biology predictions. J. Natl. Cancer Inst. 2013;105:802–811. doi: 10.1093/jnci/djt093. [DOI] [PMC free article] [PubMed] [Google Scholar]
- Tugues S., Koch S., Gualandi L., Li X., Claesson-Welsh L. Vascular endothelial growth factors and receptors: anti-angiogenic therapy in the treatment of cancer. Mol. Aspects Med. 2011;32:88–111. doi: 10.1016/j.mam.2011.04.004. [DOI] [PubMed] [Google Scholar]
- Tan W.H., Popel A.S., Mac Gabhann F. Computational model of VEGFR2 pathway to ERK activation and modulation through receptor trafficking. Cell. Signal. 2013;25:2496–2510. doi: 10.1016/j.cellsig.2013.08.015. [DOI] [PMC free article] [PubMed] [Google Scholar]
- Hoeben A., Landuyt B., Highley M.S., Wildiers H., Van Oosterom A.T., De Bruijn E.A. Vascular endothelial growth factor and angiogenesis. Pharmacol. Rev. 2004;56:549–580. doi: 10.1124/pr.56.4.3. [DOI] [PubMed] [Google Scholar]
- Soker S., Miao H.Q., Nomi M., Takashima S., Klagsbrun M. VEGF165 mediates formation of complexes containing VEGFR-2 and neuropilin-1 that enhance VEGF165-receptor binding. J. Cell. Biochem. 2002;85:357–368. doi: 10.1002/jcb.10140. [DOI] [PubMed] [Google Scholar]
- Sawano A., Takahashi T., Yamaguchi S., Aonuma M., Shibuya M. Flt-1 but not KDR/Flk-1 tyrosine kinase is a receptor for placenta growth factor, which is related to vascular endothelial growth factor. Cell Growth Differ. 1996;7:213–221. [PubMed] [Google Scholar]
- Shibuya M. Vascular Endothelial Growth Factor (VEGF) and Its Receptor (VEGFR) Signaling in Angiogenesis: A Crucial Target for Anti- and Pro-Angiogenic Therapies. Genes Cancer. 2011;2:1097–1105. doi: 10.1177/1947601911423031. [DOI] [PMC free article] [PubMed] [Google Scholar]
- Papadopoulos N., et al. Binding and neutralization of vascular endothelial growth factor (VEGF) and related ligands by VEGF Trap, ranibizumab and bevacizumab. Angiogenesis. 2012;15:171–185. doi: 10.1007/s10456-011-9249-6. [DOI] [PMC free article] [PubMed] [Google Scholar]
- Finley S.D., Dhar M., Popel A.S. Compartment model predicts VEGF secretion and investigates the effects of VEGF trap in tumor-bearing mice. Front. Oncol. 2013;3:196. doi: 10.3389/fonc.2013.00196. [DOI] [PMC free article] [PubMed] [Google Scholar]
- Stefanini M.O., Wu F.T., Mac Gabhann F., Popel A.S. Increase of plasma VEGF after intravenous administration of bevacizumab is predicted by a pharmacokinetic model. Cancer Res. 2010;70:9886–9894. doi: 10.1158/0008-5472.CAN-10-1419. [DOI] [PMC free article] [PubMed] [Google Scholar]
- Zhang X.Y., Birtwistle M.R., Gallo J.M. A General Network Pharmacodynamic Model-Based Design Pipeline for Customized Cancer Therapy Applied to the VEGFR Pathway. CPT. Pharmacometrics Syst. Pharmacol. 2014;3:e92. doi: 10.1038/psp.2013.65. [DOI] [PMC free article] [PubMed] [Google Scholar]
- Agoram B. Evaluating systems pharmacology models is different from evaluating standard pharmacokinetic-pharmacodynamic models. CPT. Pharmacometrics Syst. Pharmacol. 2014;3:e101. doi: 10.1038/psp.2013.77. [DOI] [PMC free article] [PubMed] [Google Scholar]
- D'Argenio D.Z., Schumitzky A., Wang X. ADAPT 5 User's Guide: Pharmacokinetic/Pharmacodynamic Systems Analysis Software. Biomedical Simulations Resource; Los Angeles; 2009. [Google Scholar]
- Speed B., et al. Pharmacokinetics, distribution, and metabolism of [14C]sunitinib in rats, monkeys, and humans. Drug Metab. Dispos. 2012;40:539–555. doi: 10.1124/dmd.111.042853. [DOI] [PubMed] [Google Scholar]
- Houk B.E., Bello C.L., Kang D., Amantea M. A population pharmacokinetic meta-analysis of sunitinib malate (SU11248) and its primary metabolite (SU12662) in healthy volunteers and oncology patients. Clin. Cancer Res. 2009;15:2497–2506. doi: 10.1158/1078-0432.CCR-08-1893. [DOI] [PubMed] [Google Scholar]
- Mager D.E., Jusko W.J. Pharmacodynamic modeling of time-dependent transduction systems. Clin. Pharmacol. Ther. 2001;70:210–216. doi: 10.1067/mcp.2001.118244. [DOI] [PubMed] [Google Scholar]
- Rocchetti M., et al. Predictive pharmacokinetic-pharmacodynamic modeling of tumor growth after administration of an anti-angiogenic agent, bevacizumab, as single-agent and combination therapy in tumor xenografts. Cancer Chemother. Pharmacol. 2013;71:1147–1157. doi: 10.1007/s00280-013-2107-z. [DOI] [PubMed] [Google Scholar]
- Simeoni M., et al. Predictive pharmacokinetic-pharmacodynamic modeling of tumor growth kinetics in xenograft models after administration of anticancer agents. Cancer Res. 2004;64:1094–1101. doi: 10.1158/0008-5472.can-03-2524. [DOI] [PubMed] [Google Scholar]
- Eisenhauer E.A., et al. New response evaluation criteria in solid tumours: revised RECIST guideline (version 1.1) Eur. J. Cancer. 2009;45:228–247. doi: 10.1016/j.ejca.2008.10.026. [DOI] [PubMed] [Google Scholar]
Associated Data
This section collects any data citations, data availability statements, or supplementary materials included in this article.


