Abstract
We modeled cellular epidermal growth factor receptor (EGFR) tyrosine phosphorylation dynamics in the presence of receptor-targeting kinase inhibitors (e.g., gefitinib) or antibodies (e.g., cetuximab) to identify systematically the factors that contribute most to the ability of the therapeutics to antagonize EGFR phosphorylation, an effect we define here as biochemical efficacy. Our model identifies distinct processes as controlling gefitinib or cetuximab biochemical efficacy, suggests biochemical efficacy is favored in the presence of certain EGFR ligands, and suggests new drug design principles. For example, the model predicts that gefitinib biochemical efficacy is preferentially sensitive to perturbations in the activity of tyrosine phosphatases regulating EGFR, but that cetuximab biochemical efficacy is preferentially sensitive to perturbations in ligand binding. Our results highlight numerous other considerations that determine biochemical efficacy beyond those reflected by equilibrium affinities. By integrating these considerations, our model also predicts minimum therapeutic combination concentrations to maximally reduce receptor phosphorylation.
For various malignancies, small-molecule inhibitors and antibodies that antagonize the function of oncogenic receptor tyrosine kinases are in use or in clinical trials. For the epidermal growth factor receptor (EGFR), ATP analog kinase inhibitors including gefitinib and erlotinib are approved for non–small cell lung carcinoma and pancreatic cancer,1,2 and the ligand-competitive monoclonal antibody cetuximab is approved for head and neck and colorectal cancers.3 While these therapeutics target the same receptor, there may be important determinants of their abilities to antagonize EGFR-initiated signaling beyond the competitive binding processes in which they participate, and those determinants may be unique for different therapeutic classes owing to the different steps of the receptor phosphorylation process at which the therapeutics act. Identifying such determinants may aid in the rational design of next-generation therapeutics targeting EGFR and could provide insight into the differential effectiveness of these therapeutics in vitro and in vivo (e.g., refs. 4,5,6).
Computational modeling represents a useful approach for systematically identifying processes that determine the abilities of therapeutics to antagonize EGFR signal-initiating capacity. Of course, a number of detailed kinetic models of EGFR signaling have been developed with varying levels of complexity (e.g., refs. 7,8,9,10,11). Surprisingly, none of these has been utilized to explore directly the determinants of the ability of different classes of EGFR-targeted therapeutics to interrupt EGFR-initiated signaling. For EGFR and other receptor tyrosine kinases, the well-known model of Cheng and Prusoff12 has also been invoked to make inferences about therapeutic efficacy (e.g., ref. 13), but the simplicity of this model prevents a full analysis of all receptor-level processes that may influence therapeutic effects (e.g., receptor trafficking).
Here, we build upon a previous model of EGFR phosphorylation dynamics to identify systematically the key receptor-level processes that enable gefitinib and cetuximab to antagonize EGFR phosphorylation in the cellular context. We focus on determinants of EGFR phosphorylation since that is the initial step enabling EGFR to generate downstream signaling. We find that the processes that determine biochemical efficacy (defined here as ability to reduce EGFR tyrosine phosphorylation) extend beyond those involved in equilibrium EGFR-therapeutic binding and differ by therapeutic and ligand. For example, gefitinib and cetuximab are predicted to be more effective when EGFR activation is driven by amphiregulin (AR) than by epidermal growth factor (EGF) due to differences in affinity and time scales for receptor occupancy. EGFR tyrosine dephosphorylation rate is predicted to be a preferentially important determinant of gefitinib biochemical efficacy, while ligand binding rate is a preferentially important determinant of cetuximab biochemical efficacy, again due to differences in relevant process time scales. Our model also predicts how gefitinib and cetuximab can be most efficiently combined to reduce receptor phosphorylation maximally but minimize drug concentrations and redundant effects.
Results
Inhibition of receptor phosphorylation by gefitinib or cetuximab
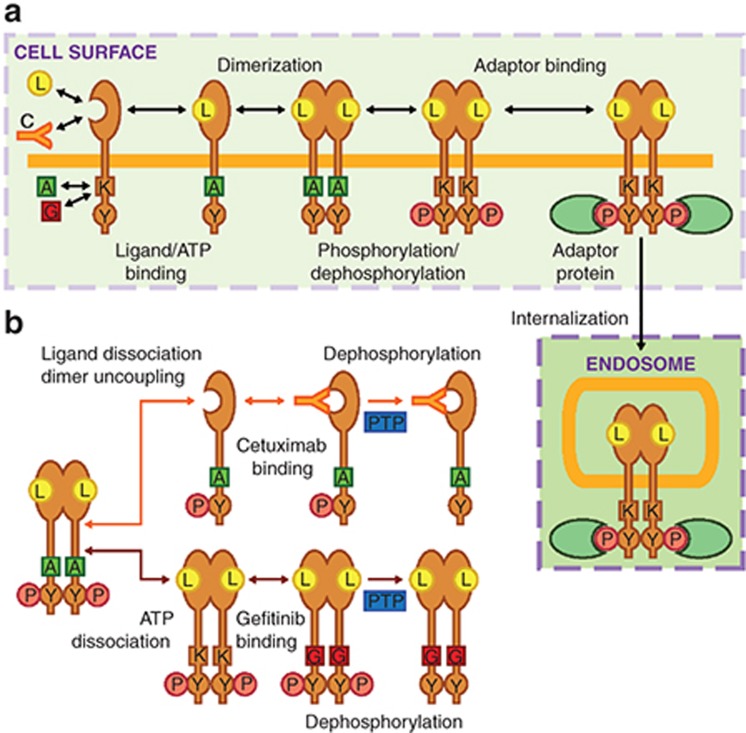
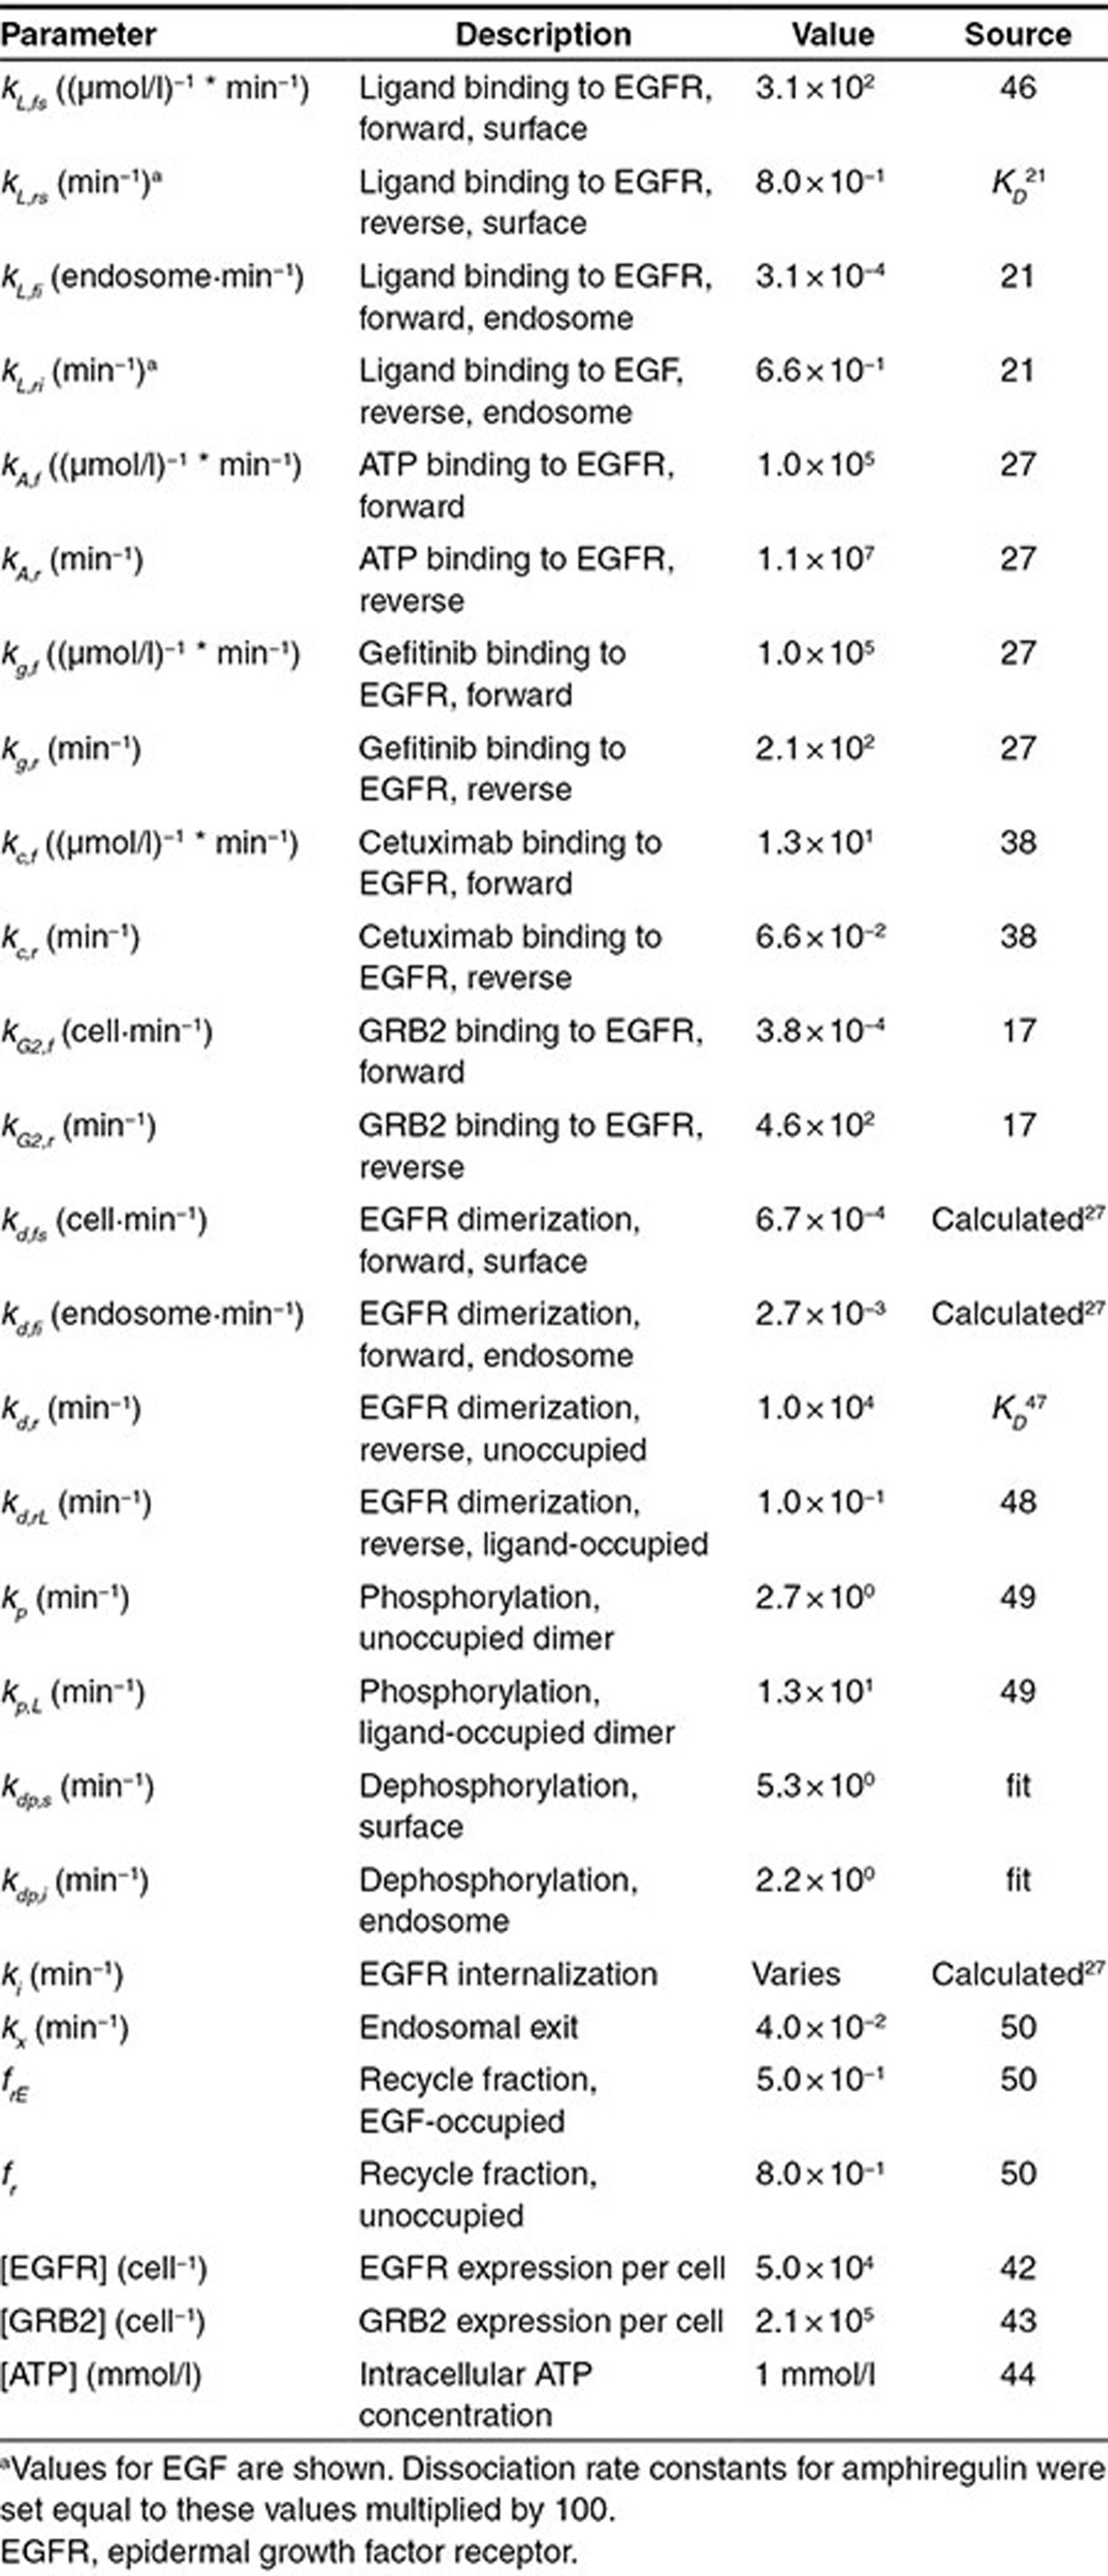
The model considers the rate processes leading to EGFR phosphorylation in cell surface and interior compartments (Figure 1a). See Table 1 for definitions and values of rate parameters. Reversibility of all processes is considered, allowing gefitinib and cetuximab to antagonize EGFR phosphorylation not only for already drug-bound receptors but through other rate processes, such as prolonging the dephosphorylated receptor state after receptors are acted upon by protein tyrosine phosphatases (Figure 1b). Throughout these results, we report therapeutic biochemical efficacy in terms of an IC50, defined as the therapeutic concentration required to reduce steady EGFR phosphorylation to half its value in the absence of therapeutic.
Figure 1.
Model topology of processes leading to epidermal growth factor receptor (EGFR) phosphorylation and therapeutic inhibition of this process. (a) Ligand (L) and cetuximab (C) compete for binding to the EGFR extracellular domain while ATP (A) and gefitinib (G) compete for binding to the EGFR kinase domain (K). Ligand binding promotes EGFR dimerization and ATP-dependent phosphorylation (P) of cytoplasmic tyrosines (Y), enabling receptor binding to intracellular adaptor proteins (e.g., GRB2). EGFR-GRB2 binding permits EGFR internalization. (b) Gefitinib and cetuximab mediate reductions in the phosphorylation of dimerized and phosphorylated EGFR through different mechanisms. ATP dissociation from EGFR allows gefitinib to bind, prolonging the time the receptor remains dephosphorylated after being acted upon by protein tyrosine phosphatases (PTP). Cetuximab can bind phosphorylated receptors once they uncouple from dimers and ligands dissociate, which slows further rounds of ligand binding and dimerization and prolongs the time the receptor remains dephosphorylated after being acted upon by PTPs.
Table 1. Model parameters.
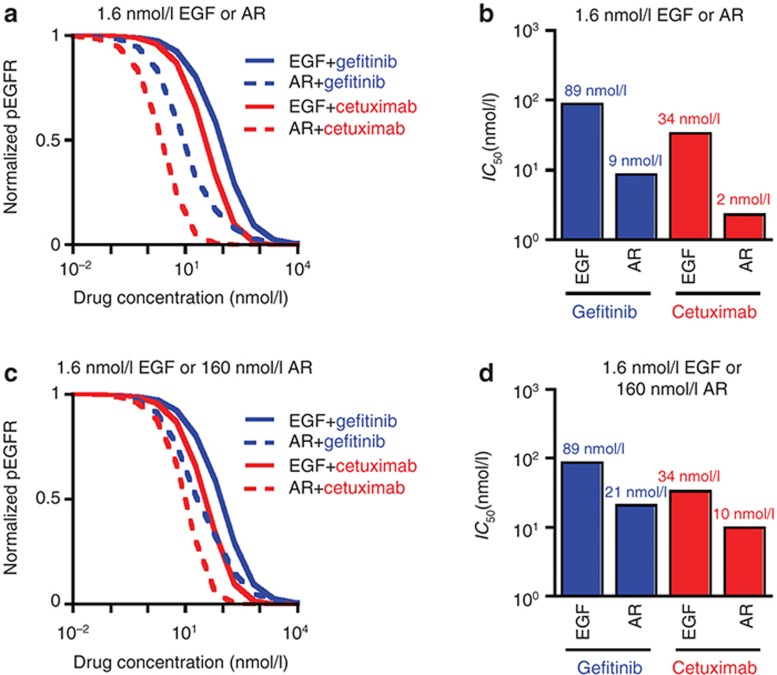
We begin by simulating inhibition curves for 10 ng/ml (1.6 nmol/l) EGF or equimolar AR for all ligand/therapeutic combinations (Figure 2a). For cetuximab and gefitinib, the predicted IC50 in the presence of EGF exceeds that for AR by roughly an order of magnitude (Figure 2b). This occurs, in part, because AR's lower affinity reduces receptor occupancy and the dimerization driving force. For either ligand, the predicted IC50 is larger for gefitinib than cetuximab. This occurs, in part, because the particular combinations of species concentrations and binding kinetics disfavor gefitinib's competition with ATP more than cetuximab's with ligand. Additional factors contribute to these differences, as will be discussed. To account for different ligand affinities, we repeated the analysis for a 100-fold increase in AR concentration (Figure 2c). This reduces, but does not eliminate, predicted IC50 differences (Figure 2d).
Figure 2.
Predicted therapeutic IC50 values. (a) For a range of gefitinib or cetuximab concentrations and 1.6 nmol/l EGF or amphiregulin (AR), the amount of steady-state phosphorylated epidermal growth factor receptor (EGFR) (pEGFR) was computed and normalized to the amount of pEGFR in the absence of therapeutic. (b) From the data shown in panel (a), gefitinib and cetuximab IC50 values were calculated for each ligand/therapeutic pair. (c and d) Calculations in panels (a) and (b) were repeated for 160 nmol/l AR and compared to results for 1.6 nmol/l EGF.
Effect of ligand and therapeutic binding kinetics on predicted IC50 values for gefitinib and cetuximab
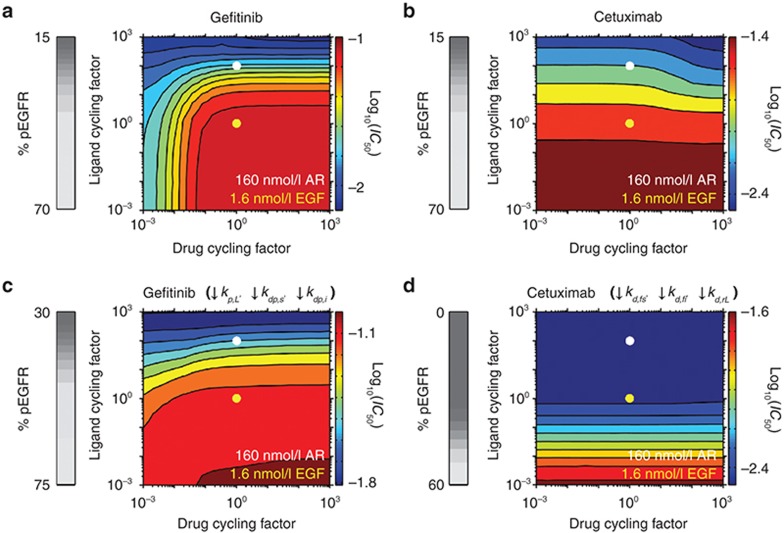
Given that differences in ligand affinity do not fully explain predicted IC50 differences, we performed an analysis assuming constant affinities of ligand (based on EGF) and drug (gefitinib or cetuximab) but varying rate constants for ligand and drug binding and unbinding by an equal “cycling factor” (Figure 3a,b). Faster ligand cycling on and off the receptor generally reduces predicted gefitinib and cetuximab IC50. For example, a 10-fold increase in EGF cycling from base values reduces gefitinib or cetuximab IC50 by ~25 or 40%, respectively. This occurs because of a reduced phosphorylation driving force as the time scale for ligand occupancy becomes similar or small compared to the time scale for ligand-bound receptors to become phosphorylated, as reflected by decreased EGFR phosphorylation in the absence of drugs with increasing ligand cycling (vertical grey scale bars in Figure 3).
Figure 3.
Effects of the rates of cycling of ligand or therapeutic binding and unbinding. Gefitinib and cetuximab IC50 values were calculated for the indicated fold-changes in ligand or drug cycling factor, a constant by which the ligand or drug association and dissociation rate constants are multiplied such that binding/unbinding rates change without altering affinities. Ligand cycling rates corresponding to 1.6 nmol/l epidermal growth factor (EGF) and 160 nmol/l amphiregulin (AR) are indicated by the yellow and white dots, respectively. 160 nmol/l AR is equivalent to 1.6 nmol/l EGF with a ligand cycling factor of 100 because AR is treated as dissociating from EGFR 100 times faster than EGF and the 100-fold greater AR concentration leads to a 100-fold increase in AR's association relative to EGF. The analysis was performed for (a) gefitinib and (b) cetuximab with the base model parameters. (c and d) The simulations in panels (a) and (b) were repeated but with (c) the rate constants for phosphorylation within ligand-bound dimers (kp,L) and dephosphorylation at the cell surface and in the cell interior (kdp,s and kdp,i, respectively) reduced by 100-fold and (d) the rate constants for receptor dimerization at the cell surface and in the cell interior (kd,fs and kd,fi, respectively) and uncoupling of ligand-bound receptor dimers (kd,rL) reduced by 103-fold, respectively. For panels (a–d), the grey scale colorbars at left show the percent of phosphorylated EGFR (pEGFR) in the absence of drug as a function of ligand cycling factor. The log10(IC50), with IC50 in µmol/l units, as a function of ligand and drug cycling factors is shown in colored contour plots, with the color scale shown at right of each contour.
Figure 3a,b also show predicted effects of changing gefitinib or cetuximab cycling. Sufficient decreases in gefitinib cycling reduce gefitinib IC50 (Figure 3a), consistent with the notion that irreversible EGFR kinase inhibitors are more effective than reversible inhibitors.14 This occurs because the receptor is increasingly less likely to rephosphorylate as the time scale with which it remains inhibitor-bound increases. Consistent with this, sensitivity to gefitinib cycling decreases as EGFR cycling through phosphorylated and unphosphorylated states slows (Figure 3c). In contrast, cetuximab's biochemical efficacy is relatively insensitive to changes in cetuximab cycling (Figure 3b) because of competing effects. As cetuximab cycling increases, IC50 tends to decrease because cetuximab binds the receptor more slowly than ligand for the base parameters. That effect is offset, however, because the time scale for cetuximab dissociation from EGFR decreases and approaches that for receptor dephosphorylation as cetuximab cycling increases, which increases IC50. The modest net effect of cetuximab cycling on IC50 can be eliminated by reducing receptor dimerization and uncoupling rates (Figure 3d) because cetuximab binding and dissociation steps are no longer rate limiting in the competitive processes described above that allow cetuximab cycling to influence IC50. Not surprisingly, IC50 values are also reduced by this parameter alteration.
IC50 sensitivity analysis
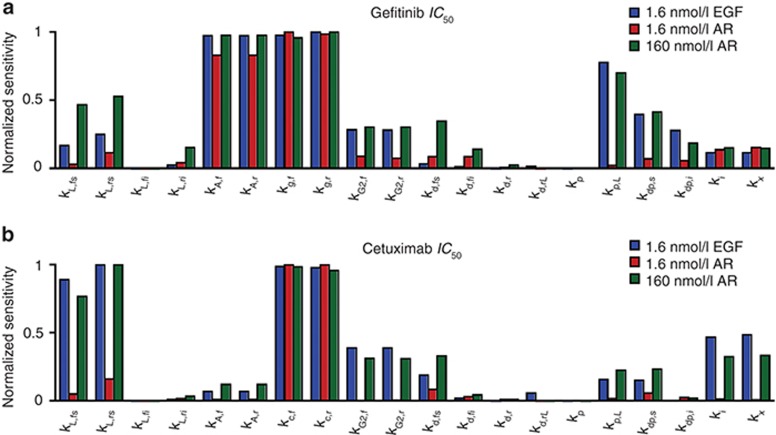
To identify other processes that determine IC50, we performed parameter sensitivity analyses. The predicted gefitinib IC50 in the presence of 1.6 nmol/l EGF is most sensitive to perturbations in parameters for ATP binding (kA,f and kA,r), gefitinib binding (kg,f and kg,r), EGFR phosphorylation (kp,L), and EGFR dephosphorylation (kdp,s and kdp,i) (Figure 4a). Sensitivity to perturbations in ATP and gefitinib binding is anticipated because these parameters control gefitinib/ATP competition. Sensitivity to changes in kdp,s, kdp,I, and kp,L arises because of the importance of receptor dephosphorylation and phosphorylation cycles in setting steady phosphorylation. The gefitinib IC50 in the presence of 1.6 nmol/l AR is sensitive to perturbations in ATP and gefitinib binding but relatively insensitive to perturbations in kp,L, kdp,s, and kdp,i because 1.6 nmol/l AR does not promote substantial dimerization or phosphorylation. For 160 nmol/l AR, the number of dimers present at steady-state increases >20-fold, and the model predicts increased sensitivity to perturbations in parameters for ligand-receptor association and dissociation (kL,fs and kL,rs, respectively), kp,L, kdp,s, and kdp,i.
Figure 4.
Local sensitivity analysis to identify determinants of IC50 for gefitinib and cetuximab. (a and b) Sensitivity of IC50 values to perturbations of 10-fold in each of the model parameters was computed for (a) gefitinib or (b) cetuximab. Sensitivities were reported as the absolute value of the difference in the logarithm of the base IC50 and the perturbed IC50 values and then normalized to the maximum. This analysis was performed for 1.6 nmol/l epidermal growth factor (EGF), 1.6 nmol/l amphiregulin (AR), and 160 nmol/l AR.
For cetuximab, the IC50 in the presence of 1.6 nmol/l EGF 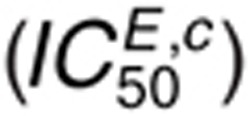 is most sensitive to perturbations in
kL,fs and kL,rs, rate constants for
EGFR-cetuximab binding (kc,f and kc,r),
and rate constants for EGFR internalization and sorting (ki and
kx) (Figure 4b). Competition of
cetuximab with ligand for EGFR binding explains sensitivity to cetuximab and EGF binding parameters.
Sensitivity to ki and kx arises because
cetuximab binds EGFR at the cell surface, and these parameters control EGFR distribution between the
cell surface and interior.
 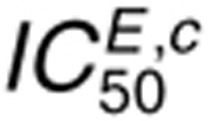 is
insensitive to perturbations in kp,L,
kdp,s, or kdp,i because cetuximab
indirectly disrupts receptor phosphate cycling by preventing receptor monomers from dimerizing.
Relatively slow dephosphorylation is sufficient to reduce receptor phosphorylation in this context.
For 1.6 nmol/l AR
 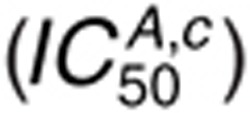 , we observe
sensitivity mainly to the cetuximab binding parameters (Figure
4b), which arises because EGFR occupancy is so low that perturbations in AR binding
constants cannot promote substantial competition with cetuximab.
 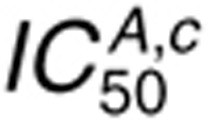 is relatively insensitive to perturbations in
ki and kx because there is little EGFR
internalization for this AR concentration. Increasing AR concentration sensitizes
 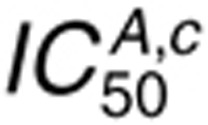 to ligand binding and trafficking
parameters, as binding and endocytosis become more robust with the larger AR concentration
(Figure 4b).
Note that parameter sensitivity results are not shown in Figure 4 for perturbations to EGFR, GRB2, or ATP concentrations because results for those simulations reflect effects already shown through variations in the parameters that control process steps in which those species are involved. For example, the relative importance of changing EGFR expression is reflected by results for perturbations in receptor dimerization parameters.
Kinetics of therapeutic-mediated reductions in EGFR phosphorylation
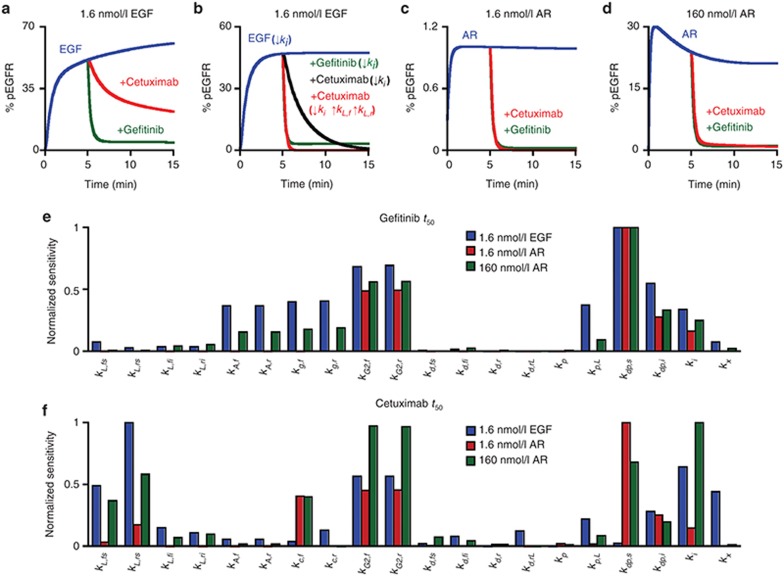
Our results suggest that some differences in gefitinib and cetuximab IC50 determinants arise because the kinetics with which phosphorylated receptors become dephosphorylated (and eventually rephosphorylated) in the presence of drugs influence IC50. This dependence arises because of the small time scales for the many reversible processes considered relative to receptor lifetime, and such effects can be observed in calculations of EGFR phosphorylation response to therapeutics. For example, the relative insensitivity of cetuximab IC50 to dephosphorylation kinetics can be elucidated by considering predicted receptor dephosphorylation kinetics in response to cetuximab versus gefitinib after an initial ligand pulse (Figure 5a). Gefitinib reduces EGFR phosphorylation more rapidly than an equimolar dose of cetuximab, as indicated by time scales for phosphorylated EGFR reductions (t50) of 0.2 and 7.7 min, respectively. These differences arise because cetuximab competes with relatively slow dimer uncoupling and ligand dissociation processes, while gefitinib competes with relatively rapid ATP dissociation. Thus, reducing EGFR internalization, to ensure EGFR access to cetuximab, and increasing ligand cycling, which promotes dimer uncoupling, produces nearly identical gefitinib and cetuximab t50 values (Figure 5b). For 1.6 nmol/l or 160 nmol/l AR, the predicted t50 values are similar for the therapeutics because AR cycles more rapidly than EGF (Figure 5c,d).
Figure 5.
Prediction of and local sensitivity analyses for the time scale with which gefitinib and cetuximab drive epidermal growth factor receptor (EGFR) dephosphorylation. The model was used to predict the percent of phosphorylated EGFR (% pEGFR) observed in response to a 5 min treatment with (a and b) 1.6 nmol/l EGF, (c) 1.6 nmol/l amphiregulin (AR), or (d) 160 nmol/l AR, followed by a chase with 1 μmol/l gefitinib or cetuximab. For (b), the internalization rate constant (ki) was set to zero at t = 0 min for all conditions and the rate constants for ligand-receptor association and dissociation (kL,f and kL,r, respectively) were increased by 100-fold for the cetuximab condition at t = 5 min. (e and f) Sensitivity of t50 values to perturbations of 10-fold in each of the model parameters was computed for (e) gefitinib or (f) cetuximab. Sensitivities were reported as the absolute value of the difference in the logarithm of the base t50 and the perturbed t50 and then normalized to the maximum. Sensitivity analyses were performed for 1.6 nmol/l EGF, 1.6 nmol/l AR, and 160 nmol/l AR and 1 μmol/l therapeutic.
To further identify processes that influence the time scales with which therapeutics reduce
receptor phosphorylation, we performed parameter sensitivity analyses for t50
calculations (Figure 5e,f).
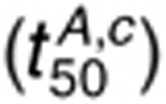
The t50 for 1.6 nmol/l EGF and 1 µmol/l gefitinib 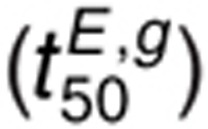 is sensitive to perturbations in
kdp,s and kdp,i,
kp,L, kA,f and
kA,r, kg,f and
kg,r, ki, and parameters for GRB2-EGFR
binding (kG2,f and
kG2,r) (Figure 5e).
Sensitivity to kG2,f,
kG2,r, and ki is observed because
GRB2 binding protects tyrosines from dephosphorylation and because the endosomal compartment is
characterized by different kinetics for processes leading to receptor phosphorylation and
dephosphorylation. The t50 for 1.6 nmol/l AR and 1 µmol/l gefitinib
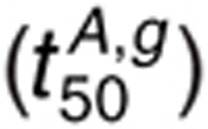 is most sensitive to perturbations
in kdp,s, kdp,i and
kG2,f and kG2,r.
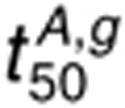 is less sensitive to perturbations
in kp,L than
 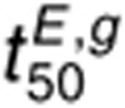 because of a reduced dimerization driving force in the presence of AR. For 160
nmol/l AR,
 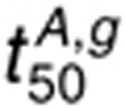 sensitivity to
perturbations in kp,L increases but is still lower than that for 1.6
nmol/l EGF due to rapid AR dissociation.
The t50 for 1.6 nmol/l EGF and 1 µmol/l cetuximab 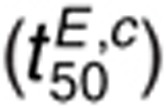 is most sensitive to changes in
kL,fs, kL,rs,
kG2,f, kG2,r,
kdp,i, ki, and
kx (Figure 5f). Compared to
 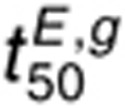 ,
, 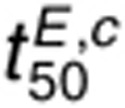 is less sensitive to perturbations in dephosphorylation parameters
and more sensitive to perturbations in ligand binding parameters because ligand dissociation is more
rate-limiting for cetuximab-mediated reductions in EGFR phosphorylation than tyrosine
dephosphorylation. The t50 for 1.6 nmol/l AR and 1 µmol/l cetuximab
 is most sensitive to changes in
kc,f, kG2,f,
kG2,r, kdp,s, and
kdp,i. Since AR-EGFR dissociation is more rapid than EGF-EGFR
dissociation, dephosphorylation is more rate-limiting for cetuximab-mediated reduction in EGFR
phosphorylation in the presence of 1.6 nmol/l AR than 1.6 nmol/l EGF. For 160 nmol/l AR,
 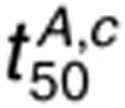 is sensitive to perturbations in ligand
binding parameters, kc,f, GRB2 binding parameters, dephosphorylation
parameters, and ki. Increasing the AR concentration tends to promote
receptor dimerization and phosphorylation, but does not promote receptor internalization as
efficiently as 1.6 nmol/l EGF. Thus,
 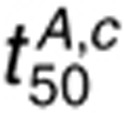 remains sensitive to kdp,s perturbations.
We repeated this analysis for 50 nmol/l gefitinib or cetuximab to explore differences that may arise with drug concentrations at the lower end of those reported in vivo15 (Supplementary Figure S1a,b). Relative sensitivity to perturbations in parameters for binding of therapeutics and binding processes with which therapeutic binding competes were increased at these lower drug concentrations due to the fact that drugs are in greater competition for binding to receptors when drug concentrations are reduced. Many of the other parameter sensitivities that were observed for 1 µmol/l drug concentrations were also observed here.
Predicted effects of gefitinib and cetuximab in combination
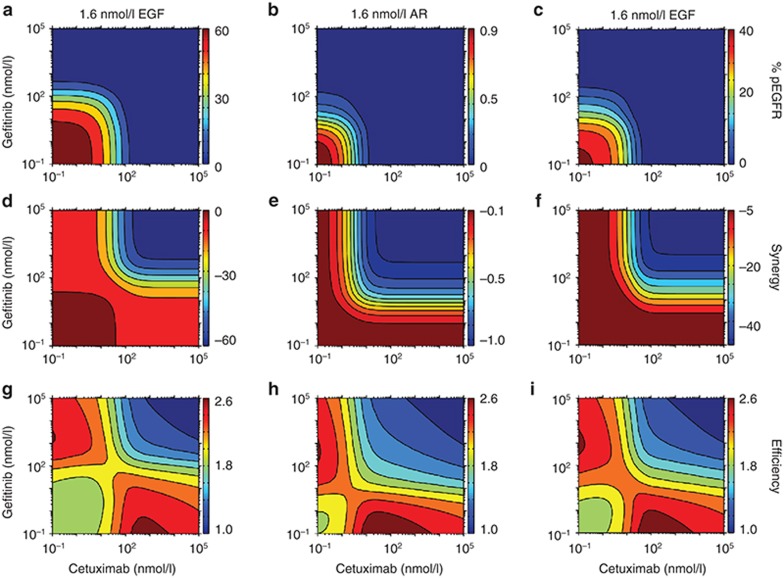
The clinical utility of combining cetuximab with erlotinib is the focus of ongoing clinical trials (e.g., clinicaltrials.gov ID: NCT00397384). Because our analysis highlights how gefitinib and cetuximab antagonize EGFR phosphorylation through different mechanisms, we used the model to predict the effects of combining cetuximab and gefitinib. For a particular cetuximab or gefitinib concentration, the model predicts that addition of the other therapeutic further decreases steady-state EGFR phosphorylation in the presence of EGF or AR (Figure 6a–c). For our model structure, these effects are not synergistic (Figure 6d–f). In fact, negative synergies are predicted for all combinations, resulting from redundant effects that are most apparent at high drug concentrations. The most efficient cotreatments would minimize receptor phosphorylation and redundant effects, while using the lowest drug concentrations to avoid off-target toxicity. With this in mind, we estimated combination efficiency by scaling pEGFR, synergy, and the logarithm of the total drug concentration between 0 and 1 and summing these values for each combination (Figure 6g–i). This calculation provides new perspectives for how to combine cetuximab and gefitinib optimally. For example, consider the effects of increasing gefitinib concentration for a fixed cetuximab concentration at 1.6 nmol/l EGF. Starting from ~8 nmol/l cetuximab and 10−1 nmol/l gefitinib and increasing gefitinib, efficiency initially decreases until a ~20 nmol/l gefitinib because pEGFR levels are not significantly affected until that point. Beyond ~20 nmol/l gefitinib, efficiency increases beyond its starting point as pEGFR decreases. Efficiency eventually decreases again as drug effects become increasingly redundant. Similar effects occur for AR, but with shifts in efficiency values over the concentration space due to AR's differential ability to drive receptor phosphorylation.
Figure 6.
Effects of gefitinib and cetuximab cotreatment. (a–c) The model was used to predict the steady-state percent of phosphorylated epidermal growth factor receptor (pEGFR) as a function of cetuximab and gefitinib concentrations for (a) 1.6 nmol/l EGF, (b) 1.6 nmol/l amphiregulin (AR), or (c) 160 nmol/l AR. (d–f) Synergy, defined as the reduction in receptor phosphorylation resulting from cotreatment minus the reductions in receptor phosphorylation following treatment with each therapeutic alone, was calculated as a function of cetuximab and gefitinib concentrations for the same ligand concentrations as in (a–c). (g–i) To estimate therapeutic efficiency, pEGFR (a–c), synergy (d–f), and the logarithm of the sum of the drug concentrations were scaled to each range between 0 and 1 and then summed for all drug combinations. Based on this definition, therapeutic efficiency is highest for low pEGFR, high synergy, and low amount of drug.
Discussion
Our finding that the abilities of cetuximab and gefitinib to antagonize EGFR phosphorylation are determined by processes beyond those describing equilibrium drug binding motivates new consideration of optimal design strategies for EGFR-targeted therapeutics. To the extent that EGFR phosphorylation level correlates with clinical efficacy, these results also identify possible factors that could underlie the differential effectiveness of the therapeutics among patients. Of course, a number of limitations should be kept in mind in considering the implications of our results. Our analysis implicitly assumes that decreased EGFR phosphorylation will produce more effective therapeutic results. Of course, EGFR transduces signals through numerous pathways, and the integrated effects ultimately determine phenotypic outcomes.16 Given that receptor–adaptor association is required for downstream signaling, however, computing the IC50 for EGFR-GRB2 complex formation may provide additional insight. Interestingly, the relatively rapid kinetics of EGFR-GRB2 binding,17 which may not prevail for all EGFR adaptors, produces EGFR-GRB2 complex sensitivity results that are indistinguishable from those for phosphorylated receptor (Supplementary Figure S2a–d). Of course, our analysis also neglects the potential importance of antibody-mediated cytotoxicity and kinase inhibitor off-target effects. These limitations notwithstanding, a number of novel inferences can be drawn from our results.
Our identification of EGFR dephosphorylation kinetics as a key determinant of therapeutic biochemical efficacy is intriguing given that the activities of protein tyrosine phosphatases that regulate EGFR are altered in certain cancer settings.18 For example, the receptor-like phosphatase protein tyrosine phosphatase receptor-type S (PTPRS) was found deleted in ~25% of head and neck squamous cell carcinomas.19 PTPRS deletion was associated with elevated EGFR phosphorylation in tumor tissues, and PTPRS knockdown augmented resistance to erlotinib in head and neck squamous cell carcinomas cell lines. Interestingly, head and neck squamous cell carcinomas cell lines displaying cetuximab resistance also displayed decreased PTPRS expression. Our model does predict some cetuximab IC50 dependence on EGFR dephosphorylation kinetics, but it also predicts that other factors are stronger determinants of cetuximab's ability to reduce EGFR phosphorylation.
Our results also predict IC50 dependence on the rates of drug and ligand association and dissociation, even for constant affinities. Our prediction that slowing EGFR-gefitinib binding and dissociation cycling decreases IC50 is consistent with the observation that slower erlotinib cycling promotes growth inhibition of lung and brain cancer cells.20 Importantly, Barkovich et al.20 noted that slower erlotinib cycling did not correlate with reduced EGFR phosphorylation, possibly due to the relatively high concentrations of erlotinib required for an effect on cell growth. Our prediction that ligand association and dissociation kinetics affect IC50 suggests that different EGFR ligands, which may bind EGFR with different kinetics,21 may result in different therapeutic IC50 values. Relative mRNA levels of different EGFR ligands generally vary among cells, as in gastric and colon cancer cell lines.22 Thus, variable therapeutic responses among cells or tumors could be partially related to differential ligand expression profiles.
While our model predicts cetuximab IC50 sensitivity to ki perturbations, only modest ki sensitivity is predicted for gefitinib (Figure 4a). This occurs because cetuximab binds EGFR only at the cell surface, while gefitinib is available to EGFR in both cellular compartments. This is interesting to consider in light of findings that increased EGFR internalization, driven by ERK2 amplification, can increase the IC50 for WZ4002, an irreversible EGFR inhibitor, in PC9 cells.23 The basis for this effect remains unknown, but it could result from lower protein tyrosine phosphatase activity against EGFR in the endosomal compartment versus the membrane in PC9 cells. In that scenario, increasing receptor internalization would increase gefitinib IC50. Interestingly, cetuximab resistance correlates with increased EGFR ubiquitination in colorectal cancer cells generated through prolonged cetuximab exposure,24 which could also be related to EGFR internalization effects.25 Other studies have linked impaired EGFR internalization with cetuximab resistance.26 Such inconsistencies may occur because endocytosis perturbations can arise for a variety of reasons, with varied consequences for downstream signaling.
Methods
Model topology
A kinetic model of EGFR phosphorylation at a representative tyrosine was implemented using a framework similar to one previously described,27 but with several alterations. The updated model includes kinetics for cetuximab binding to EGFR's extracellular domain and for intracellular GRB2 binding to the phosphorylated receptor, and assumes that GRB2-bound receptors internalize at experimentally measured rates for EGFR endocytosis.27 Note that data for EGFR Y1068 dynamics are used for model training (described below), and that EGFR Y1068 is the primary GRB2 binding site in the EGFR cytoplasmic tail.28 The model considers cell surface and interior compartments (Figure 1a), with the interior (endosomal) volume modeled as before.27 In each compartment, EGFR monomers reversibly bind ligands and ATP and homodimerize. Ligands and ATP also reversibly bind receptor dimers. Dimerized, ATP-bound receptors undergo phosphorylation characterized by rate constants kp or kp,L, depending on receptor-ligand occupancy. In the surface compartment, phosphorylated receptors are dephosphorylated or bind GRB2, which plays a general adaptor role because of its signaling and endocytosis functions.29,30 GRB2-bound receptors in the surface compartment irreversibly move to the endosome.29 Dephosphorylation at the cell surface and in the cell interior are characterized by parameters kdp,s and kdp,i, respectively. Rules for model reactions are further explained in Supplementary Materials. Model parameters are provided in Table 1.
Asymmetric receptor dimers
In our previous model,27 only symmetric receptor dimerizations were permitted (e.g., a ligand-bound EGFR could only dimerize with another ligand-bound EGFR) to limit model combinatorial complexity. In the updated model, we allowed for asymmetric dimerization with respect to ligand occupancy to reflect an updated structural understanding of dimers.31
EGFR-therapeutic binding
Gefitinib is assumed to compete with ATP regardless of EGFR localization. The model assumes that cetuximab binds only surface-localized non-ligand-bound EGFR monomers.3 Cetuximab is modeled as a monovalent binder of EGFR to focus on a more straightforward comparison between drugs that compete with single ligand or ATP binding events in the extracellular or intracellular compartments, respectively, but the slightly enhanced binding affinity observed for the bivalent full-length antibody32 was used in model parameterization. Note that monovalent cetuximab fragments potently reduce EGFR phosphorylation in cultured cells.32 Cetuximab-bound species are permitted to internalize, but cetuximab dissociation is not permitted in the endosome by considering numerical issues. Given that EGFR–cetuximab dissociation and endosomal exit rate constants are of similar magnitude (Table 1), this assumption should not significantly affect model predictions.
The model allows cetuximab and gefitinib to antagonize phosphorylation through processes beyond the static sequestration of EGFR from entering the overall path leading to phosphorylation. For example, cetuximab can bind to phosphorylated receptors generated through uncoupling of phosphorylated dimers and dissociation of ligand (Figure 1b), preventing receptors from re-dimerizing and -phosphorylating after dephosphorylation. Similarly, gefitinib can bind phosphorylated receptors after ADP dissociation, antagonizing further rounds of phosphorylation (Figure 1b).
EGFR ligands
EGF binding constants were based on experimental measurements.21,33 AR was assumed to dissociate from EGFR 100 times faster than EGF, based on studies suggesting that AR has a larger dissociation constant (KD),34 is 50–300 times less potent in cell growth assays,35 and less efficiently promotes EGFR phosphorylation, CBL association, and ubiquitination.36 Ligand binding affinities were assumed in the endosome due to the known effects of reduced pH in that compartment.21 With the differences in ligand binding kinetics for EGF and AR, our model recapitulates published experimental findings that AR is much less efficient than EGF in promoting EGFR endocytosis,37 with model-predicted specific rate constants for receptor endocytosis of 0.01 or 0.13 min−1 for 1.6 nmol/l AR or EGF, respectively.
Comparing therapeutics
For fixed concentration comparisons, we assumed 1 μmol/l or 50 nmol/l for gefitinib and cetuximab. 1 μmol/l significantly exceeds the binding constant of either therapeutic with EGFR (2.1 nmol/l for gefitinib and 5.2 nmol/l for cetuximab)1,38 and is consistent with some reports of achievable therapeutic concentrations in vivo.39,40 50 nmol/l concentrations were used in some calculations to span the range of concentrations reported in vivo.15
Inhibition curves and IC50 calculations
We defined IC50 as the therapeutic concentration at which steady EGFR phosphorylation was reduced to half its value in the absence of therapeutic, a definition used in other studies (e.g., ref. 41). Inhibition curves were simulated by computing steady EGFR phosphorylation in the presence of ligand over a range of therapeutic concentrations. In making these calculations, we lumped all phosphorylated receptors regardless of binding partners or localization. EGFR degradation and synthesis were not considered due to the computationally intensive algorithm needed to determine the synthesis rate with the specific model structure implemented here.27
Pulse-chase curves and t50 calculation
To quantify the rate with which therapeutics reduce EGFR phosphorylation, we simulated 5 min treatments of cells with ligands followed by 1 μmol/l or 50 nmol/l therapeutic chases. t50 is defined as the time required for 50% of the maximum possible reduction in EGFR phosphorylation. For these calculations, EGFR degradation was not permitted in order to reach a steady state.
Sensitivity analysis
To quantify the relative importance of receptor-level processes in determining IC50 and t50, we computed sensitivities to model parameter perturbations. Sensitivity was defined as the absolute value of the difference in the logarithm of IC50 or t50 values between the perturbed and base parameter values, summed over all perturbations with parameters perturbed by 10- or 0.1-fold.
Model training
To capture realistic EGFR dephosphorylation kinetics, we fit kdp,s and kdp,i using our published data for EGFR Y1068 phosphorylation response to EGF, pervanadate, and gefitinib (Supplementary Figure S3a–c), as previously described.27 Twenty fits were run, with small variations among results. The kdp,s and kdp,i values producing the lowest residual were chosen (Table 1). These values were slightly increased compared to those in our previous study,27 due to the updated model's consideration of GRB2 binding to EGFR, which protects EGFR phosphotyrosines from dephosphorylation.
Representative cell
Cells were assumed to express 5.0 × 10⁴ EGFR42 and 2.1 × 10⁵ GRB2.43 ATP concentration was assumed to be 1 mmol/l.44 EGFR internalization was assumed to be consistent with a specific endocytosis rate constant of 0.13 min−1,45 using an algorithm described previously.27
Author Contributions.
C.S.M. and M.J.L. designed the research, analyzed the data, and wrote the manuscript. C.S.M. performed the research.
Conflicts of Interest.
The authors declared no conflicts of interest.
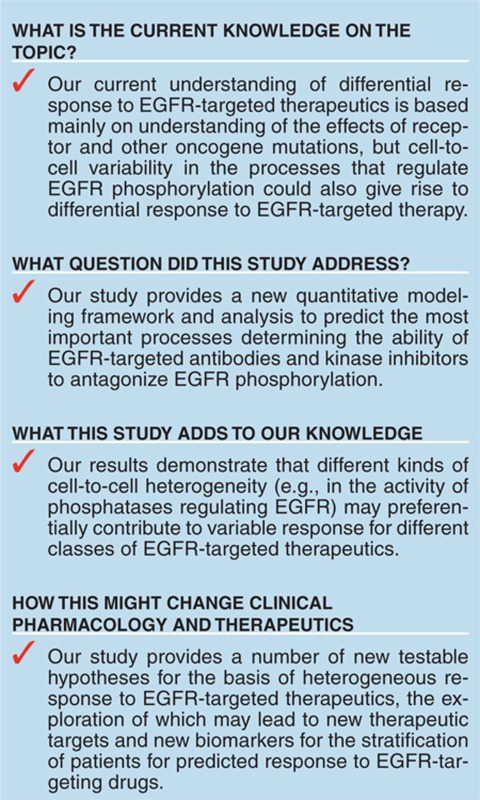
Study Highlights
Acknowledgments
This work was supported in part by grant IRG-78-002-30 from the American Cancer Society and by funding to M.J.L. from the University of Pennsylvania. We also thank Janine Buonato for review of the manuscript.
Supplementary Material
References
- Wakeling A.E., et al. ZD1839 (Iressa): an orally active inhibitor of epidermal growth factor signaling with potential for cancer therapy. Cancer Res. 2002;62:5749–5754. [PubMed] [Google Scholar]
- Pollack V.A., et al. Inhibition of epidermal growth factor receptor-associated tyrosine phosphorylation in human carcinomas with CP-358,774: dynamics of receptor inhibition in situ and antitumor effects in athymic mice. J. Pharmacol. Exp. Ther. 1999;291:739–748. [PubMed] [Google Scholar]
- Li S., Schmitz K.R., Jeffrey P.D., Wiltzius J.J., Kussie P., Ferguson K.M. Structural basis for inhibition of the epidermal growth factor receptor by cetuximab. Cancer Cell. 2005;7:301–311. doi: 10.1016/j.ccr.2005.03.003. [DOI] [PubMed] [Google Scholar]
- Kobayashi T., et al. A phase II trial of erlotinib in patients with EGFR wild-type advanced non-small-cell lung cancer. Cancer Chemother. Pharmacol. 2012;69:1241–1246. doi: 10.1007/s00280-012-1831-0. [DOI] [PubMed] [Google Scholar]
- Lu Y., Liang K., Li X., Fan Z. Responses of cancer cells with wild-type or tyrosine kinase domain-mutated epidermal growth factor receptor (EGFR) to EGFR-targeted therapy are linked to downregulation of hypoxia-inducible factor-1alpha. Mol. Cancer. 2007;6:63. doi: 10.1186/1476-4598-6-63. [DOI] [PMC free article] [PubMed] [Google Scholar]
- Van Schaeybroeck S., et al. Chemotherapy-induced epidermal growth factor receptor activation determines response to combined gefitinib/chemotherapy treatment in non-small cell lung cancer cells. Mol. Cancer Ther. 2006;5:1154–1165. doi: 10.1158/1535-7163.MCT-05-0446. [DOI] [PubMed] [Google Scholar]
- Hendriks B.S., et al. Decreased internalisation of erbB1 mutants in lung cancer is linked with a mechanism conferring sensitivity to gefitinib. Syst. Biol. (Stevenage) 2006;153:457–466. doi: 10.1049/ip-syb:20050108. [DOI] [PubMed] [Google Scholar]
- Araujo R.P., Petricoin E.F., Liotta L.A. A mathematical model of combination therapy using the EGFR signaling network. Biosystems. 2005;80:57–69. doi: 10.1016/j.biosystems.2004.10.002. [DOI] [PubMed] [Google Scholar]
- Lange F., Rateitschak K., Kossow C., Wolkenhauer O., Jaster R. Insights into erlotinib action in pancreatic cancer cells using a combined experimental and mathematical approach. World J. Gastroenterol. 2012;18:6226–6234. doi: 10.3748/wjg.v18.i43.6226. [DOI] [PMC free article] [PubMed] [Google Scholar]
- Naruo Y., et al. Epidermal growth factor receptor mutation in combination with expression of MIG6 alters gefitinib sensitivity. BMC Syst. Biol. 2011;5:29. doi: 10.1186/1752-0509-5-29. [DOI] [PMC free article] [PubMed] [Google Scholar]
- Purvis J., Ilango V., Radhakrishnan R. Role of network branching in eliciting differential short-term signaling responses in the hypersensitive epidermal growth factor receptor mutants implicated in lung cancer. Biotechnol. Prog. 2008;24:540–553. doi: 10.1021/bp070405o. [DOI] [PMC free article] [PubMed] [Google Scholar]
- Cheng Y., Prusoff W.H. Relationship between the inhibition constant (K1) and the concentration of inhibitor which causes 50 per cent inhibition (I50) of an enzymatic reaction. Biochem. Pharmacol. 1973;22:3099–3108. doi: 10.1016/0006-2952(73)90196-2. [DOI] [PubMed] [Google Scholar]
- Knight Z.A., Shokat K.M. Features of selective kinase inhibitors. Chem. Biol. 2005;12:621–637. doi: 10.1016/j.chembiol.2005.04.011. [DOI] [PubMed] [Google Scholar]
- Ercan D., et al. Amplification of EGFR T790M causes resistance to an irreversible EGFR inhibitor. Oncogene. 2010;29:2346–2356. doi: 10.1038/onc.2009.526. [DOI] [PMC free article] [PubMed] [Google Scholar]
- Nakagawa K., et al. Phase I pharmacokinetic trial of the selective oral epidermal growth factor receptor tyrosine kinase inhibitor gefitinib (‘Iressa', ZD1839) in Japanese patients with solid malignant tumors. Ann. Oncol. 2003;14:922–930. doi: 10.1093/annonc/mdg250. [DOI] [PubMed] [Google Scholar]
- Lazzara M.J., Lauffenburger D.A. Quantitative modeling perspectives on the ErbB system of cell regulatory processes. Exp. Cell Res. 2009;315:717–725. doi: 10.1016/j.yexcr.2008.10.033. [DOI] [PubMed] [Google Scholar]
- Morimatsu M., Takagi H., Ota K.G., Iwamoto R., Yanagida T., Sako Y. Multiple-state reactions between the epidermal growth factor receptor and Grb2 as observed by using single-molecule analysis. Proc. Natl. Acad. Sci. USA. 2007;104:18013–18018. doi: 10.1073/pnas.0701330104. [DOI] [PMC free article] [PubMed] [Google Scholar]
- Julien S.G., Dubé N., Hardy S., Tremblay M.L. Inside the human cancer tyrosine phosphatome. Nat. Rev. Cancer. 2011;11:35–49. doi: 10.1038/nrc2980. [DOI] [PubMed] [Google Scholar]
- Morris L.G., et al. Genomic dissection of the epidermal growth factor receptor (EGFR)/PI3K pathway reveals frequent deletion of the EGFR phosphatase PTPRS in head and neck cancers. Proc. Natl. Acad. Sci. USA. 2011;108:19024–19029. doi: 10.1073/pnas.1111963108. [DOI] [PMC free article] [PubMed] [Google Scholar]
- Barkovich K.J., et al. Kinetics of inhibitor cycling underlie therapeutic disparities between EGFR-driven lung and brain cancers. Cancer Discov. 2012;2:450–457. doi: 10.1158/2159-8290.CD-11-0287. [DOI] [PMC free article] [PubMed] [Google Scholar]
- French A.R., Tadaki D.K., Niyogi S.K., Lauffenburger D.A. Intracellular trafficking of epidermal growth factor family ligands is directly influenced by the pH sensitivity of the receptor/ligand interaction. J. Biol. Chem. 1995;270:4334–4340. doi: 10.1074/jbc.270.9.4334. [DOI] [PubMed] [Google Scholar]
- Wu W.K., Tse T.T., Sung J.J., Li Z.J., Yu L., Cho C.H. Expression of ErbB receptors and their cognate ligands in gastric and colon cancer cell lines. Anticancer Res. 2009;29:229–234. [PubMed] [Google Scholar]
- Ercan D., et al. Reactivation of ERK signaling causes resistance to EGFR kinase inhibitors. Cancer Discov. 2012;2:934–947. doi: 10.1158/2159-8290.CD-12-0103. [DOI] [PMC free article] [PubMed] [Google Scholar]
- Lu Y., et al. Epidermal growth factor receptor (EGFR) ubiquitination as a mechanism of acquired resistance escaping treatment by the anti-EGFR monoclonal antibody cetuximab. Cancer Res. 2007;67:8240–8247. doi: 10.1158/0008-5472.CAN-07-0589. [DOI] [PubMed] [Google Scholar]
- Madshus I.H., Stang E. Internalization and intracellular sorting of the EGF receptor: a model for understanding the mechanisms of receptor trafficking. J. Cell Sci. 2009;122:3433–3439. doi: 10.1242/jcs.050260. [DOI] [PubMed] [Google Scholar]
- Wheeler D.L., et al. Mechanisms of acquired resistance to cetuximab: role of HER (ErbB) family members. Oncogene. 2008;27:3944–3956. doi: 10.1038/onc.2008.19. [DOI] [PMC free article] [PubMed] [Google Scholar]
- Monast C.S., Furcht C.M., Lazzara M.J. Computational analysis of the regulation of EGFR by protein tyrosine phosphatases. Biophys. J. 2012;102:2012–2021. doi: 10.1016/j.bpj.2012.03.037. [DOI] [PMC free article] [PubMed] [Google Scholar]
- Batzer A.G., Rotin D., Ureña J.M., Skolnik E.Y., Schlessinger J. Hierarchy of binding sites for Grb2 and Shc on the epidermal growth factor receptor. Mol. Cell. Biol. 1994;14:5192–5201. doi: 10.1128/mcb.14.8.5192. [DOI] [PMC free article] [PubMed] [Google Scholar]
- Jiang X., Huang F., Marusyk A., Sorkin A. Grb2 regulates internalization of EGF receptors through clathrin-coated pits. Mol. Biol. Cell. 2003;14:858–870. doi: 10.1091/mbc.E02-08-0532. [DOI] [PMC free article] [PubMed] [Google Scholar]
- Gale N.W., Kaplan S., Lowenstein E.J., Schlessinger J., Bar-Sagi D. Grb2 mediates the EGF-dependent activation of guanine nucleotide exchange on Ras. Nature. 1993;363:88–92. doi: 10.1038/363088a0. [DOI] [PubMed] [Google Scholar]
- Liu P., Cleveland T.E., 4th, Bouyain S., Byrne P.O., Longo P.A., Leahy D.J. A single ligand is sufficient to activate EGFR dimers. Proc. Natl. Acad. Sci. USA. 2012;109:10861–10866. doi: 10.1073/pnas.1201114109. [DOI] [PMC free article] [PubMed] [Google Scholar]
- Fan Z., Masui H., Altas I., Mendelsohn J. Blockade of epidermal growth factor receptor function by bivalent and monovalent fragments of 225 anti-epidermal growth factor receptor monoclonal antibodies. Cancer Res. 1993;53:4322–4328. [PubMed] [Google Scholar]
- Waters C.M., Overholser K.A., Sorkin A., Carpenter G. Analysis of the influences of the E5 transforming protein on kinetic parameters of epidermal growth factor binding and metabolism. J. Cell. Physiol. 1992;152:253–263. doi: 10.1002/jcp.1041520206. [DOI] [PubMed] [Google Scholar]
- Shoyab M., Plowman G.D., McDonald V.L., Bradley J.G., Todaro G.J. Structure and function of human amphiregulin: a member of the epidermal growth factor family. Science. 1989;243:1074–1076. doi: 10.1126/science.2466334. [DOI] [PubMed] [Google Scholar]
- Adam R., et al. Modulation of the receptor binding affinity of amphiregulin by modification of its carboxyl terminal tail. Biochim. Biophys. Acta. 1995;1266:83–90. doi: 10.1016/0167-4889(94)00224-3. [DOI] [PubMed] [Google Scholar]
- Stern K.A., Place T.L., Lill N.L. EGF and amphiregulin differentially regulate Cbl recruitment to endosomes and EGF receptor fate. Biochem. J. 2008;410:585–594. doi: 10.1042/BJ20071505. [DOI] [PMC free article] [PubMed] [Google Scholar]
- Roepstorff K., et al. Differential effects of EGFR ligands on endocytic sorting of the receptor. Traffic. 2009;10:1115–1127. doi: 10.1111/j.1600-0854.2009.00943.x. [DOI] [PMC free article] [PubMed] [Google Scholar]
- Patel D., et al. Monoclonal antibody cetuximab binds to and down-regulates constitutively activated epidermal growth factor receptor vIII on the cell surface. Anticancer Res. 2007;27:3355–3366. [PubMed] [Google Scholar]
- Albanell J., et al. Pharmacodynamic studies of the epidermal growth factor receptor inhibitor ZD1839 in skin from cancer patients: histopathologic and molecular consequences of receptor inhibition. J. Clin. Oncol. 2002;20:110–124. doi: 10.1200/JCO.2002.20.1.110. [DOI] [PubMed] [Google Scholar]
- Mukohara T., et al. Differential effects of gefitinib and cetuximab on non-small-cell lung cancers bearing epidermal growth factor receptor mutations. J. Natl. Cancer Inst. 2005;97:1185–1194. doi: 10.1093/jnci/dji238. [DOI] [PubMed] [Google Scholar]
- Pedersen M.W., Pedersen N., Ottesen L.H., Poulsen H.S. Differential response to gefitinib of cells expressing normal EGFR and the mutant EGFRvIII. Br. J. Cancer. 2005;93:915–923. doi: 10.1038/sj.bjc.6602793. [DOI] [PMC free article] [PubMed] [Google Scholar]
- Berkers J.A., van Bergen en Henegouwen P.M., Boonstra J. Three classes of epidermal growth factor receptors on HeLa cells. J. Biol. Chem. 1991;266:922–927. [PubMed] [Google Scholar]
- Kholodenko B.N., Demin O.V., Moehren G., Hoek J.B. Quantification of short term signaling by the epidermal growth factor receptor. J. Biol. Chem. 1999;274:30169–30181. doi: 10.1074/jbc.274.42.30169. [DOI] [PubMed] [Google Scholar]
- Zamaraeva M.V., Sabirov R.Z., Maeno E., Ando-Akatsuka Y., Bessonova S.V., Okada Y. Cells die with increased cytosolic ATP during apoptosis: a bioluminescence study with intracellular luciferase. Cell Death Differ. 2005;12:1390–1397. doi: 10.1038/sj.cdd.4401661. [DOI] [PubMed] [Google Scholar]
- Lazzara M.J., et al. Impaired SHP2-mediated extracellular signal-regulated kinase activation contributes to gefitinib sensitivity of lung cancer cells with epidermal growth factor receptor-activating mutations. Cancer Res. 2010;70:3843–3850. doi: 10.1158/0008-5472.CAN-09-3421. [DOI] [PMC free article] [PubMed] [Google Scholar]
- Myers A.C., Kovach J.S., Vuk-Pavlović S. Binding, internalization, and intracellular processing of protein ligands. Derivation of rate constants by computer modeling. J. Biol. Chem. 1987;262:6494–6499. [PubMed] [Google Scholar]
- Shan Y., et al. Oncogenic mutations counteract intrinsic disorder in the EGFR kinase and promote receptor dimerization. Cell. 2012;149:860–870. doi: 10.1016/j.cell.2012.02.063. [DOI] [PubMed] [Google Scholar]
- Hendriks B.S., Opresko L.K., Wiley H.S., Lauffenburger D. Quantitative analysis of HER2-mediated effects on HER2 and epidermal growth factor receptor endocytosis: distribution of homo- and heterodimers depends on relative HER2 levels. J. Biol. Chem. 2003;278:23343–23351. doi: 10.1074/jbc.M300477200. [DOI] [PubMed] [Google Scholar]
- Fan Y.X., Wong L., Deb T.B., Johnson G.R. Ligand regulates epidermal growth factor receptor kinase specificity: activation increases preference for GAB1 and SHC versus autophosphorylation sites. J. Biol. Chem. 2004;279:38143–38150. doi: 10.1074/jbc.M405760200. [DOI] [PubMed] [Google Scholar]
- Hendriks B.S., Opresko L.K., Wiley H.S., Lauffenburger D. Coregulation of epidermal growth factor receptor/human epidermal growth factor receptor 2 (HER2) levels and locations: quantitative analysis of HER2 overexpression effects. Cancer Res. 2003;63:1130–1137. [PubMed] [Google Scholar]
Associated Data
This section collects any data citations, data availability statements, or supplementary materials included in this article.


