

Abstract
Systemic lupus erythematosus (SLE) is an autoimmune disease with multi-organ involvement and results in neurological and psychiatric (NP) symptoms in up to 40% of the patients. To date, the diagnosis of neuropsychiatric systemic lupus erythematosus (NPSLE) poses a challenge due to the lack of neuroradiological gold standards. In this study, we aimed to better localize and characterize normal appearing white matter (NAWM) changes in NPSLE by combining data from two quantitative MRI techniques, diffusion tensor imaging (DTI) and magnetization transfer imaging (MTI). 9 active NPSLE patients (37 ± 13 years, all females), 9 SLE patients without NP symptoms (44 ± 11 years, all females), and 14 healthy controls (HC) (40 ± 9 years, all females) were included in the study. MTI, DTI and fluid attenuated inversion recovery (FLAIR) images were collected from all subjects on a 3 T MRI scanner. Magnetization transfer ratio (MTR), mean diffusivity (MD), fractional anisotropy (FA), radial diffusivity (RD), axial diffusivity (AD) maps and white matter lesion maps based on the FLAIR images were created for each subject. MTR and DTI data were then co-analyzed using tract-based spatial statistics and a cumulative lesion map to exclude lesions. Significantly lower MTR and FA and significantly higher AD, RD and MD were found in NPSLE compared to HC in NAWM regions. The differences in DTI measures and in MTR, however, were only moderately co-localized. Additionally, significant differences in DTI measures, but not in MTR, were found between NPSLE and SLE patients, suggesting that the underlying microstructural changes detected by MD are linked to the onset of NPSLE. The co-analysis of the anatomical distribution of MTI and DTI measures can potentially improve the diagnosis of NPSLE and contribute to the understanding of the underlying microstructural damage.
Abbreviations: ACR, American College of Rheumatology; AD, axial diffusivity; DTI, diffusion tensor imaging; FA, fractional anisotropy; FLAIR, fluid attenuated inversion recovery; HC, healthy controls; MD, mean diffusivity; MTI, magnetization transfer imaging; MTR, magnetization transfer ratio; NAWM, normal appearing white matter; NP, neurological and psychiatric; NPSLE, neuropsychiatric systemic lupus erythematosus; RD, radial diffusivity; SLE, systemic lupus erythematosus; TBSS, tract based spatial statistics; WM, white matter; WMH, white matter hyperintensities
Keywords: Systemic lupus erythematosus, Neuropsychiatric systemic lupus erythematosus, Magnetic resonance imaging, Diffusion tensor imaging, Magnetization transfer imaging, Normal appearing white matter
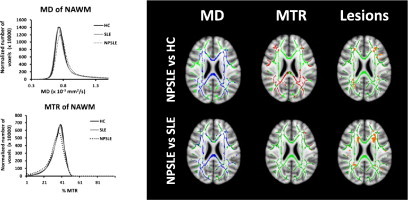
Graphical abstract
Highlights
-
•
NAWM is investigated in NPSLE and SLE using MTI and DTI.
-
•
Differences in DTI and MTR between NPSLE and HC are widespread but only moderately co-localized.
-
•
Significant differences in MD between SLE and NPSLE suggest link to onset of NPSLE.
1. Introduction
Systemic lupus erythematosus (SLE) is a relapsing–remitting female-predominant autoimmune disease affecting multiple organs (Stojanovich et al., 2007; Kozora and Filley, 2011; Lauvsnes and Omdal, 2012; Jeltsch-David and Muller, 2014). Neuropsychiatric (NP) events are common in SLE but only in 40% of these cases the symptoms can be directly attributed to SLE (Castellino et al., 2008; Bertsias and Boumpas, 2010; Kozora and Filley, 2011). SLE-associated NP syndromes are very heterogeneous, ranging from mild symptoms, such as headaches and mood disorders, to severe NP syndromes, such as seizures, and psychosis (Appenzeller et al., 2007; Bertsias and Boumpas, 2010; Kozora and Filley, 2011; Lauvsnes and Omdal, 2012). The presentation of NP complaints in a patient with SLE continues to pose a diagnostic challenge to practicing physicians, mainly due to the absence of adequate diagnostic tests for NPSLE, resulting in an inconclusive diagnosis in a significant number of cases (Welsh et al., 2007; Appenzeller et al., 2008a; Bertsias and Boumpas, 2010).
Magnetic resonance imaging (MRI) has emerged as a promising technique to study NPSLE, as T2-weighted and fluid-attenuated inversion recovery (FLAIR) scans have revealed focal hyperintense lesions, which are present in deep, periventricular and subcortical white matter (WM) in up to 70% of NPSLE patients (Appenzeller et al., 2008a; Appenzeller et al., 2008b; Castellino et al., 2008; Kozora and Filley, 2011; Luyendijk et al., 2011). Although they are common among NPSLE patients, these white matter hyperintensities (WMH) are non-specific and can be found in a variety of groups of SLE patients, including those with active NPSLE (SLE patients with active NP symptoms), SLE patients with NP episodes in their past (inactive NPSLE), and SLE patients with no NP symptoms as well as in many other conditions unrelated to SLE, such as aging, multiple sclerosis, and cerebral small vessel disease (Luyendijk et al., 2011). Recent studies also showed that 42–47% of the patients with NPSLE do not have any visible MRI abnormalities, suggesting that the link between FLAIR abnormalities and the etiology of NPSLE is tenuous (Luyendijk et al., 2011; Steup-Beekman et al., 2013).
Quantitative MRI techniques such as diffusion weighted imaging (DWI), diffusion tensor imaging (DTI) and magnetization transfer imaging (MTI) have been shown to be sensitive to diffuse alterations in the brain of NPSLE patients, and can be evaluated by quantitative maps of, e.g. mean diffusivity (MD) and fractional anisotropy (FA) of DTI, or other methods, such as histograms of these quantities and of magnetization transfer ratio (MTR) (Bosma et al., 2000b; Bosma et al., 2003; Emmer et al., 2006; Hughes et al., 2007; Welsh et al., 2007; Zhang et al., 2007; Emmer et al., 2010; Jung et al., 2010; Schmidt-Wilcke et al., 2014). Previous MTI studies of NPSLE patients showed lower peak heights in both whole brain and tissue specific MTR histograms compared to healthy controls (HC), suggesting either demyelination or an increase in free water resulting from cytotoxic or vasogenic edema (Bosma et al., 2000b; Emmer et al., 2006). These alterations were also shown to correlate with reversible changes in outcome of patients with active symptoms (Bosma et al., 2000a). In a separate DTI study that used tract based spatial statistics (TBSS), higher MD and lower FA in WM were reported for NPSLE patients compared to HC, also suggesting a diffuse microstructural basis for the NP symptoms (Emmer et al., 2010).
Although MRI is sensitive to changes associated with NPSLE, no single technique is shown to be specific enough to serve as a diagnostic tool for both the diffuse and focal changes in the brain. A few studies have utilized multimodal analysis of several MRI techniques, including FLAIR, T1-weighted and T2-weighted images, MTI and DTI, to understand the etiology of NPSLE (Bosma et al., 2004; Emmer et al., 2008; Zivadinov et al., 2013; Zimny et al., 2014). These studies, however promising, were limited to showing only global changes in the whole brain or in total normal appearing brain tissue. No study to date employed a voxel-based combination and comparison of different quantitative MRI maps to study NPSLE to investigate the anatomical distribution of tissue damage in NPSLE as reflected by DTI and MTI, as well as the relationship between microstructural damage in normal appearing white matter (NAWM) and WMH.
In this study we simultaneously assessed and combined quantitative information from MTI, DTI and FLAIR images to better localize and characterize WM changes in SLE and in NPSLE. In this way we aim to obtain more information on the underlying pathological processes driving NPSLE, and compare the diagnostic potential of FLAIR, DTI and MTI whether separately applied or combined.
2. Materials and methods
2.1. Patients and healthy controls
9 NPSLE patients (37 ± 13 years), 9 SLE patients without NP symptoms (44 ± 11 years) and 14 age-matched HC without known neurological abnormalities or autoimmune diseases (40 ± 9 years) were included in the study. All subjects were female. The study was in compliance with Helsinki Declaration and approved by Institutional Review Board of Leiden University Medical Center (LUMC). All subjects provided a written informed consent. All SLE and NPSLE patients were recruited from the Department Of Rheumatology at our institution and had been diagnosed with SLE according to the 1982 revised American College Of Rheumatology (ACR) criteria (Tanet al., 1982; Hochberg, 1997). NPSLE diagnosis was made after exclusion of other causes by multidisciplinary consensus. NP diagnoses were classified according to the 1999 ACR case definitions for NPSLE syndromes and each NPSLE patient was categorized according to the presence of inflammatory and/or ischemic syndromes (American College of Rheumatology, 1999; Zirkzee et al., 2012). The NPSLE subjects had at least one of the following central nervous system NP syndromes: psychosis (n = 1), headache (n = 5), movement disorder (n = 1), transverse myelitis (n = 1), seizure (n = 1), anxiety (n = 1), cognitive disorder (n = 4) and mood disorder (n = 3). Demyelinating syndrome, aseptic meningitis and acute confusional state were not present in our group of NPSLE patients. Table 1 shows the clinical characteristics, the autoantibody profile and the medication of the study subjects at the time of the MRI.
Table 1.
Demographics of the study subjects and patient characteristics from SLE and NPSLE patients.
| NPSLE patients |
SLE patients |
Healthy controls |
|
|---|---|---|---|
| (n = 9 females) | (n = 9 females) | (n = 14 females) | |
| Age (years) | 37 ± 13 | 44 ± 11 | 40 ± 9 |
| SLE disease duration (years) | 10 ± 9 | 11 ± 8 | − |
| NPSLE disease duration (years) | 1 ± 2 | − | − |
| SLEDAI | 4 ± 5 | 2 ± 2 | − |
| Patient characteristics | |||
| Antiphospholipid syndrome | 3 (33%) | 1 (11%) | |
| Active NPSLE patients | 7 (78%) | − | |
| Inflammatory phenotype | 6 (67%) | − | |
| Ischemic phenotype | 6 (67%) | − | |
| Auto-antibodies | |||
| Antinuclear antibody | 9 (100%) | 9 (100%) | |
| Anti-DNA | 2 (22%) | 7 (78%) | |
| Anti-RNP | 2 (22%) | 1 (11%) | |
| Anti-SSA | 3 (33%) | 4 (44%) | |
| Anti-SSB | 1 (11%) | 1 (11%) | |
| Anti-Smith | 1 (11%) | 0 | |
| Anticardiolipin autoantibodies | 1 (11%) | 2 (22%) | |
| Lupus anticoagulant | 3 (33%) | 2 (22%) | |
| Anti-B2 glycoprotein | 2 (22%) | 0 | |
| ACR criteria | |||
| Malar rash | 3 (33%) | 2 (22%) | |
| Discoid lupus | 3 (33%) | 3 (33%) | |
| Photosensitivity | 4 (44%) | 5 (56%) | |
| Aphthosis | 5 (56%) | 3 (33%) | |
| Arthritis | 8 (89%) | 7 (78%) | |
| Serositis | 1 (11%) | 3 (33%) | |
| Lupus nephritis | 1 (11%) | 3 (33%) | |
| NPSLE | 9 (100%) | 0 | |
| Hematologic disorder | 6 (67%) | 7 (78%) | |
| Immunologic disorder | 6 (67%) | 9 (100%) | |
| Antinuclear antibodies | 9 (100%) | 9 (100%) | |
| Medication | |||
| Prednisone | 7 (78%) | 3 (33%) | |
| Azathioprine | 1 (11%) | 4 (44%) | |
| Methotrexate | 0 | 1 (11%) | |
| Hydroxychloroquine | 5 (56%) | 8 (89%) | |
| Rituximab | 1 (11%) | 0 | |
2.2. Data acquisition
MRI scans were performed on a 3 Tesla Achieva Philips MRI scanner (Philips Healthcare, Best, The Netherlands) equipped with an 8-channel receive head coil. MRI scan protocol consisted of (a) Axial 3D T1-weighted images (FOV: 224 × 177 × 144, resolution: 0.88 × 0.88 × 1.20 mm3, TR/TE = 9.75/4.59 ms); (b) Sagittal FLAIR images (FOV: 220 × 173 × 220, resolution: 0.98 × 0.98 × 1.12 mm3, TR/TE/TI = 4800/274/1650 ms); (c) Axial Diffusion Tensor Images (DTI) (FOV: 224 × 224 × 120, resolution: 2 × 2 × 2 mm3, TR/TE = 8500/95 ms, one b = 0 s/mm2 volume and 15 diffusion-weighted volumes with a b-value of 1000 s/mm2); (d) Axial MTI (FOV: 230 × 230 × 132, resolution: 1.44 × 1.44 × 1.5 mm3, TR/TE = 57.07/10.00 ms, flip angle: 15°, two sets of images acquired with and without a sinc-gauss radio frequency saturation pulse of 25 ms duration, peak B1 amplitude of 5.283 µT and offset frequency of 2000 Hz).
2.3. Image processing and analysis
2.3.1. FLAIR lesion segmentation
WM hyperintensities were manually segmented from the FLAIR images by an expert reader (O.T.) and binary lesion masks were created for each subject using MIPAV (Medical Image Processing, Analysis and Visualization) software (McAuliffe et al., 2001; Bazin et al., 2007). All FLAIR images were affine registered to MNI152 standard space using FSL FLIRT (Jenkinson and Smith, 2001; Jenkinson et al., 2002). The same transformation matrix was applied to align individual lesion masks to the standard space. Cumulative lesion masks were created for NPSLE patients, SLE patients and HC by adding all individual lesion masks from each group in standard space.
2.3.2. DTI post-processing
The diffusion-weighted images were brain-extracted with the BET tool in FSL (http://www.fmrib.ox.ac.uk/fsl). Using an estimate of the noise variance in CSF signal intensity of the right ventricle, the data were denoised using an algorithm described in Aja-Fernandez et al. (2008) and then Rician noise corrected using the algorithm in Ingo et al. (2014). The data were corrected for motion and eddy currents by co-registering diffusion weighted images to the image acquired with b = 0 s/mm2 using the SPM8 toolbox (http://www.fil.ion.ucl.ac.uk/spm/software/spm8/). The same transformation matrix was applied to the diffusion gradient directions to rotate them according to the registration algorithm. DTI metrics were estimated on a voxel-wise basis using Diffusion Toolbox (FDT) (Behrens et al., 2003). In order to have an initial alignment between all subjects, each subject's FA map was first registered to the FA map of one representative HC through a rigid registration with 6 degrees of freedom. FA maps were then used as an input to the TBSS process (Smith et al., 2006) where all FA maps were registered to the FSL FA template in MNI standard space through non-linear registration, and a mean FA image was created from the average of all individual FA images. The mean FA image was then skeletonized, and a threshold of 0.25 was applied to the skeleton to exclude non-WM voxels. All individual FA maps were then projected onto this common skeleton by using the maximum FA value perpendicular to the skeleton voxels. The same transformations and projections were applied to the other DTI maps, such as MD, radial diffusivity (RD) and axial diffusivity (AD).
2.3.3. MTI post-processing
An in-house FSL script was used for the processing of the MTI data. The image without saturation (M0) was brain-extracted using BET and the binary brain mask obtained from BET was applied to the image with saturation (Ms). Ms was then aligned to M0 with normalized mutual information algorithm using 7 degrees of freedom in FSL FLIRT. The magnetization transfer ratio (MTR) was calculated as a percentage on a voxel-wise basis according to the following equation:
where Ms is the voxel intensity with saturation and M0 is the voxel intensity without saturation. In order to align the MTR images with the FA images, the unsaturated image was co-registered to the image at b = 0 s/mm2 through affine registration using normalized mutual information, following the procedure described in Bodini et al. (2014). The same transformation matrix was then used to align the MTR images with the FA images. Finally, the same MNI transformations and projections used in the DTI post-processing were applied to MTR.
2.3.4. Statistical analysis
Permutation tests were applied to 4D skeletonized FA, MD, AD, RD and MTR images in order to assess voxel-wise statistics between NPSLE patients, SLE patients, and HC. 5000 permutations were used and corrected for multiple comparison based on TFCE (Threshold-Free Cluster Enhancement) (Winkler et al., 2014). Age related changes between groups were corrected by using demeaned age of each individual as a covariate in the TBSS process. In order to assess the statistical differences between NPSLE, SLE, and HC on WM voxels, ANOVA tests were performed with a threshold of p-value < 0.05 on FA, MD, AD, RD and MTR maps. Mann–Whitney U tests were applied to the statistical comparisons of the number and normalized volume of WMH between NPSLE, SLE and HC groups in IBM SPSS Statistics for Windows, Version 20.0 (IBM Corp. Released 2011, Armonk, NY, US).
2.3.5. Co-analysis of DTI and MTR data
An in-house developed MATLAB® (Mathworks, Natick MA, USA) code was used to assess the overlap of significant differences between AD, FA, MD, RD and MTR in the different subject cohorts. FSL volumes containing the voxel-wise statistics corrected for age and multiple comparisons were used as an input for the co-analysis. Voxels with a p-value < 0.05 that overlapped in any two of the above metrics were counted and divided by the total number of voxels in the skeletonized WM in order to compute the ratio of overlap between significantly different regions in these two metrics. The mismatch between MTR and each DTI metric was also similarly assessed in order to find the regions with only MTR or DTI differences between groups.
2.3.6. Histogram analysis
In order to relate the current data to the histogram findings in previous works, we generated histograms based on the MD and MTR voxel-wise values in the skeletonized WM of the three subject groups. The following steps were followed, using an in-house developed MATLAB script: in order to generate histograms based only on NAWM, MTR, and MD, skeletonized images from all subjects were individually masked in MNI space with the lesion masks. Subsequently, MTR and MD histograms were created for each subject. All histograms were normalized by the total number of NAWM voxels in the skeleton for each individual subject. Peak height and locations were then calculated for each normalized histogram. Average histograms of MD and MTR in NAWM were then created for SLE, NPSLE and HC groups separately. The statistical comparisons of the histogram peak height and locations between NPSLE, SLE and HC groups were performed with Mann–Whitney U tests in SPSS software.
3. Results
3.1. Co-analysis of MTR and DTI data
Fig. 1 shows the comparison of FA, MD, AD, RD, and MTR between NPSLE patients and HC (top row), and between SLE and NPSLE patients (bottom row) on one axial slice in MNI152 space. NPSLE patients showed significantly higher AD, RD and MD, and lower FA and MTR than both HC and SLE patients. Cumulative WM lesion maps computed for NPSLE patients and SLE patients are the top and bottom rightmost panels in Fig. 1 respectively.
Fig. 1.
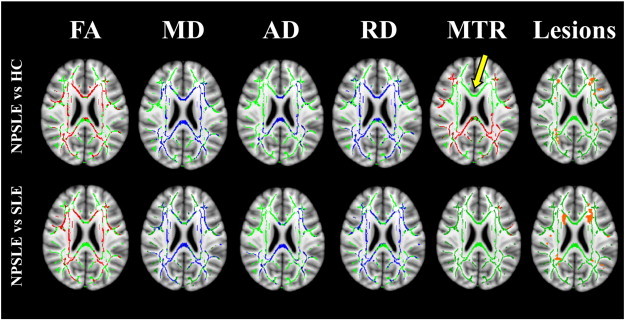
Comparison of statistically significant differences (p-value < 0.05) in FA, MD, AD, RD, and MTR between NPSLE patients and healthy controls (top row), and between SLE and NPSLE patients (bottom row) on one axial slice in MNI152 space. The mean FA skeleton is shown in green, regions with higher values in the NPSLE patients compared to SLE or HC are shown in blue and regions with lower values in NPSLE patients compared to SLE or HC are shown in red. Yellow arrow shows one of the regions (i.e. genu of the corpus callosum) where extensive differences were observed in RD, MD and FA but not in MTR. Cumulative WM lesion maps from NPSLE patients (top rightmost image) and SLE patients (bottom rightmost image) are shown in orange.
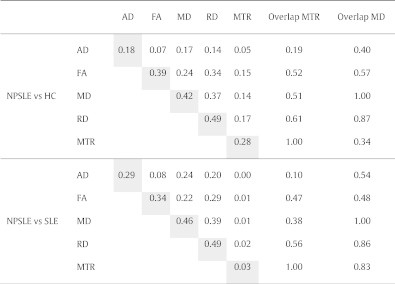
Table 2 shows the fractions of the total number of voxels in the skeletonized WM with significant differences in the various DTI measures and in MTR between NPSLE and HC (top rows) and between NPSLE and SLE (bottom rows). The diagonal elements in the table represent the volume fraction of significant voxels of any single modality, and the off-diagonal elements represent the volume fractions of overlap between two modalities. For example, voxels with significant differences in MD between NPSLE and HC comprised 42% of the skeletonized WM, whereas voxels with significant differences between NPSLE and HC in both MD and MTR comprised 14% of the skeletonized WM.
Table 2.
Ratio of significantly different voxels in between NPSLE vs HC and NPSLE vs SLE in AD, FA, MD, RD and MTR to the total number of voxels in the skeleton (highlighted in gray) and the ratio of significantly different voxels overlapping in the significant regions in two of these metrics to the total number of voxels in the skeleton. Overlaps between DTI metrics and MTR are shown as a ratio of significantly different voxels in MTR. Overlaps between all metrics with MD are shown as a ratio of significantly different voxels in MD.
3.1.1. MTR results
Widespread differences in MTR values (MTR(NPSLE) < MTR(HC) in 28% of the WM skeleton) were observed between NPSLE and HC. Strikingly, as opposed to the extensive differences in DTI metrics between NPSLE and SLE subjects, few differences in MTR were found between these two groups. There were no statistically significant differences in MTR between the SLE and the HC groups (results not shown).
3.1.2. DTI results
The most significant differences in DTI measures between NPSLE and HC were in RD (49% of WM skeleton), MD (42%) and FA (39%). The AD differences were significantly less extensive (18%). The differences in DTI measures between the NPSLE and SLE groups were as extensive as those found between the NPSLE and HC. This is in stark contrast to the relatively minor MTR differences detected between these groups. There were no significant differences in any of the DTI measures between SLE and HC (results not shown).
3.1.3. MTR/DTI overlap
MTR differences between NPSLE and HC, although extensive per se, had only a moderate overlap with the widespread DTI differences between the two groups (rightmost column of Table 2). This can be also qualitatively appreciated on Fig. 1: for example, extensive differences in RD, MD and FA were observed in the genu of the corpus callosum (yellow arrow), but were not accompanied by any MTR differences. Overlap between regions with significant MTR and DTI differences between NPSLE and SLE was negligible, as the regions with significant MTR differences between these populations were in themselves very small (3% of skeletonized WM).
3.2. Lesion analysis results
Fig. 2 shows the median, 25% and 75% quartile range for WM lesion volumes and lesion counts in NPSLE patients, SLE patients and HC. Both WM lesion volume and number of lesions were significantly different between NPSLE patients and HC (p-value < 0.01). No significant difference was found between SLE and NPSLE patients or SLE patients and HC.
Fig. 2.
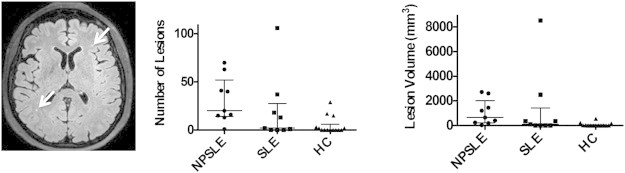
White matter lesions shown with white arrow on one axial slice of the FLAIR image from an NPSLE patient (left panel). Scatter plots of WM lesion counts (middle panel) and volumes (right panel) in NPSLE patients, SLE patients and healthy controls shown with the median, 25% and 75% quartile range.
3.3. Histogram analysis results
Fig. 3 shows the average MD (panel a) and MTR (panel b) histograms for NPSLE, SLE and HC. Table 3 shows the average and standard deviation of peak heights and peak locations as well as the results of the non-parametric statistical tests on the normalized histograms from all three groups. MTR histogram peak heights of NAWM were significantly lower in NPSLE compared to HC and SLE, whereas MD histogram peak heights were significantly higher. MTR histogram peak heights of NPSLE patients were also significantly lower than both those of SLE and HC. MTR peak location was significantly lower in NPSLE compared to HC and not significantly different from that of SLE. No significant differences were observed in MD and MTR peak heights and locations of SLE histograms compared to those of HC.
Fig. 3.
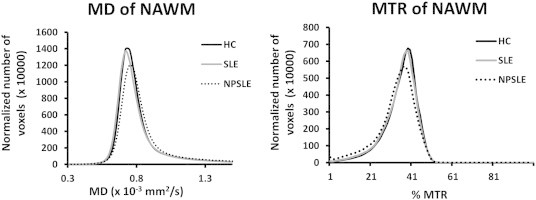
Average MD (left panel) and MTR (right panel) histograms from normal appearing white matter in the skeleton.
Table 3.
MTR and MD histogram peak heights in NPSLE patients, SLE patients and healthy controls.
| NPSLE patients | SLE patients | Healthy controls | |
|---|---|---|---|
| MTR peak height in NAWM | 63.3 ± 8.7⁎⁎(⁎) | 77.8 ± 8.3 | 80.0 ± 12.4 |
| MTR peak location in NAWM | 37.11 ± 2.26⁎⁎ | 38.78 ± 2.22 | 39.64 ± 2.41 |
| MD peak height in NAWM | 126.7 ± 21.7⁎ | 146.7 ± 20.6 | 147.9 ± 17.2 |
| MD peak location in NAWM (×10−3 mm2/s) | 0.76 ± 0.03⁎(⁎) | 0.73 ± 0.04 | 0.74 ± 0.02 |
p-Value < 0.05 versus healthy controls.
p-Value < 0.01 versus healthy controls.
p-Value < 0.05 versus SLE.
4. Discussion
In this study we showed for the first time that two different quantitative MRI tools sensitive to microstructural properties of brain WM reflect in a significantly different manner the underlying tissue damage in NPSLE. This is also the first study to investigate localized MTR changes in NPSLE patients compared to SLE patients with no NP symptoms and HC, and to co-analyze these changes with DTI results from the same patients. Our results strongly suggest that DTI and MTI reflect pathogenic processes in NPSLE that are only partially overlapping, hinting that more than a single process is involved in the etiology of NPSLE. The systematic exclusion of hyperintense lesions from the analysis confines the results of this study to NAWM and emphasizes the relationship between the “invisible” tissue damage revealed by quantitative MRI methods and the disease, in addition to the “visible” damage seen in the lesions.
One of the most striking findings here is that while in the DTI measures, especially in MD and RD, there were significant and spatially extensive differences between NPSLE and SLE, and between NPSLE and HC, differences in MTR, albeit also spatially extensive, were found only between NPSLE and HC, while almost no MTR differences were detected between NPSLE and SLE (Fig. 1). This, taken with the fact that no differences, either in DTI or MTR, were found between HC and SLE, suggests that MTR is sensitive to a microstructural pathomechanism that already acts in WM in SLE patients but is not distinctive to NPSLE patients. Conversely, it is possible that DTI is more specifically sensitive to a microstructural feature that correlates only with NPSLE and not with SLE. Moreover, the regions in which DTI differences between the groups were observed only partially overlapped with the regions indicating MTR differences, even though both methods showed roughly the same sensitivity to the disease, expressed, e.g. by the fraction of voxels in both methods exhibiting significant differences between NPSLE and HC.
MTR reflects the amount of exchange processes between “free” water protons (or molecules) and water protons (or molecules) bound to macromolecular structures in tissue, e.g. myelin, cytoskeleton, cell membranes, proteins and the extracellular matrix (Price et al., 2011). In NPSLE, previous studies that reported MTR findings assigned the drop in MTR in NPSLE patients to several potential mechanisms: axonal injury, demyelination, microvascular ischemia, parenchymal edema and gliosis (Bosma et al., 2004; Emmer et al., 2006; Emmer et al., 2008). Emmer et al. suggested that edema was a more likely cause for MTR changes in NPSLE patients since the reversible changes in the MTR of the NPSLE patients corresponded to the improved clinical status of the patients, and edema is more easily reversible with treatment than, e.g. axonal damage, demyelination and gliosis (Emmer et al., 2006). Histological evidence for many of the mechanisms mentioned above was reported in a previous study that correlated pre-mortem conventional MRI observations with post-mortem histopathology. In this study, the most frequently observed microstructural damages were global ischemic changes and parenchymal edema (Sibbitt et al., 2010). This also supports the hypothesis that parenchymal edema, either cellular or interstitial, potentially contributes to the changes in MTR observed in this study. It is also possible that inflammation-driven microglial activation is linked to MTR changes in NAWM as has been hypothesized with regard to MS (Moll et al., 2011).
Diffusivity measures obtained with DTI, on the other hand, reflect the displacement of water molecules on a microscopic scale, and changes in these measures reflect changes in tissue microstructure as well as in properties of the diffusing medium, e.g. viscosity and molecular crowding of the cytosol or the extracellular fluid (Beaulieu, 2002). Higher MD, RD and AD, as well as lower FA in NPSLE patients compared to HC and SLE patients found in this study and in previous ones (Hughes et al., 2007; Emmer et al., 2010; Jung et al., 2010; Zivadinov et al., 2013; Schmidt-Wilcke et al., 2014) point to various underlying mechanisms, including axonal loss, demyelination, edema, as well as microinfarcts caused by the effect of corticosteroids or antirheumatic drugs and acute inflammation in small vessels (Hughes et al., 2007; Emmer et al., 2010; Jung et al., 2010; Schmidt-Wilcke et al., 2014). However, a salient finding in our study is that the differences in RD between NPSLE and SLE, and between NPSLE and HC, were much more extensive than the differences in AD between groups. It should be noted that MD is linearly dependent on both RD and AD: , and thus most of the extensive inter-group differences observed in MD in our study can be attributed to the differences in RD. It has been argued that changes in RD mostly reflect the creation of more space for water to diffuse perpendicularly to the axon propagation direction in the extracellular space in WM, caused, e.g. by demyelination (Song et al., 2005). Although the hypothesis of an exclusive link between radial diffusivity and demyelination has been challenged in conjunction with multiple sclerosis (Wheeler-Kingshott and Cercignani, 2009), there is still a significant body of evidence to support the notion that an increase in RD reflects mostly changes in the interstitial space. Thus, with demyelination only as a secondary mechanism for WM microstructural damage in NPSLE (Sibbitt et al., 2010), it is possible that the DTI changes we observed in our study stem mostly from, e.g. edema. Differences in AD between groups observed in this study were smaller than those observed in RD but are still highly significant. Changes in AD can be related to the interstitial space, or represent intra-axonal changes that interfere with diffusion along the axonal propagation direction caused by, e.g. axonal degeneration and axonal loss, but these will most likely cause a decrease in AD rather than an increase (Budde et al., 2009; Wood et al., 2012). A recent investigation of the DTI correlates of vasogenic edema using both Monte-Carlo simulations and tissue phantom data showed that increased extent of vasogenic edema could result in decreased FA, increased RD and less significantly increased AD, similarly to the results in our study (Chiang et al., 2014).
From the diagnostic standpoint, the NPSLE subject group in our study consisted exclusively of patients with active complaints at the time of the MRI examination. This may explain the more extensive changes observed in our study, compared to previous DTI-TBSS studies on NPSLE (Emmer et al., 2010; Junget al., 2010; Schmidt-Wilcke et al., 2014). Several regions which showed significant decreased FA were also reported in previous studies, such as the inferior fronto-occipital fasciculus, the fornix, the posterior limb of the internal capsule (corticospinal tract), the anterior limb of the internal capsule, inferior longitudinal fasciculus, inferior fronto-occipital fasciculus, cingulum, corpus callosum, superior longitudinal fasciculus, and the anterior corona radiata (Emmer et al., 2010; Jung et al., 2010; Zimny et al., 2014), while some were observed here for the first time: the external capsule, cerebral peduncle, and posterior thalamic radiation. It is thus plausible that the microstructural tissue damage revealed by the DTI measures is non-specific and based on our results, has a sharp onset correlated with the NPSLE symptoms.
Histograms of MTR and DTI measures in the skeletonized WM offer a non-spatially specific assessment of the differences among the various groups. Histograms of MTR and DTI measures have been used to evaluate changes in several previous studies (Bosma et al., 2000a; Bosma et al., 2000b; Bosma et al., 2003; Bosma et al., 2004; Emmer et al., 2006). Peak heights in normalized histograms are typically inversely related to the variance (peak width) of the measure represented in the histogram, while the peak location, or the most frequently observed value, is typically correlated (but not identical) to the mean value of the measure in the histogram, and thus is more directly related to the values observed in a spatially-resolved manner in the difference maps in Fig. 1. Here we show histogram results both for comparison purposes to previous studies, as well as to present more accurate global changes in DTI and MTR than previously shown, in that they are specific to the core of WM tracts, i.e. clean from partial volume with gray matter and CSF, as well as to NAWM, thus avoiding the confound of WM lesions, which were included in histograms shown in most previous studies, except for Emmer et al. (2006). The significant difference between the peak location of the MD histogram of NPSLE and that of both SLE and HC corroborates the spatially-resolved results shown earlier in our TBSS analysis. Similarly, the MTR histogram peak location in NPSLE was significantly different from that of HC but not from that of SLE, although this can be attributed to the variance in the MTR measures. Differences observed in histogram peak heights in both MTR and DTI were in line with previous studies (Bosma et al., 2000a; Bosma et al., 2000b; Bosma et al., 2003; Emmer et al., 2006).
Although this study mostly focused on microstructural changes in NAWM in NPSLE and SLE, we performed a detailed focal lesion analysis, which confirms previous findings of significant differences in NPSLE patients compared to SLE and HC (Appenzeller et al. (2008b); Kozora and Filley, 2011). It is impossible to exclude the effect that WM lesions have on the disease outcome of NPSLE, although direct relationship is difficult to establish (Luyendijk et al., 2011). In the context of our study, individual mapping of WMH and their systematic exclusion from the skeletonized WM analyses helped demonstrate the significant role that alterations in NAWM have in NPSLE.
This study was subject to many limitations and challenges. Besides the small cohort size of this study, which limits its statistical power, one of the most severe limitations of this study is the lack of diagnostic differentiation between ischemic and inflammatory NPSLE patient groups. It has been hypothesized that these phenotypes may result in a different set of disease effects on the brain, and by combining these groups, we measured an averaged overall effect of SLE and NPSLE on WM microstructure, without having the specificity to assign the resulting outcomes to inflammation or ischemia. We intend to separately investigate the effect of inflammatory and ischemic NPSLE in a longitudinal study in order to provide a multimodal MRI characterization of the damage caused by inflammation or ischemia. Another limitation of this study was the heterogeneity of NPSLE syndromes observed in our patients, which subsequently may lead to a large variability in the location and the severity of the tissue microstructural correlates. In the future, we plan to continue our multimodal investigation of SLE and NPSLE with more homogenous subgroups of patients, in the hope that this could lead to a better characterization of the link between NPSLE, and tissue damage in specific areas of the brain resulting in specific symptoms.
Lastly, only 6 NPSLE patients out of the total 9 were scanned within a year of the first onset of NP symptoms, while the other 3 patients were diagnosed as NPSLE 3–6 years prior to the MRI scans. Longer disease durations may have probably added confounding factors such as accumulated tissue damage caused by previous NPSLE episodes as well as effects caused by longer treatment. This study could have indeed benefitted from a tighter range of disease durations, however it should be mentioned that given the relative low incidence of NPSLE in the general population, we focused on scanning NPSLE patients with active symptoms, rather than limiting it further to patients with first occurrence of NP symptoms.
5. Conclusions
In conclusion, this study supports the notion that microstructural tissue changes in NAWM in NPSLE are heterogeneous, and that these changes give rise to a complex MRI picture as seen by two distinct quantitative MRI tools. We showed the potential usefulness of spatially-resolved co-analyses of MTR and DTI data, which we hope that in the future, may help detect local effects of the different pathological mechanisms in NPSLE and their link to specific neuropsychiatric symptoms, and can thus be useful for designing better diagnostic procedures for NPSLE.
Acknowledgements
We would like to thank Diane van der Woude, Liesbeth Beaart-van de Voorde, Margreet Steup-Beekman and Marjan van der Elst for their help in patient recruitment, Joost Doornbos and LUMC MRI technologists for their support in MRI data acquisition. Ece Ercan was supported by a Dutch Arthritis Association (Reumafonds) grant (# 2010_0000135).
References
- Aja-Fernandez S., Alberola-Lopez C., Westin C.F. Noise and signal estimation in magnitude MRI and Rician distributed images: a LMMSE approach. I.E.E.E. Trans. Image Process. 2008;17(8):1383–1398. doi: 10.1109/TIP.2008.925382. 18632347 [DOI] [PubMed] [Google Scholar]
- American College Of Rheumatology The American College of Rheumatology nomenclature and case definitions for neuropsychiatric lupus syndromes. Arthritis Rheum. 1999;42(4):599–608. doi: 10.1002/1529-0131(199904)42:4<599::AID-ANR2>3.0.CO;2-F. 10211873 [DOI] [PubMed] [Google Scholar]
- Appenzeller S., Bonilha L., Rio P.A., Min Li L., Costallat L.T., Cendes F. Longitudinal analysis of gray and white matter loss in patients with systemic lupus erythematosus. Neuroimage. 2007;34(2):694–701. doi: 10.1016/j.neuroimage.2006.09.029. 17112740 [DOI] [PubMed] [Google Scholar]
- Appenzeller S., Pike G.B., Clarke A.E. Magnetic resonance imaging in the evaluation of central nervous system manifestations in systemic lupus erythematosus. Clin. Rev. Allergy Immunol. 2008;34(3):361–366. doi: 10.1007/s12016-007-8060-z. 18084729 [DOI] [PubMed] [Google Scholar]
- Appenzeller S., Vasconcelos Faria A., Li L.M., Costallat L.T., Cendes F. Quantitative magnetic resonance imaging analyses and clinical significance of hyperintense white matter lesions in systemic lupus erythematosus patients. Ann. Neurol. 2008;64(6):635–643. doi: 10.1002/ana.21483. 19107986 [DOI] [PubMed] [Google Scholar]
- Bazin P.L., Cuzzocreo J.L., Yassa M.A., Gandler W., McAuliffe M.J., Bassett S.S., Pham D.L. Volumetric neuroimage analysis extensions for the MIPAV software package. J. Neurosci. Methods. 2007;165(1):111–121. doi: 10.1016/j.jneumeth.2007.05.024. 17604116 [DOI] [PMC free article] [PubMed] [Google Scholar]
- Beaulieu C. The basis of anisotropic water diffusion in the nervous system — a technical review. N.M.R. Biomed. 2002;15(7–8):435–455. doi: 10.1002/nbm.782. 12489094 [DOI] [PubMed] [Google Scholar]
- Behrens T.E., Woolrich M.W., Jenkinson M., Johansen-Berg H., Nunes R.G., Clare S., Matthews P.M., Brady J.M., Smith S.M. Characterization and propagation of uncertainty in diffusion-weighted MR imaging. Magn. Reson. Med. 2003;50(5):1077–1088. doi: 10.1002/mrm.10609. 14587019 [DOI] [PubMed] [Google Scholar]
- Bertsias G.K., Boumpas D.T. Pathogenesis, diagnosis and management of neuropsychiatric SLE manifestations. Nat. Rev. Rheumatol. 2010;6(6):358–367. doi: 10.1038/nrrheum.2010.62. 20458332 [DOI] [PubMed] [Google Scholar]
- Bodini B., Cercignani M., Toosy A., De Stefano N., Miller D.H., Thompson A.J., Ciccarelli O. A novel approach with “skeletonised MTR” measures tract-specific microstructural changes in early primary-progressive MS. Hum. Brain Mapp. 2014;35(2):723–733. doi: 10.1002/hbm.22196. 23616276 [DOI] [PMC free article] [PubMed] [Google Scholar]
- Bosma G.P., Huizinga T.W., Mooijaart S.P., Van Buchem M.A. Abnormal brain diffusivity in patients with neuropsychiatric systemic lupus erythematosus. A.J.N.R. Am. J. Neuroradiol. 2003;24(5):850–854. 12748084 [PMC free article] [PubMed] [Google Scholar]
- Bosma G.P., Rood M.J., Huizinga T.W., de Jong B.A., Bollen E.L., van Buchem M.A. Detection of cerebral involvement in patients with active neuropsychiatric systemic lupus erythematosus by the use of volumetric magnetization transfer imaging. Arthritis Rheum. 2000;43(11):2428–2436. doi: 10.1002/1529-0131(200011)43:11<2428::AID-ANR9>3.0.CO;2-H. 11083265 [DOI] [PubMed] [Google Scholar]
- Bosma G.P., Rood M.J., Zwinderman A.H., Huizinga T.W., van Buchem M.A. Evidence of central nervous system damage in patients with neuropsychiatric systemic lupus erythematosus, demonstrated by magnetization transfer imaging. Arthritis Rheum. 2000;43(1):48–54. doi: 10.1002/1529-0131(200001)43:1<48::AID-ANR7>3.0.CO;2-H. 10643699 [DOI] [PubMed] [Google Scholar]
- Bosma G.P., Steens S.C., Petropoulos H., Admiraal-Behloul F., van den Haak A., Doornbos J., Huizinga T.W., Brooks W.M., Harville A., Sibbitt W.L., Jr., van Buchem M.A. Multisequence magnetic resonance imaging study of neuropsychiatric systemic lupus erythematosus. Arthritis Rheum. 2004;50(10):3195–3202. doi: 10.1002/art.20512. 15476212 [DOI] [PubMed] [Google Scholar]
- Budde M.D., Xie M., Cross A.H., Song S.K. Axial diffusivity is the primary correlate of axonal injury in the experimental autoimmune encephalomyelitis spinal cord: a quantitative pixelwise analysis. J. Neurosci. 2009;29(9):2805–2813. doi: 10.1523/JNEUROSCI.4605-08.2009. 19261876 [DOI] [PMC free article] [PubMed] [Google Scholar]
- Castellino G., Govoni M., Giacuzzo S., Trotta F. Optimizing clinical monitoring of central nervous system involvement in SLE. Autoimmun. Rev. 2008;7(4):297–304. doi: 10.1016/j.autrev.2007.11.022. 18295733 [DOI] [PubMed] [Google Scholar]
- Chiang C.W., Wang Y., Sun P., Lin T.H., Trinkaus K., Cross A.H., Song S.K. Quantifying white matter tract diffusion parameters in the presence of increased extra-fiber cellularity and vasogenic edema. Neuroimage. 2014;101:310–319. doi: 10.1016/j.neuroimage.2014.06.064. 25017446 [DOI] [PMC free article] [PubMed] [Google Scholar]
- Emmer B.J., Steens S.C., Steup-Beekman G.M., van der Grond J., Admiraal-Behloul F., Olofsen H., Bosma G.P., Ouwendijk W.J., Huizinga T.W., van Buchem M.A. Detection of change in CNS involvement in neuropsychiatric SLE: a magnetization transfer study. J. Magn. Reson. Imaging. 2006;24(4):812–816. doi: 10.1002/jmri.20706. 16941632 [DOI] [PubMed] [Google Scholar]
- Emmer B.J., Steup-Beekman G.M., Steens S.C., Huizinga T.W., van Buchem M.A., van der Grond J. Correlation of magnetization transfer ratio histogram parameters with neuropsychiatric systemic lupus erythematosus criteria and proton magnetic resonance spectroscopy: association of magnetization transfer ratio peak height with neuronal and cognitive dysfunction. Arthritis Rheum. 2008;58(5):1451–1457. doi: 10.1002/art.23452. 18438847 [DOI] [PubMed] [Google Scholar]
- Emmer B.J., Veer I.M., Steup-Beekman G.M., Huizinga T.W., van der Grond J., van Buchem M.A. Tract-based spatial statistics on diffusion tensor imaging in systemic lupus erythematosus reveals localized involvement of white matter tracts. Arthritis Rheum. 2010;62(12):3716–3721. doi: 10.1002/art.27717. 20722009 [DOI] [PubMed] [Google Scholar]
- Hochberg M.C. Updating the American College of Rheumatology revised criteria for the classification of systemic lupus erythematosus. Arthritis Rheum. 1997;40(9):1725. doi: 10.1002/art.1780400928. 9324032 [DOI] [PubMed] [Google Scholar]
- Hughes M., Sundgren P.C., Fan X., Foerster B., Nan B., Welsh R.C., Williamson J.A., Attwood J., Maly P.V., Chenevert T.L., McCune W., Gebarski S. Diffusion tensor imaging in patients with acute onset of neuropsychiatric systemic lupus erythematosus: a prospective study of apparent diffusion coefficient, fractional anisotropy values, and eigenvalues in different regions of the brain. Acta Radiol. 2007;48(2):213–222. doi: 10.1080/02841850601105825. 17354144 [DOI] [PubMed] [Google Scholar]
- Ingo C., Magin R.L., Colon-Perez L., Triplett W., Mareci T.H. On random walks and entropy in diffusion-weighted magnetic resonance imaging studies of neural tissue. Magn. Reson. Med. 2014;71:617–627. doi: 10.1002/mrm.24706. 23508765 [DOI] [PMC free article] [PubMed] [Google Scholar]
- Jeltsch-David H., Muller S. Neuropsychiatric systemic lupus erythematosus: pathogenesis and biomarkers. Nat. Rev. Neurol. 2014;10(10):579–596. doi: 10.1038/nrneurol.2014.148. 25201240 [DOI] [PubMed] [Google Scholar]
- Jenkinson M., Bannister P., Brady M., Smith S. Improved optimization for the robust and accurate linear registration and motion correction of brain images. Neuroimage. 2002;17(2):825–841. doi: 10.1016/s1053-8119(02)91132-8. 12377157 [DOI] [PubMed] [Google Scholar]
- Jenkinson M., Smith S. A global optimisation method for robust affine registration of brain images. Med. Image Anal. 2001;5(2):143–156. doi: 10.1016/s1361-8415(01)00036-6. 11516708 [DOI] [PubMed] [Google Scholar]
- Jung R.E., Caprihan A., Chavez R.S., Flores R.A., Sharrar J., Qualls C.R., Sibbitt W., Roldan C.A. Diffusion tensor imaging in neuropsychiatric systemic lupus erythematosus. B.M.C. Neurol. 2010;10:65. doi: 10.1186/1471-2377-10-65. 20667115 [DOI] [PMC free article] [PubMed] [Google Scholar]
- Kozora E., Filley C.M. Cognitive dysfunction and white matter abnormalities in systemic lupus erythematosus. J. Int. Neuropsychol. Soc. 2011;17(3):385–392. doi: 10.1017/S1355617711000191. 21338548 [DOI] [PubMed] [Google Scholar]
- Lauvsnes M.B., Omdal R. Systemic lupus erythematosus, the brain, and anti-NR2 antibodies. J. Neurol. 2012;259(4):622–629. doi: 10.1007/s00415-011-6232-5. 21909801 [DOI] [PubMed] [Google Scholar]
- Luyendijk J., Steens S.C., Ouwendijk W.J., Steup-Beekman G.M., Bollen E.L., van der Grond J., Huizinga T.W., Emmer B.J., van Buchem M.A. Neuropsychiatric systemic lupus erythematosus: lessons learned from magnetic resonance imaging. Arthritis Rheum. 2011;63(3):722–732. doi: 10.1002/art.30157. 21360502 [DOI] [PubMed] [Google Scholar]
- McAuliffe M.J., Lalonde F.M., McGarry D., Gandler W., Csaky K., Trus B.L. 2001. Medical Image Processing, Analysis and Visualization in Clinical Research. Medical Systems. 14th IEEE Symposium on CBMS. [Google Scholar]
- Moll N.M., Rietsch A.M., Thomas S., Ransohoff A.J., Lee J.C., Fox R., Chang A., Ransohoff R.M., Fisher E. Multiple sclerosis normal-appearing white matter: pathology-imaging correlations. Ann. Neurol. 2011;70(5):764–773. doi: 10.1002/ana.22521. 22162059 [DOI] [PMC free article] [PubMed] [Google Scholar]
- Price S.J., Tozer D.J., Gillard J.H. Methodology of diffusion-weighted, diffusion tensor and magnetisation transfer imaging. Br. J. Radiol. 2011;84(Spec No 2):S121–S126. doi: 10.1259/bjr/12789972. 22433823 [DOI] [PMC free article] [PubMed] [Google Scholar]
- Schmidt-Wilcke T., Cagnoli P., Wang P., Schultz T., Lotz A., McCune W.J., Sundgren P.C. Diminished white matter integrity in patients with systemic lupus erythematosus. Neuroimage Clin. 2014;5:291–297. doi: 10.1016/j.nicl.2014.07.001. 25161895 [DOI] [PMC free article] [PubMed] [Google Scholar]
- Sibbitt W.L., Jr., Brooks W.M., Kornfeld M., Hart B.L., Bankhurst A.D., Roldan C.A. Magnetic resonance imaging and brain histopathology in neuropsychiatric systemic lupus erythematosus. Semin. Arthritis Rheum. 2010;40(1):32–52. doi: 10.1016/j.semarthrit.2009.08.005. 19880162 [DOI] [PMC free article] [PubMed] [Google Scholar]
- Smith S.M., Jenkinson M., Johansen-Berg H., Rueckert D., Nichols T.E., Mackay C.E., Watkins K.E., Ciccarelli O., Cader M.Z., Matthews P.M., Behrens T.E. Tract-based spatial statistics: voxelwise analysis of multi-subject diffusion data. Neuroimage. 2006;31(4):1487–1505. doi: 10.1016/j.neuroimage.2006.02.024. 16624579 [DOI] [PubMed] [Google Scholar]
- Song S.K., Yoshino J., Le T.Q., Lin S.J., Sun S.W., Cross A.H., Armstrong R.C. Demyelination increases radial diffusivity in corpus callosum of mouse brain. Neuroimage. 2005;26(1):132–140. doi: 10.1016/j.neuroimage.2005.01.028. 15862213 [DOI] [PubMed] [Google Scholar]
- Steup-Beekman G.M., Zirkzee E.J., Cohen D., Gahrmann B.M., Emmer B.J., Steens S.C., Bollen E.L., van Buchem M.A., Huizinga T.W. Neuropsychiatric manifestations in patients with systemic lupus erythematosus: epidemiology and radiology pointing to an immune-mediated cause. Ann. Rheum. Dis. 2013;72(Suppl. 2):ii76–ii79. doi: 10.1136/annrheumdis-2012-202369. 23253914 [DOI] [PubMed] [Google Scholar]
- Stojanovich L., Zandman-Goddard G., Pavlovich S., Sikanich N. Psychiatric manifestations in systemic lupus erythematosus. Autoimmun. Rev. 2007;6(6):421–426. doi: 10.1016/j.autrev.2007.02.007. 17537389 [DOI] [PubMed] [Google Scholar]
- Tan E.M., Cohen A.S., Fries J.F., Masi A.T., McShane D.J., Rothfield N.F., Schaller J.G., Talal N., Winchester R.J. The 1982 revised criteria for the classification of systemic lupus erythematosus. Arthritis Rheum. 1982;25(11):1271–1277. doi: 10.1002/art.1780251101. 7138600 [DOI] [PubMed] [Google Scholar]
- Welsh R.C., Rahbar H., Foerster B., Thurnher M., Sundgren P.C. Brain diffusivity in patients with neuropsychiatric systemic lupus erythematosus with new acute neurological symptoms. J. Magn. Reson. Imaging. 2007;26(3):541–551. doi: 10.1002/jmri.21036. 17729344 [DOI] [PubMed] [Google Scholar]
- Wheeler-Kingshott C.A., Cercignani M. About “axial” and “radial” diffusivities. Magn. Reson. Med. 2009;61(5):1255–1260. doi: 10.1002/mrm.21965. 19253405 [DOI] [PubMed] [Google Scholar]
- Winkler A.M., Ridgway G.R., Webster M.A., Smith S.M., Nichols T.E. Permutation inference for the general linear model. Neuroimage. 2014;92:381–397. doi: 10.1016/j.neuroimage.2014.01.060. 24530839 [DOI] [PMC free article] [PubMed] [Google Scholar]
- Wood E.T., Ronen I., Techawiboonwong A., Jones C.K., Barker P.B., Calabresi P., Harrison D., Reich D.S. Investigating axonal damage in multiple sclerosis by diffusion tensor spectroscopy. J. Neurosci. 2012;32(19):6665–6669. doi: 10.1523/JNEUROSCI.0044-12.2012. 22573688 [DOI] [PMC free article] [PubMed] [Google Scholar]
- Zhang L., Harrison M., Heier L.A., Zimmerman R.D., Ravdin L., Lockshin M., Uluğ A.M. Diffusion changes in patients with systemic lupus erythematosus. Magn. Reson. Imaging. 2007;25(3):399–405. doi: 10.1016/j.mri.2006.09.037. 17371731 [DOI] [PubMed] [Google Scholar]
- Zimny A., Szmyrka-Kaczmarek M., Szewczyk P., Bladowska J., Pokryszko-Dragan A., Gruszka E., Wiland P., Sasiadek M. In vivo evaluation of brain damage in the course of systemic lupus erythematosus using magnetic resonance spectroscopy, perfusion-weighted and diffusion-tensor imaging. Lupus. 2014;23(1):10–19. doi: 10.1177/0961203313511556. 24192079 [DOI] [PubMed] [Google Scholar]
- Zirkzee E.J., Steup-Beekman G.M., van der Mast R.C., Bollen E.L., van der Wee N.J., Baptist E., Slee T.M., Huisman M.V., Middelkoop H.A., Luyendijk J., van Buchem M.A., Huizinga T.W. Prospective study of clinical phenotypes in neuropsychiatric systemic lupus erythematosus; multidisciplinary approach to diagnosis and therapy. J. Rheumatol. 2012;39(11):2118–2126. doi: 10.3899/jrheum.120545. 22984275 [DOI] [PubMed] [Google Scholar]
- Zivadinov R., Shucard J.L., Hussein S., Durfee J., Cox J.L., Bergsland N., Dwyer M.G., Benedict R.H., Ambrus J., Shucard D.W. Multimodal imaging in systemic lupus erythematosus patients with diffuse neuropsychiatric involvement. Lupus. 2013;22(7):675–683. doi: 10.1177/0961203313486193. 23640981 [DOI] [PubMed] [Google Scholar]