

Abstract
We introduce a new measure of antigenic distance between influenza A vaccine and circulating strains. The measure correlates well with efficacies of the H3N2 influenza A component of the annual vaccine between 1971 and 2004, as do results of a theory of the immune response to influenza following vaccination. This new measure of antigenic distance is correlated with vaccine efficacy to a greater degree than are current state-of-the-art phylogenetic sequence analyzes or ferret antisera inhibition assays. We suggest that this new measure of antigenic distance be used in the design of the annual influenza vaccine and in the interpretation of vaccine efficacy monitoring.
1 Introduction
Annual influenza epidemics are responsible for the deaths of 250000 to 500000 people worldwide and cause illness in 5 to 15% of the total population each year [1]. The total direct and indirect costs associated with influenza in the USA are roughly $10 billion [2], and the economic cost of an influenza pandemic is estimated to be between $71–167 billion [3] in the USA alone. Vaccination is the primary method employed to prevent infection by influenza and its associated complications. Antigenic change, combined with the high transmission rate of influenza strains, means that the vaccine must be redesigned annually, currently based upon phylogenetic, experimental, and epidemiological analysis.
The effectiveness of the annual influenza vaccine varies from year to year due to changes in the identity of the circulating influenza strains. Typically, three strains are included in the annual vaccine, with these three strains chosen to be as similar as possible to those projected to be the most prominent circulating strains in the upcoming influenza season. Currently, the vaccine contains H3N2 and H1N1 influenza A components and an influenza B component. Since the mutation rate of the influenza virus is rather high, vaccine efficacies are rarely 100%, and are more typically 30 – 60%, against influenza-like illness. As significant as the estimated worldwide mortality is, it rises by another factor of 160% [4] to 260% [5] if influenza-induced complications to patients with other conditions are included, and the influenza vaccine on average significantly reduces such excess mortality [6]. Vaccine efficacy can even be negative, however, due to original antigenic sin [7–9], the tendency for antibodies produced in response to exposure to influenza vaccine antigens to suppress the creation of new, different antibodies in response to exposure to new versions of the influenza virus. The efficacy of the annual influenza vaccine, and whether original antigenic sin may occur, depends sensitively on how similar the vaccine and circulating viral strains are. Current state of the art measures of antigenic distance are based on ferret antisera hemagglutinin inhibition assays [10–12], and these distances are assumed to correlate well with vaccine efficacies in humans. However, to our knowledge no such good correlation has ever been shown for an experimental or theoretical measure of antigenic distance. In addition to its annual value, a reliable measure of antigenic distance would provide valuable extra time if preparation and rush production of a modified vaccine is necessary to stem the spread of a newly emerged influenza strain [13]. We here provide a quantitative definition of the difference between dominant epitope regions in the vaccine and circulating strain and show that this definition of antigenic distance correlates well with human influenza vaccine efficacy over the last 35 years.
2 Methods
Our theory models the response of an immune system not subject to immunosenescence. Therefore, we limited consideration to experimental studies of vaccine efficacy for 18 to 64 year old subjects in all years since sequencing began, when the H3N2 subtype of influenza A was the predominant virus, and where epidemiological data on vaccine efficacy exists. We focus on the H3N2 strain because it is the most common strain and is responsible for significant morbidity and mortality and due to the abundance of available crystallographic, genetic, and epidemiological data. Our approach, however, is general. As is customary, we restrict attention to the hemagglutinin protein, against which neutralizing antibodies are generated [14]. Shown in figure 1 is the hemagglutinin protein for the A/Fujian/411/2002 strain with the epitope regions highlighted.
Fig. 1.
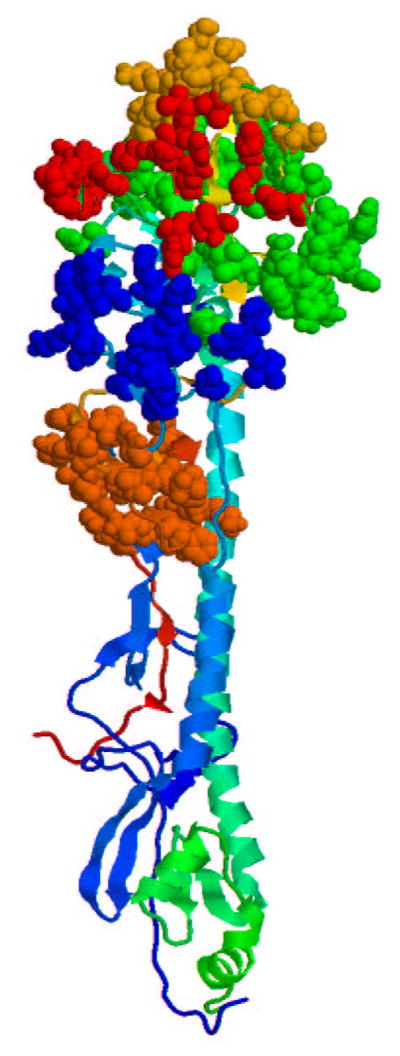
Hemagglutinin protein for the A/Fujian/411/2002 strain. Highlighted are the A (red), B (orange), C (brown), D (green), and E (blue) epitopes [15]. The rest of the protein is shown in ribbon format.
Our theory of the immune response to vaccination and disease uses the generalized N K model [9] to calculate affinity constant values for the immune response to an antigen following vaccination. In this theory, the natural order parameter to distinguish between the vaccine strain and the circulating strain is the fraction of amino acids that differ in the dominant epitope region. The model considers the diversity of an individual’s antibody repertoire and includes interactions within the antibody and between the antibody and the antigen. Here, the binding constant is determined as K = exp(a − b〈U 〉), where a = 18.56 and b = 1.67 are found from a comparison of the dynamics of the model with experiment [9], and U is the energy function for an antibody [9].
To apply the theory to a candidate vaccine and circulating strain, the sequences and identity of the dominant epitope must be known. The sequences and identities of the vaccine and circulating strains for each year were taken from Ref. [15]. The definition of the five epitopes, or surface regions that are recognized by human antibodies, in the H3N2 hemagglutinin protein were also taken from Ref. [15]. The dominant epitope, or the epitope that induces the most significant immune response, for a particular circulating strain in a particular year was taken as that which had the largest fractional change in amino acid sequence relative to the vaccine strain [16–19]. We use as our definition of antigenic distance pepitope, where
| (1) |
An excel spreadsheet to calculate pepitope is available [20].
The difference between the vaccine strain and the circulating strain is defined in the model by pepitope, eq. 1. The vaccine efficacy, E, was assumed to correlate with the binding constant as E = α ln[Ksecondary(pepitope)/Kprimary], where the constant α is chosen so that a perfect match between the vaccine and circulating strain leads to 45% vaccine efficacy (which matches historical data, see table 1), Kprimary is the binding constant for the primary immune response, and Ksecondary is the binding constant for the secondary immune response following vaccination. The theory is entirely predictive, with no fitted parameters save for the determined constant α. For example, the point at which the vaccine efficacy becomes negative is independent of the value of α.
Table 1.
Summary of results. The table includes the identities and accession numbers of the vaccine and circulating strains for each of the years since 1971 that the H3N2 virus has been the predominant influenza virus and for which vaccine efficacy data are available. Vaccine efficacy is taken from the literature [21–35] and defined by eq. 2. Where more than one study exists for the same influenza season, the efficacy results are averaged. The dominant epitope is predicted by our theory for all seasons where the vaccine and circulating strains are not a match. The p epitope and psequence values are calculated using eq. 1 and eq. 3, respectively. Two measures of antigenic distance from ferret antisera assays, d1 [11] and d2 [12], are determined from the literature [11,39,47,49,50,48,52,51]. Where more than one antisera assay has been performed, the calculated distances are averaged. Error bars are calculated assuming binomial statistics for each data set: , where and . If two sets of data are averaged in one year, then .
| Year | Vaccine Strain | Circulating Strain | Vaccine Efficacy | Dominant Epitope | pepitope | psequence | d1 | d2 | Nu | Nv |
|---|---|---|---|---|---|---|---|---|---|---|
|
| ||||||||||
| 1971–72 | Aichi/2/68 (V01085) | HongKong/1/68 (AF201874) | 7 % [21] | A | 0.158 | 0.033 | 25202 | 26317 | ||
| 1972–73 | Aichi/2/68 (V01085) | England/42/72 (AF201875) | 15 % [21] | B | 0.190 | 0.055 | 26130 | 26779 | ||
| 1973–74 | England/42/72 (ISDNENG72) | PortChalmers/1/73 (AF092062) | 11 % [21] | B | 0.143 | 0.018 | 5 [11] | 4 [11] | 26536 | 28158 |
| 1975–76 | PortChalmers/1/73 (AF092062) | Victoria/3/75 (ISDNVIC75) | −3 % [21] | B | 0.190 | 0.055 | 4 [47] | 16 [47] | 25591 | 29247 |
| 1984–85 | Philippines/2/82 (AF233691) | Mississippi/1/85 (AF008893) | −6 % [22] | B | 0.190 | 0.033 | 2 [48] | 2 [48] | 241 | 171 |
| 1985–86 | Philippines/2/82 (AF233691) | Mississippi/1/85 (AF008893) | −2 % [23,24] | B | 0.190 | 0.033 | 2 [48] | 2 [48] | 253, 91 | 153, 88 |
| 1987–88 | Leningrad/360/86 (AF008903) | Shanghai/11/87 (AF008886) | 17 % [23,25] | B | 0.143 | 0.024 | 2 [48] | 1 [48] | 145, 1064 | 121, 1060 |
| 1989–90 | Shanghai/11/87 (AF008886) | England/427/88 (AF204238) | −5 % [25] | A | 0.105 | 0.021 | 1016 | 1016 | ||
| 1992–93 | Beijing/32/92 (AF008812) | Beijing/32/92 (AF008812) | 59 % [26] | 0.0 | 0.0 | 0 [49] | 0 [49] | 131 | 131 | |
| 1993–94 | Beijing/32/92 (AF008812) | Beijing/32/92 (AF008812) | 38 % [24] | 0.0 | 0.0 | 0 [49] | 0 [49] | 12 | 26 | |
| 1994–95 | Shangdong/9/93 (Z46417) | Johannesburg/33/94 (AF008774) | 25 % [27] | A | 0.108 | 0.021 | 424 | 422 | ||
| 1995–96 | Johannesburg/33/94 (AF008774) | Johannesburg/33/94 (AF008774) | 45 % [28] | 0.0 | 0.0 | 0 [50,51] | 0 [50,51] | 652 | 684 | |
| 1996–97 | Nanchang/933/95 (AF008725) | Wuhan/359/95 (AF008722) | 28 % [32] | B | 0.095 | 0.006 | 0 [50,51] | 0 [50,51] | 2978 | 273 |
| 1997 | Nanchang/933/95 (AF008725) | Wuhan/359/95 (AF008722) | 11 % [31] | B | 0.095 | 0.006 | 0 [50,51] | 0 [50,51] | 299 | 294 |
| 1997–98 | Nanchang/933/95 (AF008725) | Sydney/5/97 (AJ311466) | −17 % [30] | B | 0.238 | 0.040 | 4.5 [50,52] | 27.3 [50,52] | 554 | 576 |
| 1998–99 | Sydney/5/97 (AJ311466) | Sydney/5/97 (AJ311466) | 34 % [30] | 0.0 | 0.0 | 0 [39,50] | 0 [39,50] | 596 | 582 | |
| 1999–00 | Sydney/5/97 (AJ311466) | Sydney/5/97 (AJ311466) | 43 % [34] | 0.0 | 0.0 | 0 [39,50] | 0 [39,50] | 324 | 342 | |
| 2001–02 | Panama/2007/99 (ISDNCDA001) | Panama/2007/99 (ISDNCDA001) | 55 % [33] | 0.0 | 0.0 | 0 [39,50] | 0 [39,50] | 982 | 968 | |
| 2003–04 | Panama/2007/99 (ISDNCDA001) | Fujian/411/2002 (ISDN38157) | 12 % [35] | B | 0.143 | 0.040 | 2 [39] | 8 [39] | 402 | 1000 |
3 Results
Shown in figure 2 and table 1 are the experimental vaccine efficacies and the efficacies predicted by the theory as a function of pepitope. Vaccine efficacies are taken from the literature [21–35] and defined as
Fig. 2.

Vaccine efficacy for influenza-like illness as a function of pepitope as observed in epidemiological studies and as predicted by theory. Also shown is a linear least squares fit to the data (long dashed, R2 = 0.81). Error bars are one standard error, ε, calculated as described in Table 1.
| (2) |
where u is the influenza-like illness rate of unvaccinated individuals, and v is the influenza-like illness rate of vaccinated individuals. While the epidemiological estimates of u and v contain statistical noise, these are the best estimates available of vaccine efficacy in humans. The statistical mechanical model captures the essential physics of the immune response to influenza vaccination and demonstrates the value of using pepitope to define the degree of antigenic drift. Consideration of antigenic drift of the dominant epitope follows from immunoassays and crystallographic data that show only the epitope regions are significantly involved in immune recognition [36]. When the antigenic drift, pepitope, in the dominant epitope is greater than 0.19, according to historical records, or 0.22, according to theory, the vaccine efficacy becomes negative (see figure 2). This regime is to be avoided. For example, in the 1997/1998 northern hemisphere influenza season, when the Sydney/5/97 strain became widespread, pepitope = 0.238, and the vaccine efficacy was −17 % [30]. The only data point that falls significantly off the theory is that for the 1989/1990 epidemic [37], in which it is likely that multiple circulating strains were present, including influenza B strains [38,25].
When the vaccine efficacy is compared to the sequence difference of the entire hemagglutinin protein,
| (3) |
one current measure of antigenic drift used to construct phylogenetic relationships between circulating strains for the WHO February report [39], the correlation is far less apparent. These data are shown in figure 3 and table 1. Since much of the protein is inaccessible to antibodies or simply not recognized by human antibodies, drift in much of the protein sequence is not correlated with vaccine efficacy.
Fig. 3.

Vaccine efficacy as observed in epidemiological studies for influenza-like illness as a function of psequence (see eq. 3). Also shown is a linear least squares fit to the data (long dashed, R2 = 0.59). The epidemiological data shown in this figure are the same as in figure 2. Only the definition of the x-axis is different.
When the vaccine efficacy is compared to the antigenic distance derived from ferret antisera [11,12], the dominant current measure of antigenic drift used to confirm phylogenetic strain analysis [39], the correlation is again less apparent. These data are shown in figure 4 and table 1. It appears that the ferret antisera experiments capture no more information than does the analysis with psequence. A ferret-derived antigenic distance of zero does not always guarantee that the two strains are identical. For example, for the 1996/1997 vaccine strain of A/Nanchang/933/95 and circulating strain of A/Wuhan/359/95, the ferret-derived antigenic distance was zero, whereas, pepitope = 0.095, and the vaccine efficacy was 28% in the northern hemisphere [32] and 11% the next year in the southern hemisphere [31]. These values are much lower than the average for a perfect match between vaccine and circulating strains, which is 45%.
Fig. 4.

Vaccine efficacy for influenza-like illness as a function of two measures of antigenic distance, d1 [11] and d2 [12], derived from ferret antisera experiments. Experimental data were collected from a variety of sources [11,39,47,49,50,48,52,51]. Results were averaged when multiple hemagglutination inhibition (HI) studies had been performed for a given year. These HI binding assays measure the ability of ferret antisera to block the agglutination of red blood cells by influenza viruses. Also shown are linear least squares fits to the d1 (long dashed, R2 = 0.57) and d2 (short dashed, R2 = 0.43) data. The epidemiological data shown in this figure are the same as in figure 2. Only the definition of the x-axis is different.
4 Discussion
Vaccine design is done under considerable time pressure. At present, the WHO and national health agencies in the northern hemisphere determine the components of the annual flu vaccine between February and April. The vaccine is then produced by growing virus in hen’s eggs, and it is distributed in September after regulatory tests in mid-July [40]. Data collection relating to the effectiveness of the vaccine can begin in October, and by January a very good measure of the season’s vaccine has been obtained. The availability of high-growth reassortments from egg-cultured strains imposes additional constraints on the choice of possible vaccine strains. Given the constraints imposed by the biology and manufacturing process, one wishes to choose the strain that provides the best possible match to the anticipated circulating strain for the following season.
There are two ways in which pepitope can be used to improve vaccine development. The first is identification of “like” strains. Due to constraints of the manufacturing process, very often it is not feasible to produce in large quantity the exact strain of influenza that is desired for the vaccine. In this case, a similar, “like” strain is chosen from several possibilities. The value of pepitope can be used to quantify how close each of the “like” strains is to the desired vaccine strain. The second way in which pepitope can be used is identification of the strains desired to be included in the vaccine. That is, given a list of potential circulating strains, each with probabilities of outbreak for the upcoming year, which vaccine strain minimizes the weighted distance from the potential circulating strains? The value of pepitope can be used to define distance, and so to help choose the closest vaccine strain to the potential circulating strains. The value of pepitope might also help to design custom DNA-based vaccines that are as close as possible to a set of potential circulating strains. By applying the approach to the other strains of influenza through knowledge of the epitope regions, the value of pepitope can also quantify distance or “likeness” in other HxNy strains of influenza A or in influenza B strains.
We believe that the antigenic distance between strains would profitably be defined by world health professionals as pepitope (figure 2), in addition to or rather than by sequence distance (figure 3) or by ferret antisera assays (figure 4). Of importance to note is that the immune response is non-monotonic and non-linear in the antigenic distance, i.e. original antigenic sin or negative vaccine efficacy exists only for an intermediate antigenic distance. In this regime, the vaccine can induce a greater degree of susceptibility to flu-like illness in vaccinated individuals relative to unvaccinated individuals. This negative efficacy has occurred 26% of the time for circulating H3N2 strains in the last 33 years (5 of the 19 data points in table 1, figure 2 and figure 3 are negative). Thus, original antigenic sin can occur not only if an individual’s flu shot is not updated on an annual basis, but also even if an individual’s flu shot is updated yearly. The original antigenic sin regime is to be avoided both for the immunological consequences and for the negative impact of such a vaccine on public health policy acceptance. Our theory quantifies where the regime lies and lends additional credence to the experimental measurements of such negative vaccine efficacies. While negative efficacies have often been thought to be experimental error (and appear to be noise in figures 3 and 4), they are not. Negative efficacies appear only for large values of pepitope (see figure 2).
As an example of how our theory can be used to help guide public health policy, we apply it to the 2004/2005 northern hemisphere flu season. By using pepitope as the definition of antigenic distance, one may be quantitative about which strains will a priori be most protective, and so should be chosen for inclusion in the annual vaccine. For example, to combat the A/Fujian/411/2002 strain that was predominant in the 2003–2004 influenza epidemic, the FDA Advisory Council decided to use A/Wyoming/3/2003, a strain termed ‘antigenically equivalent’ to A/Fujian/411/2002, as the H3N2 component of the 2004–2005 vaccine [41]. Our analysis yields pepitope = 0.095 between these two strains, suggesting that the vaccine will have an efficacy of roughly 20% for influenza-like illness against the Fujian strain (see figure 2), and that these strains are not antigenically equivalent. Conversely, for A/Kumamoto/102/02 (ISDN38180), another available H3N2 component [42], we find pepitope = 0 versus A/Fujian/411/2002, suggesting this component would provide superior protection to Fujian than would the Wyoming strain.
Continuing this example of how our theory can be used in vaccine design, we show in figure 5 the calculated pepitope values and vaccine efficacies between recent influenza A H3N2 vaccine components and circulating strains. Many isolates from the 2004/2005 flu season have been A/Fujian/411/2002-like strains [43]. Another circulating strain that began to emerge in late 2004 is A/California/7/2004, and an A/California/7/2004-like strain is recommended as the influenza A component of the 2005/2006 northern hemisphere vaccine by the WHO [44], suggesting that this is an important strain to consider as an example. For individuals who received a vaccination in 2003/2004 (the A/Panama/2007/99 strain) and who were not exposed to the Fujian strain, their protection against the Fujian strain is low, and their protection against the California strain is predicted to be in the region of original antigenic sin. For individuals who were vaccinated in the 2004/2005 season (the A/Wyoming/3/2003 strain), their protection against the Fujian strain is moderate, but their protection against the California strain is again predicted to be in the region of original antigenic sin. For individuals who were exposed to the Fujian strain in 2003/2004 or 2004/2005, their protection against the California strain is predicted to be just in the region of original antigenic sin. The 2005 southern hemisphere vaccine strain was A/Wellington/1/2004. Our analysis yields pepitope = 0.143 between Wellington and California indicating the vaccine will provide a low level of protection against the California strain. These findings suggest that production of a new vaccine strain to combat A/California/7/2004 in the next flu season is essential. Persons who received a flu vaccine in 2003/2004 and/or 2004/2005 should be particularly encouraged to receive a flu shot in 2005/2006, as they may be more susceptible to this new strain than if they had not received their flu shot in the previous 2 years.
Fig. 5.

pepitope (blue) and estimated vaccine efficacy (black) from figure 2 between components used in the 2003/2004 and 2004/2005 vaccinations and circulating strains in the 2004/2005 season.
In order to calculate the antigenic distance optimally, the dominant human epitope in each strain is needed. In the present approach, the dominant human epitope for a particular circulating strain in a particular year was defined as the epitope that had the largest fractional change in amino acid sequence relative to the vaccine strain. The identity of the dominant human epitope is not currently measured. Measurement of which epitope is dominant for humans for each vaccine and circulating strain should increase the predictive ability of our approach, beyond that in figure 2. More epidemiological studies relating antigenic drift to vaccine efficacy are needed [45] and would help guide the management of health resources during the flu season. Since substantial costs are associated with lost work due to influenza among those in the 18–64 age bracket, large studies of this age range are both important and informative, due to lack of immunosenescence. Continuous measurement and sequencing of the dominant circulating strains during the flu season, combined with the theory of figure 2, should enable better prediction of the severity of the annual flu season and better design of the subsequent year’s vaccine.
More generally, our results have implications for the design of vaccines to combat rapidly mutating viral diseases that are controlled by antibody responses. We suggest that antigenic drift in the dominant epitope, pepitope, will provide a prediction measure of efficacy for such vaccines. This quantitative measure of efficacy may then be used to determine the frequency and nature of vaccine redesign that is necessary.
Acknowledgments
The authors thank Jonathan Hanson for writing the pepitope code [20]. This research was supported by the U.S. National Institutes of Health vaccine group and the National Science Foundation.
Appendix: The Generalized N K Model
Our theory of the immune response to vaccination and disease uses the generalized N K model [9] to calculate affinity constant values for the immune response to an antigen following vaccination. In this theory, the natural order parameter to distinguish between the vaccine strain and the circulating strain is the fraction of amino acids that differ in the dominant epitope region, pepitope. The model considers the diversity of an individual’s antibody repertoire and includes interactions within the antibody and between the antibody and the antigen. Here, the binding constant is determined as K = exp(a – b〈U 〉), where a = − 18.56 and b = 1.67 are found from a comparison of the dynamics of the model with experiment [9], and U is the energy function for an antibody and is defined as
| (4) |
The parameters within the generalized block N K model represent the number of secondary structures and the total size of the variable region [9]. We have L = 5 different subdomain energy functions of the N K form
| (5) |
where aj is the amino acid type of the jth amino acid in the subdomain, and αi is the type of the ith subdomain. As in previous studies, we consider the case where the range of the interactions within a subdomain is specified by K = 4 and there are N = 10 amino acids in each subdomain [46]. Here σαi is a quenched Gaussian random number with zero mean and a variance of unity, and it is different for each value of its argument for each of the L subdomain types, αi. The interaction energy between secondary subdomain structures is given by
| (6) |
Here M = 10 is the number of antibody secondary structural subdomains. We consider D = 6 interactions between secondary structures [46]. The zero-mean, unit-variance Gaussian and the interacting amino acids, j1, …, jK, are selected at random for each interaction (i, j, k). In our model, P = 5 amino acids contribute directly to an antigen binding event, where the chemical binding energy of each amino acid is given by
| (7) |
where the zero-mean, unit-variance Gaussian σi and the contributing amino acid, i, are chosen at random.
To model the immune system dynamics, we use 30 rounds of point mutation and selection to evolve our antibody sequences, which corresponds to an immune response of approximately 10 days. For each round of selection we conduct 0.5 point mutations per antibody sequence and amplify the best 20% of antibody sequences to form the starting population for the next round of selection. The secondary immune response following vaccination uses evolved memory sequences as well as naive cells, whereas the primary immune response uses only naive cells [9].
Footnotes
Competing Financial Interests Authors declare no competing financial interests.
References
- 1.World Health Organization. Media Centre Influenza Fact Sheet. 2003:211. http://www.who.int/mediacentre/factsheets/fs211/en/
- 2.Lave JR, Lin CJ, Fine MJ, Hughes-Cromick P. The cost of treating patients with community-acquired pneumonia. Sem Respir Crit Care Med. 1999;20:189–197. [Google Scholar]
- 3.Meltzer MI, Cox NJ, Fukuda K. The economic impact of pandemic influenza in the United States: Priorities for intervention. Emerg Infect Dis. 1999;5:659–671. doi: 10.3201/eid0505.990507. [DOI] [PMC free article] [PubMed] [Google Scholar]
- 4.Neuzil KM, Reed GW, Mitchel JEF, Griffin MR. Influenza-associated morbidity and mortality in young and middle-aged women. JAMA. 1999;281:901–907. doi: 10.1001/jama.281.10.901. [DOI] [PubMed] [Google Scholar]
- 5.Sprenger MJW, Mulder PG, Beyer WEP, VanStrik R, Masurel N. Impact of influenza on mortality in relation to age and underlying disease. Int J Epidemiol. 1993;22:334–340. doi: 10.1093/ije/22.2.334. [DOI] [PubMed] [Google Scholar]
- 6.Hak E, Nordin J, Wei F, Mullooly J, Poblete S, Strikas R, Nichol KL. Influence of high-risk medical conditions on the effectiveness of influenza vaccination among elderly members of 3 large managed-care organizations. CID. 2002;35:370–377. doi: 10.1086/341403. [DOI] [PubMed] [Google Scholar]
- 7.Davenport FM, Hennessy AV, Francis T. Epidemiologic and immunologic significance of age distribution of antibody to antigenic variants of influenza virus. J Exp Med. 1953;98:641–656. doi: 10.1084/jem.98.6.641. [DOI] [PMC free article] [PubMed] [Google Scholar]
- 8.Fazekas de St Groth S, Webster RG. Disquisition on original antigenic sin: Evidence in man. J Exp Med. 1966;124:331–345. doi: 10.1084/jem.124.3.331. [DOI] [PMC free article] [PubMed] [Google Scholar]
- 9.Deem MW, Lee HY. Sequence space localization in the immune system response to vaccination and disease. Phys Rev Lett. 2003;91:068101. doi: 10.1103/PhysRevLett.91.068101. [DOI] [PubMed] [Google Scholar]
- 10.Smith DJ, Lapedes AS, de Jong JC, Bestebroer TM, Rimmelzwaan GF, Osterhaus ADME, Fouchier RAM. Mapping the antigenic and genetic evolution of influenza virus. Science. 2004;305:371–376. doi: 10.1126/science.1097211. [DOI] [PubMed] [Google Scholar]
- 11.Smith DJ, Forrest S, Ackley DH, Perelson AS. Variable efficacy of repeated annual influenza vaccination. Proc Natl Acad Sci USA. 1999;96:14001–14006. doi: 10.1073/pnas.96.24.14001. [DOI] [PMC free article] [PubMed] [Google Scholar]
- 12.Lee MS, Chen JSE. Predicting antigenic variants of influenza A/H3N2 viruses. Emerg Infect Dis. 2004;10:1385–1390. doi: 10.3201/eid1008.040107. [DOI] [PMC free article] [PubMed] [Google Scholar]
- 13.Ault A. Shifting tactics in the battle against influenza. Science. 2003;303:1280. doi: 10.1126/science.303.5662.1280. [DOI] [PubMed] [Google Scholar]
- 14.Bush RM, Fitch WM, Bender CA, Cox NJ. Positive selection on the H3 hemagglutinin gene of human influenza virus A. Mol Biol Evol. 1999;16:1457–1465. doi: 10.1093/oxfordjournals.molbev.a026057. [DOI] [PubMed] [Google Scholar]
- 15.Macken C, Lu H, Goodman J, Boykin L. The value of a database in surveillance and vaccine selection. In: Osterhaus ADME, Cox N, Hampson AW, editors. Options for the Control of Influenza IV. Elsevier Science; 2001. hemagglutinin H3 epitope structural mapping. http://www.flu.lanl.gov/ [Google Scholar]
- 16.Fitch WM, Leiter JM, Li X, Palese P. Positive Darwinian evolution in human influenza A viruses. Proc Natl Acad Sci USA. 1991;88:4270–4274. doi: 10.1073/pnas.88.10.4270. [DOI] [PMC free article] [PubMed] [Google Scholar]
- 17.Bush RM, Bender CA, Subbarao K, Cox NJ, Fitch WM. Predicting the evolution of human influenza A. Science. 1999;286:1921–1925. doi: 10.1126/science.286.5446.1921. [DOI] [PubMed] [Google Scholar]
- 18.Plotkin JB, Dushoff J. Codon bias and frequency-dependent selection on the hemagglutinin epitopes of influenza A virus. Proc Natl Acad Sci USA. 2003;100:7152–7157. doi: 10.1073/pnas.1132114100. [DOI] [PMC free article] [PubMed] [Google Scholar]
- 19.Fitch WM, Butch RM, Bender CA, Subbarao K, Cox NJ. Predicting the evolution of human influenza A. The Journal of Heredity. 2000;91:183–185. doi: 10.1093/jhered/91.3.183. [DOI] [PubMed] [Google Scholar]
- 20.www.mwdeem.rice.edu/pepitope
- 21.Smith JW, Pollard R. Vaccination against influenza: A five-year study in the post office. J Hyg. 1979;83:157–170. doi: 10.1017/s0022172400025936. [DOI] [PMC free article] [PubMed] [Google Scholar]
- 22.Keitel WA, Cate TR, Couch RB. Efficacy of sequential annual vaccination with inactivated influenza virus vaccine. Am J Epidemiol. 1988;127:353–364. doi: 10.1093/oxfordjournals.aje.a114809. [DOI] [PubMed] [Google Scholar]
- 23.Keitel WA, Cate TR, Couch RB, Huggins LL, Hess KR. Efficacy of repeated annual immunization with inactivated influenza virus vaccines over a five year period. Vaccine. 1997;15:1114–1122. doi: 10.1016/s0264-410x(97)00003-0. [DOI] [PubMed] [Google Scholar]
- 24.Demicheli V, Rivetti D, Deeks J, Jefferson T. Vaccines for preventing influenza in healthy adults. Cochrane Database Syst Rev. 2004;3:CD001269. doi: 10.1002/14651858.CD001269.pub2. [DOI] [PubMed] [Google Scholar]
- 25.Edwards KM, Dupont WD, Westrich MK, Plummer WD, Jr, Palmer PS, Wright PF. A randomized controlled trial of cold-adapted and inactivated vaccines for the prevention of influenza A disease. J Infect Dis. 1994;169:68–76. doi: 10.1093/infdis/169.1.68. [DOI] [PubMed] [Google Scholar]
- 26.Campbell DS, Rumley MH. Cost-effectiveness of the influenza vaccine in a healthy working-age population. J Occup Environ Med. 1997;39:408–414. doi: 10.1097/00043764-199705000-00006. [DOI] [PubMed] [Google Scholar]
- 27.Nichol KL, Lind A, Margolis KL, Murdoch M, McFadden R, Hauge M, Magnan S, Drake M. The effectiveness of vaccination against influenza in healthy, working adults. N Engl J Med. 1995;333:889–893. doi: 10.1056/NEJM199510053331401. [DOI] [PubMed] [Google Scholar]
- 28.Grotto I, Mandel Y, Green MS, Varsano N, Gdalevich M, Ashkenazi I, Shemer J. Influenza vaccine efficacy in young, healthy adults. Clin Infect Dis. 1998;26:913–917. doi: 10.1086/513934. [DOI] [PubMed] [Google Scholar]
- 29.Clements ML, Betts RF, Tierney EL, Murphy BR. Resistance of adults to challenge with influenza A wild-type virus after receiving live or inactivated virus vaccine. J Clin Microbiol. 1986;23:73–76. doi: 10.1128/jcm.23.1.73-76.1986. [DOI] [PMC free article] [PubMed] [Google Scholar]
- 30.Bridges CB, Thompson WW, Meltzer MI, Reeve GR, Talamonti WJ, Cox NJ, Lilac HA, Hall H, Klimov A, Fukuda K. Effectiveness and cost-benefit of influenza vaccination of healthy working adults: A randomized controlled trial. J Am Med Assoc. 2000;284:1655–1663. doi: 10.1001/jama.284.13.1655. [DOI] [PubMed] [Google Scholar]
- 31.Mixeu MSAG, Vespa CNR, Forleo-Neto E, Toniolo-Neto J, Alves PM. Impact of influenza vaccination on civilian aircrew illness and absenteeism. Aviat Space Environ Med. 2002;73:876–880. [PubMed] [Google Scholar]
- 32.Millot JL, Aymard M, Bardol A. Reduced efficiency of influenza vaccine in prevention of influenza-like illness in working adults: A 7 month prospective survey in EDF Gaz de France employees, in Rhone-Alpes, 1996–1997. Occup Med-Oxford. 2002;52:281–292. doi: 10.1093/occmed/52.5.281. [DOI] [PubMed] [Google Scholar]
- 33.Kawai N, Ikematsu H, Iwaki N, Satoh I, Kawashima T, Tsuchimoto T, Kashiwagi S. A prospective, internet-based study of the effectiveness and safety of influenza vaccination in the 2001–2002 influenza season. Vaccine. 2003;21:4507–4513. doi: 10.1016/s0264-410x(03)00508-5. [DOI] [PubMed] [Google Scholar]
- 34.Lester RT, McGeer A, Tomlinson G, Detsky AS. Use of, effectiveness of, attitudes regarding influenza vaccine among house staff. Infect Cont Hosp Epidem. 2003;24:839–844. doi: 10.1086/502146. [DOI] [PubMed] [Google Scholar]
- 35.Dolan S, Nyquist AC, Ondrejka D, Todd J, Gershman K, Alexander J, Bridges C, Copeland J, David F, Euler G, Gargiullo P, Kenyan K, Moore Z, Seward J, Jain N. Preliminary assessment of the effectiveness of the 2003–4 inactivated influenza vaccine—Colorado, Denver 2003. Centers for Disease Control and Prevention Morbidity and Mortality Weekly Report. 2004;53(1):8–11. [PubMed] [Google Scholar]
- 36.Air GM, Els MC, Brown LE, Laver WG, Webster RG. Location of antigenic sites on the three-dimensional structure of the influenza N2 virus neuraminidase. Virology. 1985;145:237–248. doi: 10.1016/0042-6822(85)90157-6. [DOI] [PubMed] [Google Scholar]
- 37.Nguyen-Van-Tam JS, Hampson AW. The epidemiology and clinical impact of pandemic influenza. Vaccine. 2003;21:1762–1768. doi: 10.1016/s0264-410x(03)00069-0. [DOI] [PubMed] [Google Scholar]
- 38.Ikonen N, Kinnunen L, Forsten T, Pyhala R. Recent influenza B viruses in Europe: A phylogenetic analysis. Clin Diag Virol. 1996;6:63–71. doi: 10.1016/0928-0197(96)00201-2. [DOI] [PubMed] [Google Scholar]
- 39.Cox N, Balish A, Brammer L, Fukuda K, Hall H, Klimov A, Lindstrom S, Mabry J, Perez-Oronoz G, Postema A, Shaw M, Smith C, Subbarao K, Wallis T, Xijan X. Information for the Vaccines and Related Biological Products Advisory Committee, CBER, FDA, WHO Collaborating Center for Surveillance Epidemiology and Control of Influenza. Centers for Disease Control; 2003. [Google Scholar]
- 40.Gerdil C. The annual production cycle for influenza vaccine. Vaccine. 2003;21:1776–1779. doi: 10.1016/s0264-410x(03)00071-9. [DOI] [PubMed] [Google Scholar]
- 41.Harper SA, Fukuda K, Uyeki TM, Cox NJ, Bridges CB. Recommendations of the advisory committee in immunization practices. Centers for Disease Control and Prevention Morbidity and Mortality Weekly Report. 2004;53(RR06):1–40. [PubMed] [Google Scholar]
- 42.WHO. Weekly Epidemiological Record. 2004;79:88–92. [Google Scholar]
- 43.WHO. Weekly Epidemiological Record. 2004;79:369–376. [Google Scholar]
- 44.WHO. Weekly Epidemiological Record. 2005;80:71–76. [Google Scholar]
- 45.Centers for Disease Control and Prevention. Call: Annual Influenza Vaccine Effectiveness Estimates in Healthy and High-risk Populations. Centers for Disease Control; Atlanta, GA: 2004. [Google Scholar]
- 46.Bogarad LD, Deem MW. A hierarchical approach to protein molecular evolution. Proc Natl Acad Sci USA. 1999;96:2591–2595. doi: 10.1073/pnas.96.6.2591. [DOI] [PMC free article] [PubMed] [Google Scholar]
- 47.Both GW, Sleigh MJ, Cox NJ, Kendal AP. Antigenic drift in influenza virus H3 hemagglutinin from 1968 to 1980: Multiple evolutionary pathways and sequential amino acid changes at key antigenic sites. J Virol. 1983;48:52–60. doi: 10.1128/jvi.48.1.52-60.1983. [DOI] [PMC free article] [PubMed] [Google Scholar]
- 48.WHO. Weekly Epidemiological Record. 1988;63:57–59. [Google Scholar]
- 49.Ellis JS, Chakraverty P, Clewley JP. Genetic and antigenic variation in the haemagglutinin of recently circulating human influenza A (H3N2) viruses in the United Kingdom. Arch Virol. 1995;140:1889–1904. doi: 10.1007/BF01322680. [DOI] [PubMed] [Google Scholar]
- 50.Coiras MT, Aguilar JC, Galiano M, Carlos S, Gregory V, Lin YP, Hay A, Perez-Brena P. Rapid molecular analysis of the haemagglutinin gene of human influenza A H3N2 viruses isolated in Spain from 1996 to 2000. Arch Virol. 2001;146:2133–2147. doi: 10.1007/s007050170025. [DOI] [PubMed] [Google Scholar]
- 51.Information for FDA vaccine advisory panel meeting. Centers for Disease Control; Atlanta, GA: 1997. [Google Scholar]
- 52.Pontoriero AV, Baumeister EG, Campos AM, Savy VL, Lin YP, Hay AJ. Pan Am J Public Health. 2001;9:246–253. doi: 10.1590/s1020-49892001000400007. [DOI] [PubMed] [Google Scholar]