

Abstract
Obesity is an important risk factor for asthma but the mechanistic basis for this association is not well understood. In the current study, the impact of obesity on lung inflammatory responses after allergen exposure was investigated. C57BL/6 mice maintained on a high-fat diet (HFD) or a normal diet (ND) after weaning were sensitized and challenged with cockroach allergen (CRA). Airway inflammation was assessed based on inflammatory cell recruitment, measurement of lung Th1-Th2 cytokines, chemokines, eicosanoids, and other proinflammatory mediators as well as airway hyperresponsiveness (AHR). CRA-challenged mice fed a HFD exhibited significantly decreased allergen-induced airway eosinophilia along with reduced lung IL-5, IL-13, LTC4, CCL11, and CCL2 levels as well as reduced mucus secretion and smooth muscle mass compared to ND fed mice. However, allergen-challenged HFD fed mice demonstrated significantly increased PAI-1 and reduced PGE2 levels in the lung relative to corresponding ND fed mice. Interestingly, saline-exposed HFD fed mice demonstrated elevated baseline levels of TGF-α1, arginase-1, hypoxia-inducible factor-1α, and lung collagen expression associated with decreased lung function compared to corresponding ND fed mice. These studies indicate that a HFD inhibits airway eosinophilia while altering levels of PAI-1 and PGE2 in response to CRA in mice. Further, a HFD can lead to the development of lung fibrosis even in the absence of allergen exposure which could be due to innate elevated levels of specific profibrotic factors, potentially affecting lung function during asthma.
Keywords: allergic inflammation, fibrogenic factors, obesity, reduced eosinophilia, Th2 cytokines
INTRODUCTION
Studies in humans and in mouse models have established that obesity is an important risk factor for asthma [1] and is associated with increased severity as well as poor asthma control relative to non-obese asthmatics despite similar symptoms perception scores in humans [2, 3]. Obesity has been shown to be associated with an increased risk for development of airway hyperresponsiveness (AHR) in humans [4]. Further, mice with obesity due to a genetic deficiency or exposure to a high-fat diet (HFD) demonstrate innate AHR to methacholine [5, 6]. In further support, weight loss in severely obese patients with asthma was shown to improve respiratory symptoms and lung function [7, 8]. Taken together, these findings suggest that asthma in the obese is associated with impaired lung function.
While the connection between obesity and the incidence of asthma is well established, the mechanistic basis for this is still not entirely clear. Further, the effect of obesity on inflammatory cell recruitment remains conflicted. For instance, similar to obese patients with difficult-to-treat asthma where body mass index was inversely related to sputum eosinophils [9], studies in mice that are obese either due to a genetic deficiency [5] or a HFD [10] have demonstrated decreased recruitment of inflammatory cells, especially eosinophils, to the airways after allergen (ovalbumin [OVA]) exposure compared to normal mice. In contrast, other studies have shown that OVA-challenged HFD fed obese mice or genetically modified (leptin-deficient ob/ob) mice exhibit enhanced eosinophilopoiesis and eosinophil recruitment from bone marrow (BM) to lung tissues with delayed transit into the airway lumen and longer presence in lung peribronchiolar segments due to overproduction of Th1/Th2 cytokines and chemokines [11, 12]. In support of this, treatment of human eosinophils with physiological concentrations of leptin, an adipokine that is elevated during obesity, increased their migration toward eotaxin in vitro [13]. More recently, studies in mice have shown that diet-induced obesity (DIO) results in increased airway eosinophilia and enhanced lung remodeling resulting in higher AHR in experimental chronic allergic asthma [14]. Additionally, mice deficient in adiponectin, an anti-inflammatory adipokine that increases insulin sensitivity and is reduced during obese conditions, demonstrated increased accumulation of eosinophils in the airways after OVA challenge compared with wild-type (WT) mice, although it is important to note that these mice were not obese [15].
Asthma in the humans who are obese is recognized as a unique phenotype that is associated with AHR and lack of eosinophilic inflammation [16, 17], although the underlying mechanistic basis for this remains poorly understood. In the present study, we have evaluated the development of allergic airway inflammation in the setting of obesity in mice maintained on a HFD in terms of inflammatory cell recruitment, production of inflammatory mediators, profibrogenic factors and AHR after exposure to cockroach allergen (CRA), an allergen known to contribute to increased asthma morbidity, especially in inner-city lower socioeconomic groups [18] among whom obesity is also a major concern [19].
MATERIALS AND METHODS
Mouse Strain and Diet
C57BL/6J male mice bred in-house were maintained on a HFD with 60% kcalories from fat (F3282, Bio-Serv, Frenchtown, NJ) after weaning at 3 weeks. Another group of age and gender matched C57BL/6J mice were fed the standard normal diet (ND) with 18% kcalories from fat (Harlan Laboratories, Madison, WI). Both groups of mice fed ad libitum. All studies involving mice were performed following standards and procedures approved by the Institutional Animal Care and Use Committee at the University of Minnesota.
Induction of allergic airway inflammation
After 12 weeks, mice were sensitized by two routes (i.p. and s.c.) with 10 μg of CRA (Hollister Stier, Spokane, WA) and 1 mg of aluminum hydroxide in saline (day 0). One week later (day 7), mice received a second injection (s.c.) of 1 μg CRA containing 0.5 mg of aluminum hydroxide in saline. On day 14 and 21, mice were challenged (i.n.) with 1 and 4 μg of CRA, respectively. Control mice were sensitized with aluminum hydroxide in saline and were challenged with saline instead of CRA. Mice were maintained on their respective diets throughout the study. After 24 hours of the last challenge, mice were weighed and assessed for the development of allergic airway inflammation.
Measurement of airway responsiveness
According to the previously published protocols [20, 21], pulmonary function in saline and allergen-exposed mice fed a HFD or ND was assessed by invasive plethysmography (FinePointe™ RC system, Buxco, Wilmington, NC). Changes in pulmonary resistance (RL) and dynamic compliance (Cdyn) in response to saline followed by increasing concentrations of inhaled methacholine (3–50 mg/mL) were continuously monitored. RL and Cdyn values at 50 mg/mL of inhaled methacholine are shown.
Blood, bronchoalveolar lavage fluid (BALF), and lung tissue collection
Blood was collected in the presence of buffered citrate from mice (non-fasting) by cardiac puncture after euthanasia. Samples were centrifuged and the plasma collected was stored at −80°C for subsequent assays. Lungs were lavaged with 1 mL of saline. Total and differential cell counts in the BALF were determined based on morphological criteria from cytospin slides stained with Hema 3 staining system (Fisher Diagnostics, Middletown, VA). For further evaluation, BALF supernatant was stored at −80°C. Right lungs were snap-frozen and stored at −80°C while left lungs were perfused with 4% paraformaldehyde to preserve pulmonary structure, fixed in 4% paraformadehyde for 48 hours at 4°C and paraffin-embedded.
Measurement of total cholesterol and triglycerides
Plasma triglyceride and total cholesterol levels were measured by the Clinical Pathology Laboratory at the College of Veterinary Medicine, University of Minnesota, using a Beckman AU480 chemistry analyzer (Beckman Coulter, Inc., Brea, CA).
Measurement of CCL11, CCL2, and TGF-β1
According to the manufacturers' recommendations, levels of CCL11 (eotaxin-1), CCL2 (MCP-1), and TGF-β1 in BALF were measured using ELISA kits (R&D Systems, Minneapolis, MN). Optical density of the color developed was measured at 450/570 nm with a microplate reader (FLUOstar OPTIMA, BMG LABTECH, Durham, NC) and the concentration of each chemokine in the BALF was determined against a standard curve generated. Detection limit for each cytokine was 15.6 pg/mL
Measurement of lung Th1/Th2 cytokines
Protein concentration in supernatants of lung tissue homogenates prepared in lysis buffer (PBS containing 1% Triton X-100, 2 mM PMSF, and protease inhibitors) was measured (BCA Protein Assay Kit, Pierce Biotechnology, Rockford, IL). Th1 (IL-2 and IFN-γ)/Th2 (IL-4, IL-5, IL-13) cytokine and TNF-α levels in the supernatants were determined using Flex Set kits (BD Biosciences, San Diego, CA), according to the manufacturer with a FACScan flow cytometer equipped with CellQuest Pro™ Software (BD Biosciences) for data acquisition and FlowJo Software (Tree Star, Inc., Ashland, OR) for analysis or a FACSCanto II flow cytometer (for IL-13) with FACSDiva™ Software for data acquisition and analysis. Level of each cytokine was expressed as pg cytokine/mg protein.
Lung Histology
Paraffin-embedded tissue sections (4 μm thick) were stained with Harris Modified Hematoxylin and Shandon Instant Eosin (Thermo Fisher Scientific Co., Pittsburgh, PA) to determine cellular infiltration. Stained slides were examined using a Nikon Microphot EPI-FL microscope and images were captured with an Olympus DP71 camera. Analysis for infiltrated eosinophils was performed by immunohistochemical staining of sections for eosinophil-specific major basic protein (MBP) with rat mAb against murine MBP as described in our previous studies [22]. Positively stained cells were counted and expressed as the average number of MBP-positive cells/microscopic field (magnification of × 400). Expression of α-smooth muscle actin (SMA) was evaluated using mAb against murine SMA and the area of the peribronchial smooth muscle layer was quantitated by ImageJ image analysis system as described earlier [23]. Results were expressed as SMA-positive area (μm2) per mm basement membrane length (BML). Arginase-1 expression was evaluated using goat polyclonal antibodies against human arginase-1 (2 μg/mL, Santa Cruz Biotechnology, Inc., Santa Cruz, CA) [24] and quantitated by ImageJ. Results were expressed as arginase-1 positive area (μm2) per 100 μm BML. Expression of TGF-β1 was detected with rabbit polyclonal antibodies against TGF-β1 [23]. Rat IgG (for MBP), mouse IgG (for SMA), rabbit IgG (for TGF-β1), or goat IgG (for arginase-1) were used as control antibodies. Airway mucus production assessed by staining lung sections with periodic acid-Schiff's (PAS) reagent (Sigma-Aldrich®, St. Louis, MO) was quantitated by ImageJ and expressed as PAS-positive area (μm2) per 100 μm BML. Masson's trichrome stain (Sigma-Aldrich®) was used to assess lung collagen deposition. A total of 4–6 images of randomly selected non-overlapping fields were captured per lung section at ×40 magnification and the area of trichrome-positive staining in the captured images was measured using Fiji, an image processing package based on ImageJ [25]. Results are expressed as trichrome positive area (μm2) per field.
Western blot analysis
Lung tissue was homogenized in radioimmunoprecipitation assay (RIPA) buffer and total protein in the supernatants was measured (BCA Protein Assay Kit, Thermo Fisher Scientific Co.). Expression of PAI-1, TGF-β1, and hypoxia-inducible factor (HIF)-1α in lung lysates was evaluated using 20 (for HIF-1α), 40 (for PAI-1), or 80 (for TGF-β1) μg protein per lane. Rabbit polyclonal antibodies against PAI-1 (0.4 μg/mL), TGF-β1 (1 μg/mL), or HIF-1α (0.2 μg/mL, all from Santa Cruz Biotechnology, Inc.) followed by HRP-conjugated goat anti-rabbit IgG (1:5000, Cell Signaling Technology, Danvers, MA) were used for detection of protein bands. HRP-conjugated anti-mouse β-actin (1:5000, Santa Cruz Biotechnology, Inc.) was used for monitoring the levels of β-actin expression in lung tissue as an internal control. Bound antibodies were detected using Immobilon Western Chemiluminescent HRP substrate (Millipore Corporation, Billerica, MA) and bands were visualized on X-ray films, which were then scanned and analyzed using ImageJ. Density of PAI-1, TGF-β1 (25 kD mature/active form), and HIF-1α bands was normalized against β-actin after background subtraction in each case.
Evaluation of eicosanoids
Lung tissue eicosanoids were assessed as described previously [26]. Homogenized lung tissue (30–60 mg) was spiked with 1 pmol each of deuterated internal standards (15S-HETE-d8, PGE2, and LTC4-d5), vortexed and centrifuged at 4000 g for 10 minutes at 4°C. The aqueous phase was loaded onto Strata-X solid phase extraction columns (Phenomenex, Torrance, CA) conditioned with methanol and equilibrated with water. Proteins and other polar molecules were removed by washing columns with water and eicosanoids were eluted with methanol. The eluate was freeze-dried, resuspended in methanol and analyzed by Liquid Chromatography-Mass Spectrometry (LC-MS/MS) analysis (Shimadzu Prominence 2D HPLC coupled to an AB/Sciex API 4000 QTrap MS spectrometer) [27]. Chromatographic separations were achieved using a 2.1 × 100 mm Agilent Zorbax Eclipse C18 column with a 3.5 micron particle size by gradient elution with solvent A (70:30:0.1 water:acetonitrile:acetic acid) and solvent B (50:50 acetonitrile:isopropanol) at a flow rate of 400 μL/minute (0–1 minutes 0% solvent B, 10–15 minutes 100% B, 16–23 minutes 0%B). Mass spectrometry data were collected using multiple reaction monitoring in negative mode. Desolvation and initial ion focusing was achieved using electrospray ionization with ionspray voltage of −4500 V, declustering potential of −70 V and entrance potential of −10 V. Eicosanoids of interest were fragmented using collision-induced dissociation with collision energy of −30 V. All analytes were quantified using stable isotope dilution. Level of eicosanoid was expressed as ng/g lung tissue.
Statistical Analysis
Results are expressed as mean ± SEM. Statistical significance was determined using the unpaired Student's t-test. A P value less than 0.05 was considered as significant. To adjust for multiple comparisons, a Bonferroni correction was applied and a P value less than 0.0125 (0.05/4) was used to assess statistical significance. However, to highlight any differences that might be nonsignificant after applying a Bonferroni correction but significant by Student's t-test, P value determined by Student's t-test and the Bonferroni adjusted P value are provided in the section “Results”.
RESULTS
Mice Fed a HFD Exhibit Decreased Cellular Inflammation After Allergen Challenge
Mice maintained on a HFD for 9 weeks after weaning were significantly heavier than mice on a ND at the time of exposure to CRA (38.96 ± 0.927 [HFD] versus 29.13 ± 0.9 [ND], P < .001, Bonferroni adjusted P < .0125). After allergen challenge (12 weeks on diet), HFD fed mice exhibited a 30% increase in body weight compared to ND fed mice and exposure to CRA did not have any effect on body weight in either group (Figure 1A). Previous studies have shown that C57Bl/6 mice maintained on a HFD for 9–12 weeks as in the present study demonstrate weight gain, increased adiposity and fasting blood glucose levels along with impaired glucose tolerance and insulin responsiveness [28]. In the current study, associated with the increased body weight, HFD fed mice had higher non-fasting plasma total cholesterol levels relative to ND mice which remained unaltered after CRA challenge (121.2 ± 11.3 [HFD saline] and 81.25 ± 11.4 [ND saline] versus 127 ± 10.8 [HFD CRA] and 88.0 ± 8.9 [ND CRA], P < .01, Bonferroni adjusted P < .0125). Plasma triglyceride levels, however, were similar in all four groups of mice (124.1 ± 16.5 [HFD saline] and 102.7 ± 6.9 [HFD CRA] versus 117.2 ± 27.5 [HFD saline] and 100.4 ± 15.7 [HFD CRA]). These values appear to be consistent with previous reports where mice were fed a HFD either identical to the one used in our study [29, 30] or a comparable HFD [11]. In ND fed mice, a prominent increase in cellular inflammation was evident in the airways after CRA challenge, as indicated by an increased number of inflammatory cells in the BALF (Figure 1, B, #P < .001, Bonferroni adjusted P < .0125) and peribronchial lung tissue (Figure 1C, [H&E stain]). In contrast, in the CRA-challenged HFD fed mice, although cellular recruitment to the airways was higher than in the corresponding saline-exposed group, it was significantly lower than in CRA-challenged ND fed mice (Figure 1, B, **P < .001, Bonferroni adjusted P < .0125).
FIGURE 1.

Decreased airway cellular inflammation in HFD fed mice after allergen challenge. Mice weaned at 3 weeks were maintained on a ND or a HFD for 9 weeks and then sensitized and challenged with CRA. Control mice received saline instead of CRA. Mice were maintained on the assigned diets during allergen exposure. (A) Body weight of ND and HFD fed mice measured at the end of allergen challenge. (B) Total cell counts in BALF of CRA-challenged and saline-exposed mice 24 hours after the last challenge. (C) Cellular infiltration of lungs evaluated by H&E staining of paraffin embedded lung sections. Representative images from each group at a magnification of ×100 are shown. Arrows highlight positively stained (purple) inflammatory cells. Data represent mean ± SEM. Combined data of n = 6–9 ND fed and 11–15 HFD fed mice is shown in A and B. *P < .01 in A for comparison of saline-exposed ND and HFD fed mice; #P < .001 in B for comparison of saline versus CRA-challenged mice; **P < .01 in A and P < .001 in B for comparison of CRA-challenged ND and HFD fed mice.
Differential Leukocyte Recruitment to the Lungs of ND and HFD Fed CRA-Challenged Mice and AHR
Differential cell counts indicated that the number of eosinophils, neutrophils, and lymphocytes, but not macrophages, in the BALF of CRA-challenged ND mice was significantly higher than in saline-exposed mice (Figure 2A, left and right panels, #P < .005, Bonferroni adjusted P < .0125). CRA-challenged HFD mice on the other hand, exhibited an increase only in the number of BALF neutrophils (#P < .04, Bonferroni adjusted P > .0125) and macrophages (#P < .001, Bonferroni adjusted P < .0125) compared to corresponding control mice (Figure 2A, right panel). Importantly, the number of eosinophils, neutrophils, and lymphocytes were significantly lower in CRA-challenged HFD fed mice than in the ND fed counterparts (**P < .002, Bonferroni adjusted P < .0125). No significant difference was observed in the number of BALF macrophages between the CRA-challenged groups (Figure 2A, right panel). Lung tissue MBP-positive eosinophils were also markedly higher in allergen-challenged ND fed mice compared to saline-exposed mice (Figure 2B and C, #P < .001, Bonferroni adjusted P < .012). While the number of eosinophils in the lungs of allergen-challenged HFD mice was also higher than in corresponding control mice (#P < .03, Bonferroni adjusted P > .0125), it was significantly lower relative to allergen-challenged ND fed mice (**P < .002, Bonferroni adjusted P < .0125).
FIGURE 2.

Reduced airway eosinophilia in CRA-challenged HFD fed mice. (A) Differential cell counts in BALF of saline and CRA-challenged ND and HFD fed mice 24 hours after the last challenge. Eosinophil [Eos] counts are shown in the left panel; macrophage [Macros], neutrophil [Neu], and lymphocyte [Lymphs] counts are shown in the right panel. Note difference in scale. (B and C) Lung tissue eosinophils assessed by immunohistochemical staining of sections from saline and CRA-challenged ND and HFD mice with rat mAb against murine MBP. Representative images for each group at a magnification of ×200 are shown. Arrows highlight reddish-brown stained MBP-positive cells. MBP-positive cells in 10–15 randomly selected non-overlapping microscopic fields were counted at a magnification of ×400 and expressed as the average number of cells/field. (D) Measurement of AHR in response to methacholine challenge by invasive plethysmography. RL and Cdyn to inhaled methacholine at 50 mg/mL are shown. Data represent mean ± SEM. Combined data of n = 6–9 ND fed and 11–16 HFD fed mice in A, 6–7 ND fed mice and 5–10 HFD fed mice in C, and 7–8 ND fed and 6–9 HFD fed mice is shown in D. #P < .005 in ND fed group for Eos, Neu, and Lymphs, P < .04 for Neu and P < .001 for Macros in HFD fed group in A, P < .001 in ND fed group and P < .03 in HFD fed group in C, and P < .01 in ND and HFD fed group in D, upper panel and P < .01 in ND group in D, lower panel for comparison of saline versus CRA-challenged mice; *P < .01 for comparison of saline-exposed ND and HFD fed mice in D; **P < .002 in A and C for comparison of CRA-challenged ND and HFD fed mice.
Consistent with increased recruitment of inflammatory cells, CRA-challenged ND fed mice exhibited increased AHR as demonstrated by the elevated RL in response to inhaled methacholine at 50 mg/mL relative to corresponding saline-exposed mice by invasive plethysmography (Figure 2D, upper panel, #P < .001, Bonferroni adjusted P < .0125 for ND CRA versus ND saline). Surprisingly, despite the reduced cellular inflammation and eosinophilia, CRA-challenged HFD fed mice also exhibited increased RL relative to corresponding saline-exposed mice (#P = .009, Bonferroni adjusted P < 0.125 for HFD CRA versus HFD saline) similar to ND fed mice. More interestingly, saline-exposed HFD fed mice demonstrated inherently higher RL compared to saline-exposed ND fed mice at 50 mg/mL inhaled methacholine (*P = .006, Bonferroni adjusted P < .0125 for HFD saline versus ND saline). Further, while CRA-challenged ND fed mice exhibited reduced Cdyn compared to saline-exposed mice (Figure 2D, lower panel, #P < .001, Bonferroni adjusted P < .0125 for ND CRA versus ND saline), Cdyn was found to be inherently low in saline-exposed HFD fed mice compared to saline-exposed ND fed mice (*P = .002, Bonferroni adjusted P < .0125) and was similar to Cdyn in CRA-challenged HFD fed mice. These results suggest that HFD fed mice may be predisposed to AHR independent of allergen-induced airway inflammation.
Allergen-Challenged HFD Fed Mice Exhibit Reduced Lung Cytokine, Chemokine, and Eicosanoid Levels
Since allergic airway inflammation is mediated by a specific cytokine milieu, we assessed levels of the major Th1/Th2 cytokines and the proinflammatory cytokine TNF-α in lung tissue (Table 1). Maintenance on a HFD by itself did not appear to alter the levels of Th1/Th2 cytokines relative to a ND since the levels of these cytokines were similar in HFD and ND fed mice after saline exposure. CRA challenge did not significantly alter lung IFN-γ, IL-2, or IL-4 levels in either group relative to their respective control groups. However, in allergen-challenged HFD fed mice, IL-5 and IL-13 expression in lung tissue was found to be lower compared to allergen-challenged ND fed mice (Table 1, **P < .03 and < .02, respectively, Bonferroni adjusted P > .0125 for both) as was that of TNF-α (**P = .008, Bonferroni adjusted P < .0125). In addition, level of CCL11 and CCL2 was significantly suppressed in allergen-challenged HFD fed mice compared to corresponding ND fed mice (Table 1, **P < .001, Bonferroni adjusted P < .0125), correlating with the relative reduction in lung tissue eosinophils (Figure 2) and macrophages (data not shown) in these mice.
TABLE 1.
Lung Cytokine, Chemokine, and Eicosanoid levels in CRA-challenged HFD and ND fed mice
| ND |
HFD |
|||
|---|---|---|---|---|
| Mediator | Saline | CRA | Saline | CRA |
| IFNγa | 0.13±0.15 | 1.36±0.63 | 0.32±0.58 | 0.0±0.0 |
| IL-2a | 3.88±0.6 | 16.76±11.58 | 5.81±0.32 | 4.66±0.46 |
| IL-4a | 3.35±0.53 | 3.66±0.7 | 5.04±0.28 | 4.0±0.38 |
| IL-5a | 1.79±0.27 | 62.8±22.49# | 2.36±0.16 | 4.62±1.53** |
| IL-13a | 2.0±0.68 | 208.33±63.47# | 2.0±0.53 | 2.0±0.34** |
| TNF-αa | 2.04±2.48 | 23.22±7.48# | 0.5±0.5 | 0.5±0.5** |
| CCL11b | 17.3±7.45 | 72.29±7.04# | 11.08±3.3 | 8.61±5.2** |
| CCL2b | 48.27±2.64 | 77.12±7.89# | 25.0±5.71 | 23.25±2.7** |
| LTC4c | 3.24±1.05 | 40.69±18.72# | 2.42±0.72 | 1.78±0.86** |
| PGE2c | 53.12±29.17 | 59.51±17.5 | 57.91±18.29 | 14.87±4.79#** |
pg/mg protein in lung tissue,
pg/ml BALF,
ng/g lung tissue.
P < .03 for IL-5 and IL-13, P < .02 for TNF-α, P < .01 for CCL11 and CCL2 and P < .04 for LTC4 in ND fed mice and P < .03 for PGE2 in HFD fed mice for comparison of saline versus CRA-challenged groups;
P < .03 for IL-5, P < .02 for IL-13 and PGE2, P < .01 for TNF-α, P < .001 for CCL11 and CCL2, and P < .04 for LTC4 for comparison of CRA-challenged HFD versus ND mice.
Since leukotrienes and eicosanoids are known mediators of inflammatory responses in allergic asthma [31], LTC4 and PGE2 in the lungs of CRA-challenged HFD and ND fed mice was measured (Table 1). CRA challenge increased LTC4 levels in ND fed mice relative to saline controls (#P < .04, Bonferroni adjusted P > .0125) but failed to induce LTC4 expression in HFD fed mice, with LTC4 levels in the latter group being lower than in CRA-challenged ND fed mice (**P < .04, Bonferroni adjusted P > .0125 for ND CRA versus HFD CRA). Further, while CRA-challenge had no effect on lung PGE2 levels in ND fed mice, levels of this eicosanoid in CRA-challenged HFD fed mice were lower compared to the corresponding saline-exposed group (#P < .03, Bonferroni adjusted P > .0125) as well as CRA-challenged ND fed mice (**P < .02, Bonferroni adjusted P > .0125).
Increased Expression of TGF-β1 in Airways of HFD Fed Mice
In addition to the various cytokines and chemokines, we evaluated expression of TGF-β1 in the lungs of allergen-challenged ND and HFD fed mice since TGF-β1 plays an important role in the regulation of allergen-induced airway inflammation and remodeling [32]. TGF-β1 levels in BALF of CRA-challenged ND fed mice were significantly higher compared to corresponding control mice (Figure 3A, #P < .012, Bonferroni adjusted P < .0125). Surprisingly, TGF-β1 levels in saline-exposed HFD fed mice were elevated and higher than in saline-exposed ND fed mice (*P < .025, Bonferroni adjusted P > .0125). More importantly, in spite of the reduced cellular inflammation in CRA-challenged HFD fed mice, TGF-β1 levels were as high as in CRA-challenged ND mice. Lung tissue TGF-β1 levels in HFD fed mice by Western blot analysis indicated similar trends (Figure 3B, *P < .025, Bonferroni adjusted P > .0125 for HFD saline versus ND saline). Further, immunohistology of lung tissue from CRA-challenged ND fed mice revealed that inflammatory cells recruited to the airways are a major source for TGF-β1 followed by airway epithelial and endothelial cells (Figure 3C). In HFD fed mice with decreased cellular inflammation, airway epithelial cells appear to be the major cell type associated with TGF-β1 expression followed by endothelial cells. More intense staining was observed in the airway epithelium of saline-exposed and CRA-challenged HFD fed mice in comparison to the airway epithelium of ND fed counterparts. Overall, TGF-β1 levels in the lungs of HFD fed mice are inherently elevated.
FIGURE 3.

HFD fed mice exhibit increased TGF-β1 expression. (A) TGF-β1 levels in BALF from saline and CRA-challenged ND and HFD fed mice by ELISA. (B) TGF-β1 expression in lung tissue of saline and CRA-challenged ND and HFD fed mice by Western blot analysis using polyclonal antibodies against TGF-β1 followed by densitometry. Densitometry data is normalized against expression of β-actin used as an internal control. TGF-β1 expression in lung tissue from a representative mouse for each group is shown adjacent to the bar graph. (C) TGF-β1 expression in lung tissue from saline and CRA-challenged ND and HFD fed mice (n = 3 mice for saline group and 5 mice for CRA-challenged group) was detected by immunohistochemistry with polyclonal antibodies = against TGF-β1. Representative images from each group at a magnification of ×200 are shown. Arrows highlight structures with positive staining (brown). (D) Total lung collagen was evaluated by Masson's Trichrome staining of lung sections from saline and CRA-challenged ND and HFD fed mice. Trichrome-positive areas (3–8 microscopic fields/slide) were quantitated using Fiji software (an image processing package based on ImageJ). Representative images (magnification ×100) are shown for saline and CRA-challenged groups below bar graph. Arrows highlight areas with positive staining for × collagen (blue). Data represent mean SEM. Combined data of n = 5–7 mice/group in A and 3–6 mice/group in B is shown. In D, combined data of all fields for each group representing n = 5–6 mice for saline group and 7–8 mice for CRA-challenged group is shown. #P < .012 in the ND fed group in A for comparison of saline versus CRA-challenged mice; *P < .025 in A and B for comparison of saline-exposed ND and HFD fed mice. **P < .04 in D for comparison CRA-challenged ND and HFD fed mice.
TGF-β1 is known to induce collagen expression and promote subepithelial fibrosis resulting in tissue remodeling in asthmatic airways [33]. Since levels of this profibrogenic mediator appear to be inherently elevated in the lungs of HFD fed mice, we investigated whether HFD fed mice exhibit inherent fibrosis by evaluating total lung collagen deposition using Masson's trichrome stain (Figure 3D). No difference was observed in the trichrome-positive area between the CRA-challenged and saline-exposed groups in ND fed mice. This is not surprising since increased collagen deposition is largely observed in remodeled lungs in response to chronic and not acute allergen exposure. Interestingly, trichrome-positive area in saline-exposed and CRA-challenged HFD fed mice tended to be greater than in corresponding ND fed counterparts (**P < .04, Bonferroni adjusted P > .0125 for ND CRA versus HFD CRA). These findings are suggestive of increased collagen deposition in the lungs of HFD fed mice regardless of allergen exposure.
Expression of PAI-1, HIF-1α, and Arginase-1 in Lungs of HFD Fed Mice
Expression of PAI-1, which is elevated during obesity [34] and is known to contribute to the pathogenesis of asthma by promoting extracellular matrix deposition and lung remodeling [35], was evaluated. PAI-1 levels in lung tissue of saline-exposed ND and HFD fed mice were not significantly different nor did CRA-challenge induce PAI-1 expression in ND fed mice (Figure 4A), however, PAI-1 levels in CRA-challenged HFD fed mice were significantly higher not only compared to corresponding saline-exposed mice (#P < .012, Bonferroni adjusted P < .0125) but also CRA-challenged ND fed mice (**P < .012, Bonferroni adjusted P < .0125). Next, we examined expression of HIF-1α, given that it plays a role in promoting allergic airway inflammation [36] and in inducing fibrosis [37]. CRA challenge markedly induced HIF-1α expression in the lungs of ND fed mice compared to saline-exposed mice consistent with increased allergen-induced airway inflammation (Figure 4B, #P < .012, Bonferroni adjusted P < .0125). Interestingly, in HFD fed mice, HIF-1α expression in the saline-exposed group was higher than in saline-exposed ND fed mice (*P < .05, Bonferroni adjusted P > .0125) and similar to levels in the corresponding CRA-challenged group. Expression of arginase-1, another molecule known to be increased in asthma and contribute to airway remodeling [38] was examined by immunohistology. CRA challenge induced arginase-1 expression in ND fed mice by both airway epithelial cells as well as inflammatory cells (Figure 4C, left panels). In HFD fed mice, arginase-1 expression was largely noted in the airway epithelium (Figure 4C, right panels). Since CRA-challenged HFD fed mice exhibit reduced recruitment of inflammatory cells in the lung tissue compared to ND fed mice, arginase-1 expression in the airway epithelium of HFD and ND fed mice was quantitated (Figure 4D). Airway epithelial arginase-1 expression in saline-exposed HFD fed mice was significantly higher than in ND fed counterparts (*P < .012, Bonferroni adjusted P < .0125). In contrast to ND fed mice where CRA induced arginase-1 expression (#P < .012, Bonferroni adjusted P < .0125 for ND saline versus ND CRA), CRA challenge did not further induce airway epithelial arginase-1 expression in a significant manner in the HFD fed group. These data suggest that basal arginase-1 levels are elevated in HFD fed mice.
FIGURE 4.

Expression of PAI-1, HIF-1α, and arginase-1 in HFD fed mice. PAI-1 (A) and HIF-1α (B) expression in lung tissue of saline and CRA-challenged ND and HFD fed mice by Western blot analysis using polyclonal antibodies against PAI-1 and HIF-1α, respectively, followed by densitometry. Densitometry data are normalized against expression of β-actin. PAI-1 and HIF-1α expression in lung tissue from a representative mouse for each group is shown below bar graph in A and B, respectively. (C) Arginase-1 expression by immunohistochemical staining of lung sections from saline and CRA-challenged ND and HFD fed mice with polyclonal antibodies against arginase-1. Representative images (magnification × 200) are shown for saline and CRA-challenged groups with arrows highlighting arginase-1 positive staining (brown). (D) Quantitation of arginase-1 expression in airway epithelium by ImageJ analysis (5–9 airways/slide). Data represent mean ± SEM. Combined data of n = 4–6 mice/group is shown in A, B, and D. #P < .012 in the HFD fed group in A and in the ND fed group in B and D for comparison of saline versus CRA-challenged mice; *P < .05 in B and P < .01 in D for comparison of saline-exposed ND and HFD fed mice; **P < .012 in A for comparison of CRA-challenged ND and HFD fed mice.
Mucus Secretion and Smooth Muscle Mass are Reduced in Airways of Allergen-Challenged HFD Fed Mice
Mucus hypersecretion, which can lead to plugging and airflow limitation during allergic airway inflammation [39] was examined (Figure 5, A). In contrast to CRA-exposed ND fed mice that demonstrate increased mucus production relative to saline-exposed mice (#P < .01, Bonferroni adjusted P < .0125), no mucus secretion was detected in CRA-challenged HFD fed mice (**P < .01, Bonferroni adjusted P < .0125 for ND CRA versus HFD CRA) and was similar to that observed in corresponding saline-exposed mice. We also examined airway smooth muscle (ASM) mass in these mice since ASM hyperplasia and hypertrophy is observed during allergen-induced airway inflammation [40]. Immunohistology revealed that although ASM mass in CRA-challenged HFD fed mice was higher than in corresponding control mice (Figure 5, B, #P < .05, Bonferroni adjusted P > .0125), it was lower than in CRA-challenged ND fed mice (**P < .02, Bonferroni adjusted P > .0125).
FIGURE 5.
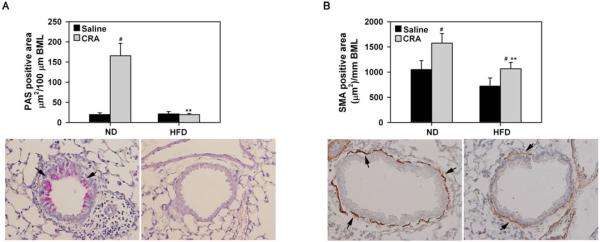
Decreased mucus secretion and smooth muscle mass in lungs of HFD fed mice after CRA challenge. (A) Airway epithelial mucus secretion was examined after PAS staining of lung tissue sections from saline and CRA-challenged ND and HFD fed mice. PAS-positive area in airways (3–13 airways/slide with perimeter 700 ± 21.3 μm) was quantitated by ImageJ analysis of captured images. Representative images (magnification × 200) with arrows highlighting PAS-positive staining (pink) in airways are shown for CRA-challenged groups below bar graph. (B) Area of the smooth muscle layer was quantitated based on immunohistochemical staining for α-SMA in lung sections from the above groups of mice followed by ImageJ analysis of captured images (4–17 airways/slide with perimeter 676.6 ± 16.3 μm). Representative images (magnification × 200) are shown for CRA-challenged groups below bar graph with arrows highlighting airway α-SMA-positive cells (brown). Data represent mean × SEM. In A and B, combined data of all airways for each group representing n = 3–4 mice for saline group and 5–6 mice for CRA-challenged ± group is shown. #P < .01 in the ND fed group in A, P < .03 in the ND fed group and P < .05 in the HFD fed group in B for comparison of saline versus CRA-challenged mice; *P < .01 in A, and P < .02 in B for comparison of CRA-challenged ND and HFD fed mice.
DISCUSSION
While several studies have established a connection between obesity and asthma, the mechanistic basis is unclear and questions as to how obesity or increased weight gain might cause or worsen asthma remain unanswered. However, one consistent finding is that relative to non-obese conditions, asthma in the obese is associated with increased AHR and worsening lung function both in humans [1, 4, 16, 41] and mice [5, 6]. In the current study, we evaluated the impact of increased weight gain on the development of airway inflammation in response to CRA, a common inner city allergen, in mice maintained on a HFD for 12 weeks.
CRA challenge resulted in the development of airway eosinophilia (BALF and lung tissue) associated with elevated levels of lung Th2 cytokines (IL-5, IL-13), TNF-α, CCL11, CCL2, and LTC4 as well as mucus hypersecretion and smooth muscle hyperplasia in ND fed mice. However, in comparison to ND fed counterparts, airway eosinophilia in the CRA-challenged HFD fed mice was markedly attenuated as were levels of IL-5, IL-13, TNF-α, CCL11, CCL2, and LTC4 as well as mucus secretion and smooth muscle hypertrophy. Reduced airway eosinophilia in CRA-challenged HFD fed mice relative to corresponding ND mice may be due to decreased trafficking and recruitment from the BM. This is supported by the finding that IL-5, CCL11, and LTC4, which are important for eosinophil release from the BM [42] and recruitment to inflammatory sites [43, 44], are present at significantly lower levels in CRA-challenged HFD fed mice than in ND fed mice. A previous study in HFD fed mice challenged with OVA also demonstrated decreased lung eosinophilia and IL-5 [10], even though another study in DIO mice with the same allergen demonstrated increased lung tissue eosinophils, BALF IL-5, eoatxin-1, and TNF-α levels [11]. However, even in this latter study, eosinophils in the BALF were significantly reduced in OVA-challenged HFD fed mice relative to ND fed mice similar to the previous finding as well as ours. Exposure of DIO mice to chronic OVA challenge on the other hand has been shown to result in increased eosinophil recruitment [14]. On the whole, parameters such as duration on HFD (12 weeks [current study], 8 weeks [10], or 10 weeks [11]) and consequently the variations in increase in body weight of the animals as well as the type and concentration of allergen (CRA versus OVA) and duration of exposure (acute versus chronic) are all likely to affect the outcome in terms of systemic and lung inflammatory responses, thus accounting for these varying observations.
Despite the reduced airway eosinophilia and attenuated Th2 cytokine response, CRA-challenged HFD fed mice demonstrated increased RL and decreased Cdyn in response to methacholine challenge similar to CRA-challenged ND fed mice. This is somewhat similar to the asthma phenotype described in obese humans where there is AHR with lack of eosinophilic inflammation [16, 17]. Surprisingly, even saline-exposed HFD fed mice demonstrated significantly decreased Cdyn relative to corresponding ND fed mice suggesting that obesity or increased weight gain by itself may play a role in reducing pulmonary volume and/or elasticity even in the absence of allergen exposure. Previous studies suggest that abnormal fibrosis associated with increased collagen occurs in adipose tissue during the development of obesity [45]. We found that lung collagen expression in saline-exposed HFD fed mice tended to be higher than in corresponding ND fed mice and correlated with expression of TGF-β1, a known inducer of collagen expression [46], which was higher in BALF and lung tissue of saline-exposed HFD fed mice relative to corresponding ND fed mice. Although inflammatory cells such as eosinophils and macrophages constitute a significant source of TGF-β1 in allergic airways [33], in the absence of a strong influx of inflammatory cells in HFD fed CRA-challenged mice, airway epithelial cells appear to be a significant source for TGF-β1 in these mice. Further, TGF-β1 expression is known to be elevated in adipose tissue [47].
Recent studies have shown that asthmatic patients with increased body weight and diminished lung function have elevated PAI-1 levels, suggesting that the negative association between obesity and poor lung function may in part be mediated by PAI-1 [48]. PAI-1 plays a role in increasing collagen deposition during allergic asthma [35] and promoting AHR as well as airway remodeling [49]. While CRA challenge resulted only in a modest increase in PAI-1 expression in comparison to the saline-exposed group in the lungs of ND fed mice, PAI-1 levels in CRA-challenged HFD fed mice were significantly higher relative to corresponding saline-exposed mice as well as allergen-challenged ND fed mice. The striking increase in PAI-1 levels in this group may be a combined effect of allergen exposure as well as that of leptin, which is elevated during obesity and is known to upregulate PAI-1 expression [50]. Additionally, like TGF-β1, airway epithelial cells in saline-exposed HFD fed mice expressed significantly higher levels of arginase-1 than corresponding ND fed mice. Arginase is an enzyme that converts L-arginine into L-ornithine and urea. Increased arginase activity resulting in increased synthesis of L-ornithine, which is a precursor of L-proline, is thought to contribute to fibrotic disorders in the lung by promoting collagen production during disease progression [38, 51]. In support of our observation, studies have shown that arginase-1 expression is significantly upregulated in peritoneal macrophages of mice on HFD [52] and in blood mononuclear cells from obese subjects [53]. HIF-1α is another molecule that not only promotes allergic airway inflammation in mice and is elevated in asthmatics [36] but is also known to induce fibrosis by increasing collagen expression particularly in adipose tissue [37]. While saline-exposed ND fed mice expressed low levels of HIF-1α in the lungs that were induced only after CRA challenge, baseline HIF-1α expression in saline-exposed HFD fed mice was inherently high. Further, as in the case of TGF-β1 and arginase 1, CRA challenge did not significantly alter HIF-1α expression in HFD fed mice relative to the saline-exposed group.
Interestingly, PGE2 levels in CRA-challenged HFD fed mice were significantly reduced relative to not only saline-exposed HFD mice but also CRA-challenged ND fed mice. PGE2, a lipid mediator that is synthesized by virtually all cell types in the lung, is known to induce relaxation of the airways via interaction with the EP2 receptor in mice [54]. It is possible that decreased PGE2 levels might contribute to the increased AHR associated with asthma in an obese setting. How expression of PGE2 might be altered after allergen challenge in an obese setting is not entirely clear. One possibility could be PAI-1. There is a marked increase in PAI-1 expression in the lungs of CRA-challenged HFD mice compared to ND fed counterparts. Studies with fibroblasts indicate that activation of plasminogen stimulates PGE2 release and basal production of PGE2 in Pai−/− fibroblasts was found to be higher than in WT cells [55]. It is conceivable that elevated PAI-1 levels may inhibit plasminogen activation resulting in decreased PGE2 levels in the lungs of CRA-challenged HFD mice. However, additional studies are needed to confirm this.
Overall, our findings lead us to infer that the underlying mechanisms contributing to pulmonary inflammation after CRA exposure are distinct in ND and HFD fed mice. In ND fed mice, airway inflammation is caused by eosinophilia, elevated inflammatory mediators (cytokines, chemokines, growth factors, etc.), mucus hypersecretion and smooth muscle hypertrophy after allergen challenge that can contribute to the increased AHR. Further, pulmonary edema associated with this inflammatory response can cause loss of surfactant and infiltration of the interstitium by inflammatory cells potentially making the lungs less elastic. On the other hand, in HFD fed mice with minimal inflammation, factors such as innate (obesity-induced) lung fibrosis due to dysfunction of extracellular matrix metabolism (elevated collagen deposition) that can be attributed to elevated baseline levels of pro-fibrotic factors such as TGF-β, arginase-1 and HIF-1α along with altered levels of the biological mediators PGE2 and PAI-1 after allergen exposure are likely to result in impaired lung function. Further, our findings demonstrate that a HFD does not worsen allergic airway inflammation induced by CRA in the present study, although a different allergen (fungal, dust, pollen, etc.) may provoke alternate antigen-specific effects. Overall our studies suggest that HFD can potentiate the development of lung fibrosis that may contribute to poor asthma control in obese individuals.
Acknowledgments
This work was supported by National Institutes of Health grants AI35796 (PS) and DK053189 (DAB), and a University of Minnesota AHC Faculty Research Development Grant (PS and DAB).
Footnotes
Declaration of interest: The authors report no conflicts of interest. The authors alone are responsible for the content and writing of the paper.
REFERENCES
- [1].Shore SA. Obesity, airway hyperresponsiveness, and inflammation. J Appl Physiol. 2010;108:735–743. doi: 10.1152/japplphysiol.00749.2009. [DOI] [PMC free article] [PubMed] [Google Scholar]
- [2].Akerman MJ, Calacanis CM, Madsen MK. Relationship between asthma severity and obesity. J Asthma. 2004;41:521–526. doi: 10.1081/jas-120037651. [DOI] [PubMed] [Google Scholar]
- [3].Lessard A, Turcotte H, Cormier Y, Boulet LP. Obesity and asthma: a specific phenotype? Chest. 2008;134:317–323. doi: 10.1378/chest.07-2959. [DOI] [PubMed] [Google Scholar]
- [4].Sharma S, Tailor A, Warrington R, Cheang M. Is obesity associated with an increased risk for airway hyperresponsiveness and development of asthma? Allergy Asthma Clin Immunol. 2008;4:51–58. doi: 10.1186/1710-1492-4-2-51. [DOI] [PMC free article] [PubMed] [Google Scholar]
- [5].Johnston RA, Zhu M, Rivera-Sanchez YM, Lu FL, Theman TA, Flynt L, Shore SA. Allergic airway responses in obese mice. Am J Respir Crit Care Med. 2007;176:650–658. doi: 10.1164/rccm.200702-323OC. [DOI] [PMC free article] [PubMed] [Google Scholar]
- [6].Johnston RA, Theman TA, Lu FL, Terry RD, Williams ES, Shore SA. Diet-induced obesity causes innate airway hyperresponsiveness to methacholine and enhances ozone-induced pulmonary inflammation. J Appl Physiol. 2008;104:1727–1735. doi: 10.1152/japplphysiol.00075.2008. [DOI] [PubMed] [Google Scholar]
- [7].Maniscalco M, Zedda A, Faraone S, Cerbone MR, Cristiano S, Giardiello C, Sofia M. Weight loss and asthma control in severely obese asthmatic females. Respir Med. 2008;102:102–108. doi: 10.1016/j.rmed.2007.07.029. [DOI] [PubMed] [Google Scholar]
- [8].Dixon AE, Pratley RE, Forgione PM, Kaminsky DA, Whittaker-Leclair LA, Griffes LA, Garudathri J, Raymond D, Poynter ME, Bunn JY, Irvin CG. Effects of obesity and bariatric surgery on airway hyperresponsiveness, asthma control, and inflammation. J Allergy Clin Immunol. 2011;128:508–515. doi: 10.1016/j.jaci.2011.06.009. [DOI] [PMC free article] [PubMed] [Google Scholar]
- [9].Van Veen IH, Ten Brinke A, Sterk PJ, Rabe KF, Bel EH. Airway inflammation in obese and nonobese patients with difficult-to-treat asthma. Allergy. 2008;63:570–574. doi: 10.1111/j.1398-9995.2007.01597.x. [DOI] [PubMed] [Google Scholar]
- [10].de Vries A, Hazlewood L, Fitch PM, Seckl JR, Foster P, Howie SE. High-fat feeding redirects cytokine responses and decreases allergic airway eosinophilia. Clin Exp Allergy. 2009;39:731–739. doi: 10.1111/j.1365-2222.2008.03179.x. [DOI] [PubMed] [Google Scholar]
- [11].Calixto MC, Lintomen L, Schenka A, Saad MJ, Zanesco A, Antunes E. Obesity enhances eosinophilic inflammation in a murine model of allergic asthma. Br J Pharmacol. 2010;159:617–625. doi: 10.1111/j.1476-5381.2009.00560.x. [DOI] [PMC free article] [PubMed] [Google Scholar]
- [12].Lintomen L, Calixto MC, Schenka A, Antunes E. Allergen-induced bone marrow eosinophilopoiesis and airways eosinophilic inflammation in leptin-deficient ob/ob mice. Obesity (Silver Spring) 2012;20:1959–1965. doi: 10.1038/oby.2012.93. [DOI] [PubMed] [Google Scholar]
- [13].Kato H, Ueki S, Kamada R, Kihara J, Yamauchi Y, Suzuki T, Takeda M, Itoga M, Chihara M, Ito W, Kayaba H, Chihara J. Leptin has a priming effect on eotaxin-induced human eosinophil chemotaxis. Int Arch Allergy Immunol. 2011;155:335–344. doi: 10.1159/000321195. [DOI] [PubMed] [Google Scholar]
- [14].Saraiva SA, Silva AL, Xisto DG, Abreu SC, Silva JD, Silva PL, Teixeira TP, Parra ER, Carvalho ALN, Annoni R, Mauad T, Capelozzi VL, Silva PMR, Martins MA, Rocco PRM. Impact of obesity on airway and lung parenchyma remodeling in experimental chronic allergic asthma. Respir Physiol Neurobiol. 2011;177:141–148. doi: 10.1016/j.resp.2011.03.019. [DOI] [PubMed] [Google Scholar]
- [15].Medoff BD, Okamoto Y, Leyton P, Weng M, Sandall BP, Raher MJ, Kihara S, Bloch KD, Libby P, Luster AD. Adiponectin deficiency increases allergic airway inflammation and pulmonary vascular remodeling. Am J Respir Cell Mol Biol. 2009;41:397–406. doi: 10.1165/rcmb.2008-0415OC. [DOI] [PMC free article] [PubMed] [Google Scholar]
- [16].Beuther DA. Obesity and asthma. Clin Chest Med. 2009;30:479–488. doi: 10.1016/j.ccm.2009.05.002. [DOI] [PubMed] [Google Scholar]
- [17].Sideleva O, Black K, Dixon AE. Effects of obesity and weight loss on airway physiology and inflammation in asthma. Pulm Pharmacol Ther. 2013;26:455–458. doi: 10.1016/j.pupt.2012.05.002. [DOI] [PMC free article] [PubMed] [Google Scholar]
- [18].Arruda LK, Vailes LD, Ferriani VP, Santos AB, Pomés A, Chapman MD. Cockroach allergens and asthma. J Allergy Clin Immunol. 2001;107:419–428. doi: 10.1067/mai.2001.112854. [DOI] [PubMed] [Google Scholar]
- [19].O'Loughlin J, Paradis G, Meshefedjian G, Gray-Donald K. A five-year trend of increasing obesity among elementary schoolchildren in multiethnic, low-income, inner-city neighborhoods in Montreal, Canada. Int J Obes Relat Metab Disord. 2000;24:1176–1182. doi: 10.1038/sj.ijo.0801362. [DOI] [PubMed] [Google Scholar]
- [20].Bahaie NS, Hosseinkhani RM, Ge XN, Kang BN, Ha SG, Blumenthal MN, Jessberger R, Rao SP, Sriramarao P. Regulation of eosinophil trafficking by SWAP-70 and its role in allergic airway inflammation. J Immunol. 2012;188:1479–1490. doi: 10.4049/jimmunol.1102253. [DOI] [PMC free article] [PubMed] [Google Scholar]
- [21].Suzukawa M, Morita H, Nambu A, Arae K, Shimura E, Shibui A, Yamaguchi S, Suzukawa K, Nakanishi W, Oboki K, Kajiwara N, Ohno T, Ishii A, Korner H, Cua DJ, Suto H, Yoshimoto T, Iwakura Y, Yamasoba T, Ohta K, Sudo K, Saito H, Okumura K, Broide DH, Matsumoto K, Nakae S. Epithelial cell-derived IL-25, but Not Th17 Cell-Derived IL-17 or IL-17F, is crucial for Murine Asthma. J Immunol. 2012;189:3641–3652. doi: 10.4049/jimmunol.1200461. [DOI] [PMC free article] [PubMed] [Google Scholar]
- [22].Zuberi RI, Ge X, Jiang S, Bahaie NS, Kang BN, Hosseinkhani RM, Frenzel EM, Fuster MM, Esko JD, Rao SP, Sriramarao P. Deficiency of endothelial heparan sulfates attenuates allergic airway inflammation. J Immunol. 2009;183:3971–3979. doi: 10.4049/jimmunol.0901604. [DOI] [PMC free article] [PubMed] [Google Scholar]
- [23].Ge XN, Bahaie NS, Kang BN, Hosseinkhani RM, Ha SG, Frenzel EM, Liu FT, Rao SP, Sriramarao P. Allergen-induced airway remodeling is impaired in galectin-3 deficient mice. J Immunol. 2010;185:1205–1214. doi: 10.4049/jimmunol.1000039. [DOI] [PMC free article] [PubMed] [Google Scholar]
- [24].North ML, Khanna N, Marsden PA, Grasemann H, Scott JA. Functionally important role for arginase 1 in the airway hyperresponsiveness of asthma. Am J Physiol - Lung Cell Mol Physiol. 2009;296:L911–L920. doi: 10.1152/ajplung.00025.2009. [DOI] [PubMed] [Google Scholar]
- [25].Schindelin J, Arganda-Carreras I, Frise E, Kaynig V, Longair M, Pietzsch T, Preibisch S, Rueden C, Saalfeld S, Schmid B, Tinevez J-Y, White DJ, Hartenstein V, Eliceiri K, Tomancak P, Cardona A. Fiji: an open-source platform for biological-image analysis. Nat Meth. 2012;9:676–682. doi: 10.1038/nmeth.2019. [DOI] [PMC free article] [PubMed] [Google Scholar]
- [26].Blaho VA, Buczynski MW, Brown CR, Dennis EA. Lipidomic analysis of dynamic eicosanoid responses during the induction and resolution of lyme arthritis. J Biol Chem. 2009;284:21599–21612. doi: 10.1074/jbc.M109.003822. [DOI] [PMC free article] [PubMed] [Google Scholar]
- [27].Buczynski MW, Stephens DL, Bowers-Gentry RC, Grkovich A, Deems RA, Dennis EA. TLR-4 and sustained calcium agonists synergistically produce eicosanoids independent of protein synthesis in RAW264.7 cells. J Biol Chem. 2007;282:22834–22847. doi: 10.1074/jbc.M701831200. [DOI] [PubMed] [Google Scholar]
- [28].Baar RA, Dingfelder CS, Smith LA, Bernlohr DA, Wu C, Lange AJ, Parks EJ. Investigation of in vivo fatty acid metabolism in AFABP/aP2(−/−) mice. Am J Physiol Endocrinol Metab. 2005;288:E187–E193. doi: 10.1152/ajpendo.00256.2004. [DOI] [PubMed] [Google Scholar]
- [29].Drolet M-C, Roussel E, Deshaies Y, Couet J, Arsenault M. A high fat/high carbohydrate diet induces aortic valve disease in C57BL/6J mice. J Am Coll Cardiol. 2006;47:850–855. doi: 10.1016/j.jacc.2005.09.049. [DOI] [PubMed] [Google Scholar]
- [30].Jo J, Gavrilova O, Pack S, Jou W, Mullen S, Sumner AE, Cushman SW, Periwal V. Hypertrophy and/or hyperplasia: dynamics of adipose tissue growth. PLoS Comput Biol. 2009;5:e1000324. doi: 10.1371/journal.pcbi.1000324. [DOI] [PMC free article] [PubMed] [Google Scholar]
- [31].Schmidt D, Rabe KF. The role of leukotrienes in the regulation of tone and responsiveness in isolated human airways. Am J Respir Crit Care Med. 2000;161:S62–S67. doi: 10.1164/ajrccm.161.supplement_1.ltta-13. [DOI] [PubMed] [Google Scholar]
- [32].Bottoms SE, Howell JE, Reinhardt AK, Evans IC, McAnulty RJ. TGF-b isoform specific regulation of airway inflammation and remodelling in a murine model of asthma. PLoS ONE. 2010;5:e9674. doi: 10.1371/journal.pone.0009674. [DOI] [PMC free article] [PubMed] [Google Scholar]
- [33].Halwani R, Al-Muhsen S, Al-Jahdali H, Hamid Q. Role of transforming growth factor-b in airway remodeling in asthma. Am J Respir Cell Mol Biol. 2011;44:127–133. doi: 10.1165/rcmb.2010-0027TR. [DOI] [PubMed] [Google Scholar]
- [34].Alessi MC, Poggi M, Juhan-Vague I. Plasminogen activator inhibitor-1, adipose tissue and insulin resistance. Curr Opin Lipidol. 2007;18:240–245. doi: 10.1097/MOL.0b013e32814e6d29. [DOI] [PubMed] [Google Scholar]
- [35].Oh CK, Ariue B, Alban RF, Shaw B, Cho SH. PAI-1 promotes extracellular matrix deposition in the airways of a murine asthma model. Biochem Biophys Res Commun. 2002;294:1155–1160. doi: 10.1016/S0006-291X(02)00577-6. [DOI] [PubMed] [Google Scholar]
- [36].Huerta-Yepez S, Baay-Guzman GJ, Bebenek IG, Hernandez-Pando IG, Vega R, Chi MI, Riedl L, Diaz-Sanchez D, Kleerup E, Tashkin DP, Gonzalez FJ, Bonavida B, Zeidler M, Hankinson O. Hypoxia inducible factor promotes murine allergic airway inflammation and is increased in asthma and rhinitis. Allergy. 2011;66:909–918. doi: 10.1111/j.1398-9995.2011.02594.x. [DOI] [PMC free article] [PubMed] [Google Scholar]
- [37].Halberg N, Khan T, Trujillo ME, Wernstedt-Asterholm I, Attie AD, Sherwani S, Wang ZV, Landskroner-Eiger S, Dineen S, Magalang UJ, Brekken RA, Scherer PE. Hypoxia-inducible factor 1a induces fibrosis and insulin resistance in white adipose tissue. Mol Cell Biol. 2009;29:4467–4483. doi: 10.1128/MCB.00192-09. [DOI] [PMC free article] [PubMed] [Google Scholar]
- [38].Maarsingh H, Dekkers BGJ, Zuidhof AB, Bos IST, Menzen MH, Klein T, Flik G, Zaagsma J, Meurs H. Increased arginase activity contributes to airway remodelling in chronic allergic asthma. Eur Respir J. 2011;38:318–328. doi: 10.1183/09031936.00057710. [DOI] [PubMed] [Google Scholar]
- [39].Morcillo EJ, Cortijo J. Mucus and MUC in asthma. Curr Opin Pulm Med. 2006;12:1–6. doi: 10.1097/01.mcp.0000198064.27586.37. [DOI] [PubMed] [Google Scholar]
- [40].Munakata M. Airway remodeling and airway smooth muscle in asthma. Allergol Int. 2006;55:235–243. doi: 10.2332/allergolint.55.235. [DOI] [PubMed] [Google Scholar]
- [41].Dixon AE, Holguin F, Sood A, Salome CM, Pratley RE, Beuther DA, Celedon JC, Shore SA. An official American Thoracic Society Workshop Report: obesity and asthma. Proceedings of the American Thoracic Society. 2010;7:325–335. doi: 10.1513/pats.200903-013ST. [DOI] [PubMed] [Google Scholar]
- [42].Rothenberg ME. Eosinophilia. N Engl J Med. 1998;338:1592–1600. doi: 10.1056/NEJM199805283382206. [DOI] [PubMed] [Google Scholar]
- [43].Hemelaers L, Louis R. Eotaxin: an important chemokine in asthma. Rev Med Liege. 2006;61:223–226. [PubMed] [Google Scholar]
- [44].Fregonese L, Silvestri M, Sabatini F, Rossi GA. Cysteinyl leukotrienes induce human eosinophil locomotion and adhesion molecule expression via a CysLT1 receptor-mediated mechanism. Clin Exp Allergy. 2002;32:745–750. doi: 10.1046/j.1365-2222.2002.01384.x. [DOI] [PubMed] [Google Scholar]
- [45].Divoux A, Clément K. Architecture and the extracellular matrix: the still unappreciated components of the adipose tissue. Obes Rev. 2011;12:e494–e503. doi: 10.1111/j.1467-789X.2010.00811.x. [DOI] [PubMed] [Google Scholar]
- [46].Grande JP, Melder DC, Zinsmeister AR. Modulation of collagen gene expression by cytokines: stimulatory effect of transforming growth factor-β, with divergent effects of epidermal growth factor and tumor necrosis factor-a on collagen type I and collagen type IV. J Lab Clin Med. 1997;130:476–486. doi: 10.1016/s0022-2143(97)90124-4. [DOI] [PubMed] [Google Scholar]
- [47].Samad F, Yamamoto K, Pandey M, Loskutoff DJ. Elevated expression of transforming growth factor-beta in adipose tissue from obese mice. Mol Med. 1997;3:37–48. [PMC free article] [PubMed] [Google Scholar]
- [48].Cho S, Kang J, Lyttle C, Harris K, Daley B, Grammer L, Avila P, Kumar R, Schleimer R. Association of elevated plasminogen activator inhibitor 1 levels with diminished lung function in patients with asthma. Ann Allergy Asthma Immunol. 2011;106:371–377. doi: 10.1016/j.anai.2010.12.021. [DOI] [PMC free article] [PubMed] [Google Scholar]
- [49].Miyamoto S, Hattori N, Senoo T, Onari Y, Iwamoto H, Kanehara M, Ishikawa N, Fujitaka K, Haruta Y, Murai H, Yokoyama A, Kohno N. Intra-airway administration of small interfering RNA targeting plasminogen activator inhibitor-1 attenuates allergic asthma in mice. Am J Physiol Lung Cell Mol Physiol. 2011;301:L908–L916. doi: 10.1152/ajplung.00115.2011. [DOI] [PubMed] [Google Scholar]
- [50].Singh P, Peterson TE, Barber KR, Kuniyoshi FS, Jensen A, Hoffmann M, Shamsuzzaman ASM, Somers VK. Leptin up-regulates the expression of plasminogen activator inhibitor-1 in human vascular endothelial cells. Biochem Biophys Res Commun. 2010;392:47–52. doi: 10.1016/j.bbrc.2009.12.158. [DOI] [PMC free article] [PubMed] [Google Scholar]
- [51].Sousse LE, Yamamoto Y, Enkhbaatar P, Rehberg SW, Wells SM, Leonard S, Traber MG, Yu YM, Cox RA, Hawkins HK, Traber LD, Herndon DN, Traber DL. Acute lung injury-induced collagen deposition is associated with elevated asymmetric dimethylarginine and arginase activity. Shock. 2011;35:282–288. doi: 10.1097/SHK.0b013e3181fddd82. [DOI] [PMC free article] [PubMed] [Google Scholar]
- [52].Lefevre L, Gales A, Olagnier D, Bernad J, Perez L, Burcelin R, Valentin A, Auwerx J, Pipy B, Coste A. PPARg ligands switched high fat diet-induced macrophage M2b polarization toward M2a thereby improving intestinal Candida elimination. PLoS ONE. 2010;5:e12828. doi: 10.1371/journal.pone.0012828. [DOI] [PMC free article] [PubMed] [Google Scholar]
- [53].Kim OY, Lee S-M, Chung JH, Do HJ, Moon J, Shin M-J. Arginase I and the very low-density lipoprotein receptor are associated with phenotypic biomarkers for obesity. Nutrition. 2012;28:635–639. doi: 10.1016/j.nut.2011.09.012. [DOI] [PubMed] [Google Scholar]
- [54].Fortner CN, Breyer RM, Paul RJ. EP2 receptors mediate airway relaxation to substance P, ATP, and PGE2. Am J Physiol Lung Cell Mol Physiol. 2001;281:L469–L474. doi: 10.1152/ajplung.2001.281.2.L469. [DOI] [PubMed] [Google Scholar]
- [55].Bauman KA, Wettlaufer SH, Okunishi K, Vannella KM, Stoolman JS, Huang SK, Courey AJ, White ES, Hogaboam CM, Simon RH, Toews GB, Sisson TH, Moore BB, Peters-Golden M. The antifibrotic effects of plasminogen activation occur via prostaglandin E2 synthesis in humans and mice. J Clin Invest. 2010;120:1950–1960. doi: 10.1172/JCI38369. [DOI] [PMC free article] [PubMed] [Google Scholar]