

A small-molecule agonist of the Toll-like receptor 1/2 signaling pathway does it by stabilizing heterodimeric associations.
Keywords: toll-like receptors, drug discovery, vaccine adjuvant, chemical probes
Abstract
Toll-like receptor (TLR) agonists activate both the innate and the adaptive immune systems. These TLR agonists have been exploited as potent vaccine adjuvants and antitumor agents. We describe the identification and characterization of a small molecule, N-methyl-4-nitro-2-(4-(4-(trifluoromethyl)phenyl)-1H-imidazol-1-yl)aniline (CU-T12-9), that directly targets TLR1/2 to initiate downstream signaling. CU-T12-9 specifically induces TLR1/2 activation, which can be blocked by either the anti-hTLR1 or the anti-hTLR2 antibody, but not the anti-hTLR6 antibody. Using a variety of different biophysical assays, we have demonstrated the binding mode of CU-T12-9. By binding to both TLR1 and TLR2, CU-T12-9 facilitates the TLR1/2 heterodimeric complex formation, which in turn activates the downstream signaling. Fluorescence anisotropy assays revealed competitive binding to the TLR1/2 complex between CU-T12-9 and Pam3CSK4 with a half-maximal inhibitory concentration (IC50) of 54.4 nM. Finally, we showed that CU-T12-9 signals through nuclear factor κB (NF-κB) and invokes an elevation of the downstream effectors tumor necrosis factor–α (TNF-α), interleukin-10 (IL-10), and inducible nitric oxide synthase (iNOS). Thus, our studies not only provide compelling new insights into the regulation of TLR1/2 signaling transduction but also may facilitate future therapeutic developments.
INTRODUCTION
The vertebrate host defense system is classified into two groups: innate or adaptive immunity (1). The innate system provides an immediate broad response to infection by recognizing conserved structures called pathogen-associated molecular patterns (PAMPs) (2, 3). In contrast, the adaptive system provides a slow specific response to infection dependent on B cell differentiation and T cell activation by a particular antigen (4).
Toll-like receptors (TLRs), which are a family of pattern recognition receptors, regulate innate immunity and subsequent adaptive immune responses. TLRs control activation of adaptive immune responses by up-regulating costimulatory molecules on antigen-presenting cells (APCs) (Fig. 1A) and producing cytokines, including interferon-α (IFN-α), IFN-γ, and interleukin-12 (IL-12), that guide T cell differentiation (1, 5). The ability of TLRs to activate both immune systems has made them desirable targets for vaccine adjuvants (1). Specific TLR agonists with both high potency and low toxicity offer the opportunity to meet the stringent safety criteria required for prophylactic vaccines. Currently, a number of modifications to natural TLR agonists have been used for vaccine adjuvants. For example, the modified TLR4 agonist, monophosphoryl lipid A (MPL), is used as an adjuvant in U.S. Food and Drug Administration–approved adult hepatitis B virus (HBV) vaccines (6). Cervarix, a vaccine marketed by GlaxoSmithKline, also uses MPL as an adjuvant (7). Other TLR agonists are also being investigated for vaccine adjuvant applications, including the TLR9 agonist CpG-ODN in HBV vaccines (1). Literature reports have suggested that the TLR2 agonists are among the most effective adjuvants (8), as evidenced by their uses in the HIV (9), HBV, and human papillomavirus (HPV) (10) vaccines. TLR1/2 agonists have also been suggested to decrease infection-related morbidity and mortality and improve vaccine response in elders (11). Specific TLR agonists can be used not only for vaccine adjuvants but also for combined cancer therapies (12, 13). The TLR7 agonist imiquimod is one well-known example and has been approved for treating basal cell skin tumors (14, 15). Agonists of TLR2 have been used to induce lung tumor regression (13), inhibit breast cancer growth (16), and treat bladder cancer (17) and pancreatic carcinoma (18). Furthermore, the TLR1/2 agonists have also been suggested to be effective in both chronic and acute inflammatory/infectious diseases such as influenza (19), asthma (20), and age-induced obesity (21).
Fig. 1. Selection of CU-T12-9 as a TLR2 signaling agonist.

(A) Role of TLRs in the innate and adaptive immunity responses. Recognition of PAMPs by TLRs expressed on APCs, such as dendritic cells, up-regulates cell surface expression of costimulatory molecules (CD80 and CD86), major histocompatibility complex class II (MHC II), and T cell receptor (TCR). Induction of CD80/86 on APCs by TLRs leads to the activation of T cells specific to pathogens. TLRs also induce expression of cytokines, such as IL-12, IL-6, and TNF-α, as well as chemokines and their receptors, triggering many other events associated with dendritic cell maturation. The above cytokines will contribute to the differentiation of activated T cells into T helper effector cells, building long-term protective immunity (51). (B) Chemical structure of CU-T12-9. (C) CU-T12-9 activates SEAP signaling in a dose-dependent manner. HEK-Blue hTLR2 cells were incubated with CU-T12-9 or GA for 24 hours, and activation was evaluated by SEAP secretion in the culture supernatants by the luminescence assay. (D) Human TLR2, TLR3, TLR4, TLR5, TLR7, and TLR8 HEK-Blue cells were incubated with CU-T12-9 (0 to 20 μM) or TLR-specific agonist for 24 hours, and activation was evaluated by the luminescence assay. (E to I) As positive control, agonists that selectively activate a specific TLR were used: TLR1/TLR2, Pam3CSK4 (0 to 66 nM or 0 to 100 ng/ml); (E) TLR3, polyinosinic-polycytidylic acid [poly(I:C)] (0 to 10.9 μg/ml); (F) TLR4, lipopolysaccharide (LPS) (0 to 36.5 ng/ml); (G) TLR5, FLA-BS (0 to 10 μg/ml); (H) TLR7 and (I) TLR8, R848 (0 to 6 μg/ml). Data are means ± SD of triplicate and representative of three independent experiments.
These potential applications motivated us to discover and develop novel, drug-like TLR2-selective agonists. Still, not one of the current TLR2 agonists in clinical or preclinical development is a small-molecule agent. This task is particularly challenging because (i) TLR2 recognizes a wide range of ligands, many of which are from Gram-positive bacteria, and it signals as a heterodimer with either TLR1 or TLR6 (22, 23), raising questions about the specificity of small-molecule agents; (ii) the activation through TLR1/2 or TLR2/6 cannot be selectively achieved in most known TLR2 agonists; and (iii) the development of protein-protein interaction (PPI) stabilizers is considered one of the most challenging tasks in drug discovery because of the expansive protein-protein interfaces (24). Our group has focused on small molecules that target the TLR2 heterodimer PPI (25, 26), specifically modulating the TLR1/2 response (27). Here, we have shown that CU-T12-9 binds to the interface of TLR1 and TLR2, facilitating heterodimer association. The discovery of these small-molecule agents not only helps us to better understand the regulatory mechanism of the TLR1/2 signaling pathway but also renders an immense potential for vaccine or cancer therapy developments.
RESULTS
CU-T12-9 is identified as a novel TLR1/2 agonist
Tapping and co-workers previously screened a library of about 24,000 compounds for their luciferase activities using an IL-8–driven luciferase reporter in SW620 human colonic epithelial cells (28), which led to the identification of a preliminary hit, N-methyl-4-nitro-2-(4-(4-nitrophenyl)-1H-imidazol-1-yl)aniline (GA), containing a 1,4-diphenyl-1H-imidazole core. GA demonstrates TLR-dependent activities in vitro; nonetheless, the direct target of this interesting molecule was unknown. Our goal was to first identify the direct target for GA and then optimize it to achieve high efficacy and selectivity. We first developed a modular chemical synthesis route for GA (scheme S1). A secreted embryonic alkaline phosphatase (SEAP) assay demonstrated that GA could activate inflammatory signaling only in TLR2-overexpressing cells with a half-maximal effective concentration (EC50) of 2.51 ± 0.42 μM. Consequent structure-activity relationship (SAR) studies yielded an optimized novel compound, CU-T12-9 (Fig. 1B), which had a significant activity increase to nanomolar range with an EC50 of 52.9 ± 6.2 nM (Fig. 1C). Detailed cellular study results and SAR discussion are described in table S1.
Several key features were discovered about the activity of the lead compound. First, the SAR studies indicated that the nitro groups were critical to the activity, because removing either of the nitro groups at position R1 or R3 decreased the potency significantly (1 and 2; table S1 and fig. S1A). At the same time, the potency dropped when the aliphatic chain length was further increased or a benzyl group was introduced at the amino site (3, 4, and 5; fig. S1B). The electron-withdrawing groups are tolerated at the R3 position of ring B (6, 7, and 8; fig. S1C). Switching the nitro group from the R3 to R4 position (10) completely abolished activity, suggesting that the R3 position was critical for potency. The –CN or –CF3 replacement of –NO2 at the R3 position increased potency by a factor of 10 or 50, respectively (11 and CU-T12-9; fig. S1D).
It was posited that a hydrophobic group at the R3 position might be helpful for potency, and indeed, its importance was highlighted by phenyl (13), cyclohexyl (14), t-butyl (16), n-butyl (17), and methyl benzoate (18) additions, each showing a higher potency when compared to GA (table S1). The naphthalene ring in 15 is not as long or flexible as the biphenyl moiety of 13, leading to further reduction in potency. Benzoic acid (19) was inactive at 100 μM, suggesting that polar substituents may not be tolerated at the R3 position. As seen with the above active analogs, the R3 position can tolerate a wide variety of substituents, with an electron-withdrawing –CF3 group (CU-T12-9) showing the optimal potency. Because the –CF3 group helped increase the potency in ring B, we introduced another –CF3 group to the R1 position of ring A (20), and the potency decreased four times when compared with CU-T12-9. The electron-donating –NH2 group of (21) and moderately electron-withdrawing groups, such as –COOCH3 (22) and CO2H (T12-29), gave further reduction in potency (fig. S1E), suggesting a preference for the strongly electron-withdrawing groups for this aromatic ring, with –NO2 being optimal. The cyano group analog (24) also showed decreased activity compared to CU-T12-9. Together, these data indicate that minor changes of molecular structure in GA had a profound effect on its agonist activity. Extensive SAR led to an optimized, novel small-molecule immune stimulant, CU-T12-9.
CU-T12-9 specifically activates the TLR2 signaling
As a pivotal part of innate immunity, TLRs recognize various molecules of microbial origin (29). Hence, we questioned whether CU-T12-9 can selectively activate specific TLR(s) by using human embryonic kidney (HEK)–Blue hTLR cells overexpressing different TLRs, including TLR2, TLR3, TLR4, TLR5, TLR7, and TLR8 (Fig. 1, D to I). These cell lines were obtained by cotransfection of individual human TLRs and an inducible SEAP reporter gene into the HEK 293 cells (16). The SEAP reporter gene is placed under the control of an IL-12 p40 minimal promoter fused to five nuclear factor κB (NF-κB)– and activating protein 1 (AP1)–binding sites. Stimulation with a TLR ligand activates NF-κB and AP1, which induces the production of SEAP. The enhancement in SEAP signaling correlates to specific TLR activation, as monitored by luminescence intensity. The TLR-transfected HEK 293 cells are well-established systems to test individual TLR signaling (25–27). The wild-type HEK 293 cells only express low levels of TLRs, whereas each transfected cell line provides a robust and specific platform for monitoring the activity and selectivity of different TLR modulators. As a comparison, APCs are not applicable for these evaluations because they nonselectively respond to all TLRs.
As shown in Fig. 1D, CU-T12-9 can strongly activate the SEAP signaling in HEK-Blue cells overexpressing hTLR2, but not in other TLR-overexpressing cells, including TLR3, TLR4, TLR5, TLR7, and TLR8. TLR-specific agonists were used as positive controls for each HEK-Blue cell line. These results indicated that CU-T12-9 could specifically activate the TLR2 signaling pathway.
CU-T12-9 selectively activates the TLR1/2 heterodimer, not TLR2/6
Among the 10 human TLRs, most TLRs act alone; only TLR2 signals as a heterodimer with either TLR1 or TLR6 (23, 30). HEK-Blue hTLR2 cells endogenously express TLR1 and TLR6. To identify whether CU-T12-9 is a TLR1/2 agonist or a TLR2/6 agonist, we performed an antibody inhibition experiment to test its selectivity. At 60 nM, CU-T12-9 can efficiently activate SEAP signaling, and such activation can be reversed by either the anti-hTLR1 or the anti-hTLR2 antibodies in a dose-dependent manner (Fig. 2A). Cell viability experiments confirmed that the antibodies were not cytotoxic (fig. S2). By contrast, we did not observe any inhibition of CU-T12-9 SEAP signaling by an anti-hTLR6 antibody with concentrations up to 10 μg/ml (Fig. 2A). This behavior is similar to the well-studied TLR1/2-specific agonist, Pam3CSK4 (Fig. 2B). Next, we compared these results with an established TLR2/6-specific agonist, Pam2CSK4. We found that both anti-hTLR2 and anti-hTLR6 antibodies can inhibit Pam2CSK4-induced SEAP signaling, whereas anti-hTLR1 does not (Fig. 2C). These results demonstrated that CU-T12-9 acts by specific activation of TLR1/2 signaling, not TLR2/6.
Fig. 2. Characterizations of CU-T12-9 as a TLR1/2 agonist, not TLR2/6.
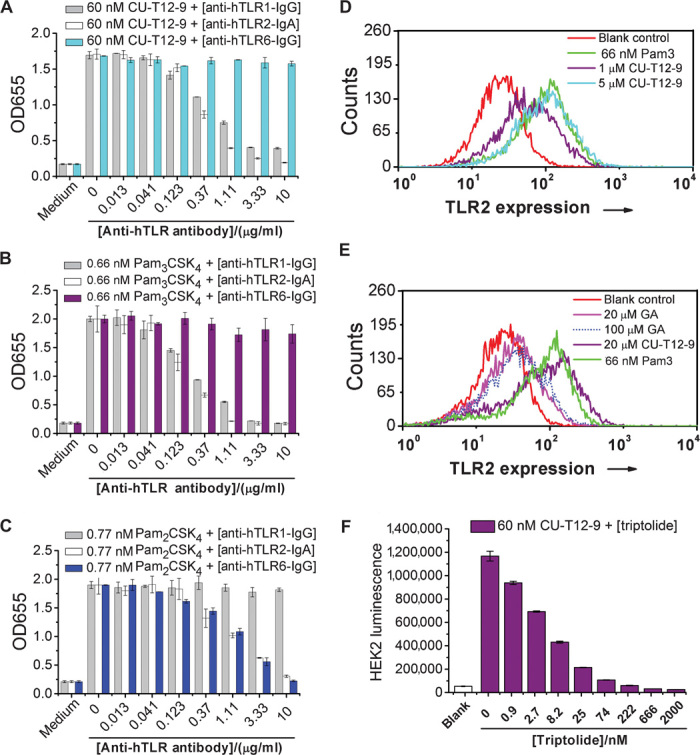
(A) HEK-Blue hTLR2 cells were treated with CU-T12-9 and anti-hTLR1, anti-hTLR2, or anti-hTLR6 antibodies for 24 hours. CU-T12-9 strongly activates QUANTI-Blue SEAP signaling at 60 nM, and anti-hTLR1–IgG (immunoglobulin G) and anti-hTLR2–IgA antibodies can dose-dependently inhibit CU-T12-9–triggered SEAP signaling, whereas anti-hTLR6–IgG has no influence. This demonstrates that CU-T12-9 can activate TLR1/2 signaling, with no activation of TLR2/6. (B) The positive control of Pam3CSK4, a TLR1/2 agonist, showed similar activation to CU-T12-9. (C) The positive control of Pam2CSK4, a TLR2/6 agonist, showed that anti-hTLR2–IgA and anti-hTLR6–IgG dose-dependently inhibited the Pam2CSK4-induced TLR2 and TLR6 QUANTI-Blue SEAP signaling, whereas anti-hTLR1–IgG had no influence. (D) The human monocyte cell line U937 was stably transfected with a GFP-labeled NF-κB reporter gene. The cells sensitive to TLR1/2 activation were sorted using a MoFlo Cytomation fluorescence-activated cell sorter, and 10% of activated cells were collected. The flow cytometric analysis of 0, 1, and 5 μM CU-T12-9 and 66 nM (100 ng/ml) Pam3CSK4 triggered NF-κB expression in U937 cells. (E) Flow cytometric analysis for 20 μM CU-T12-9 and GA, along with the blank and positive control in U937 cells. The result demonstrated that CU-T12-9 had excellent NF-κB activation compared with GA. (F) The NF-κB activation of CU-T12-9 can be inhibited by an NF-κB inhibitor, triptolide, in HEK-Blue hTLR2 cells.
CU-T12-9 activates downstream signaling through TLR1/2 and NF-κB signaling pathway
TLRs recruit a set of adaptor proteins through homotypic interactions with their Toll/IL-1 receptor (TIR) domains. These interactions trigger downstream signaling cascades, leading to the activation of transcription factor NF-κB. NF-κB controls induction of proinflammatory cytokines and chemokines as well as up-regulation of costimulatory molecules on dendritic cells that are essential for T cell activation (29, 31).
To investigate the cellular and molecular mechanisms of CU-T12-9 with NF-κB, we developed a TLR2-sensitive U937 human macrophage cell line with a green fluorescent protein (GFP)–labeled NF-κB reporter. Flow cytometry experiments demonstrated that CU-T12-9 activated NF-κB signaling in a dose-dependent manner. CU-T12-9, at 5 μM, showed comparable activation to 66 nM (100 ng/ml) Pam3CSK4 (Fig. 2D). As a comparison, GA showed much lower NF-κB activation at 20 μM, even up to 100 μM (Fig. 2E). To investigate the cell signaling of CU-T12-9–induced activation, we used a known NF-κB inhibitor, triptolide (32). Triptolide was able to efficiently inhibit the CU-T12-9–induced SEAP signaling (Fig. 2F), which further implies that CU-T12-9 works through the NF-κB signaling pathway.
Another downstream product of NF-κB activation is nitric oxide (NO) (Fig. 3A). NO plays important roles in various biological processes such as neuronal communication and immunity response (33). As predicted, CU-T12-9 efficiently triggered NO production in Raw 264.7 cells (Fig. 3B) and also in primary rat macrophage cells (Fig. 3C). We also observed that NO activation could be inhibited by the TLR1/2-specific antagonist (CU-CPT22) (27) (fig. S3, A and B) but could not be influenced by the TLR4-specific inhibitor TAK242 (fig. S3C) in Raw 264.7 macrophage cells, confirming that this activation was specific.
Fig. 3. The downstream cytokines activated by CU-T12-9.

(A) TLR1/2 signaling pathway after NF-κB activation. Ligands from Gram-positive bacteria, yeast, or fungi can induce the TLR1/2 dimerization, leading to the NF-κB activation through the adaptor proteins MyD88/TRAF/IKK. This triggers the SEAP promoter to secrete alkaline phosphatase or induces production of proinflammatory cytokines, such as TNF-α, IL, IFN, and NO (23, 29). (B and C) Dose-dependent activation of NO production in Raw 264.7 macrophage cells (B) and primary macrophage cells (C). Data are means ± SD. *P < 0.05 for CU-T12-9 relative to positive control. (D) ELISA assay results showed that CU-T12-9 activates the TNF-α production in Raw 264.7 macrophage cells with an EC50 of 60.46 ± 16.99 nM. Pam3CSK4 was used as a positive control in the experiment. Data are means ± SD. **P < 0.01 for CU-T12-9 (1.2 μM) relative to positive control.
Transcription factors turned on by TLR1/2 dimerization induce the production of proinflammatory cytokines and type I IFNs (34, 35). A key output from this activation is tumor necrosis factor–α (TNF-α), which is proven to be directly relevant to inflammatory diseases (36) and cancer (37). To ascertain whether the NF-κB activity induced by CU-T12-9 reflected up-regulation of TNF-α, we assessed the ability of CU-T12-9 to activate TNF-α in Raw 264.7 cells using an enzyme-linked immunosorbent assay (ELISA) experiment. The ELISA experiment showed that CU-T12-9 has the ability to activate TNF-α signaling with an EC50 of 60.46 ± 16.99 nM (Fig. 3D), consistent with the SEAP activation observed in HEK-Blue hTLR2 cells (Fig. 1C). Furthermore, the highest TNF-α activation signaling was comparable to the positive control in the same experiment. Overall, these results demonstrated that CU-T12-9 behaves like Pam3CSK4 in activating the TLR1/2 pathway by inducing NF-κB activation to trigger downstream signaling, such as SEAP, NO, and TNF-α.
CU-T12-9 up-regulates the mRNA levels of TLR1, TLR2, TNF, IL-10, and iNOS
Quantitative reverse transcription polymerase chain reaction (qRT-PCR) was performed to investigate the effects of CU-T12-9 and Pam3CSK4 on the expression of mRNA levels for TLR1, TLR2, and NF-κB pathway downstream proinflammatory cytokines TNF, IL-10, and iNOS (inducible NO synthase) at 2, 8, and 24 hours after treatment (Fig. 4). In the presence of 1 μM CU-T12-9, TLR1 mRNA was potently increased, similar to Pam3CSK4, in the macrophage cell line at 24 hours (Fig. 4A). Both Pam3CSK4 and CU-T12-9 had the highest TLR2 mRNA expression at 2 hours, with a gradual decline at 8 and 24 hours (Fig. 4C). CU-T12-9 and Pam3CSK4 also increased TNF and iNOS mRNA expression over time. TNF mRNA showed maximal expression after 8 hours (Fig. 4E), and iNOS mRNA expression peaked at 24 hours (Fig. 4G). IL-10 mRNA was up-regulated by CU-T12-9 at 2 hours and decreased over time (Fig. 4I). In addition, we observed that CU-T12-9 had dose-dependent activating effects on the mRNA levels of TLR1 (Fig. 4B), TLR2 (Fig. 4D), TNF (Fig. 4F), iNOS (Fig. 4H), and IL-10 (Fig. 4J). These results are in agreement with the fact that CU-T12-9 acts in a similar manner to Pam3CSK4, activating TLR1/2 signaling and promoting the production of various downstream proinflammatory cytokines.
Fig. 4. mRNA induction by CU-T12-9 and Pam3CSK4 in Raw 264.7 macrophage cells.

(A) CU-T12-9 (1 μM) and 33 nM (50 ng/ml) Pam3CSK4 increased the TLR1 mRNA expression over time. Shown are the changes in relative gene expression levels (fold change) relative to the expression levels in dimethyl sulfoxide (DMSO)–treated controls, represented as means ± SD. *P < 0.05 for Pam3CSK4 or CU-T12-9 relative to DMSO-treated control. The statistical analyses were based on two independent biological replicates, and each biological replicate was divided into three samples for independent measurements. Changes in the relative expression of hTLR1 were standardized to the expression of the housekeeping gene GAPDH (glyceraldehyde-3-phosphate dehydrogenase). (B) Dose-dependent assay of CU-T12-9 triggered TLR1 mRNA after the cells were treated for 24 hours. (C) CU-T12-9 and Pam3CSK4 increased TLR2 mRNA at 2 hours with a gradual decline in TLR2 mRNA expression by 24 hours. *P < 0.01 for Pam3CSK4 or CU-T12-9 relative to DMSO-treated control. (D) Dose-dependent activation with CU-T12-9–induced TLR2 mRNA in 2 hours. (E) TNF mRNA was activated by CU-T12-9 and Pam3CSK4 through the NF-κB pathway, and the highest signaling was seen at 8 hours. *P < 0.01 for Pam3CSK4 or CU-T12-9 relative to DMSO-treated control. (F) CU-T12-9 showed dose-dependent activation of TNF mRNA at 8 hours. (G) Gradual increase in iNOS mRNA expression over time with CU-T12-9 and Pam3CSK4 through the NF-κB pathway compared with vehicle control. **P < 0.001 for Pam3CSK4 or CU-T12-9 relative to DMSO-treated control. (H) CU-T12-9 showed dose-dependent activation of iNOS mRNA at 24 hours. (I) IL-10 mRNA up-regulated by CU-T12-9 and Pam3CSK4 through the NF-κB pathway in 2 hours, and gradual decrease in IL-10 mRNA in 8 and 24 hours. *P < 0.01 for CU-T12-9 relative to DMSO-treated control. (J) CU-T12-9 showed dose-dependent activation of IL-10 mRNA at 24 hours.
CU-T12-9 competes with Pam3CSK4 for binding to TLR1/2
To further investigate the direct binding target of CU-T12-9 and also to test whether CU-T12-9 may functionally mimic receptor recognition by Pam3CSK4, we used a biophysical competition assay. The TLR1 and TLR2 proteins were expressed in the baculovirus insect cell expression system (38), and biotin-labeled Pam3CSK4 was used as a probe in these experiments. Human TLR1/2 proteins were immobilized on the surface. Different concentrations of biotin-labeled Pam3CSK4 (Biotin-Pam3) were added, and the bound Biotin-Pam3 was detected by streptavidin conjugated with horseradish peroxidase (HRP). Biotin-Pam3 bound to human TLR1/2 in a concentration-dependent manner (Fig. 5A). As a comparison, binding to a negative control bovine serum albumin (BSA) was negligible, indicating that the Biotin-Pam3-TLR1/2 binding is specific. CU-T12-9 was found to possibly compete with Biotin-Pam3 for binding to TLR1/2 (Fig. 5B).
Fig. 5. Biophysical characterizations of CU-T12-9.
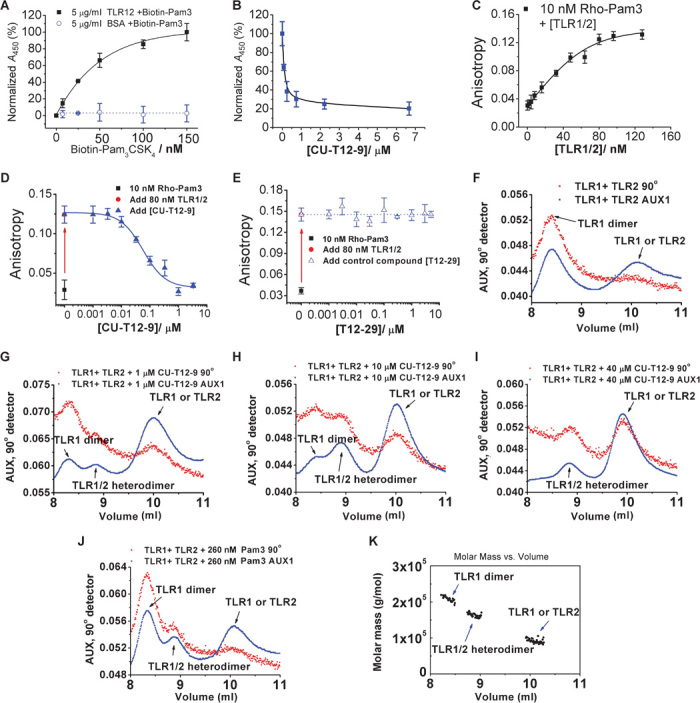
(A) TLR1 (5 μg/ml) and TLR2 (4 μg/ml) or BSA (5 μg/ml) (used as the control) were coated onto the plate. Different concentrations of biotin-labeled Pam3CSK4 (Biotin-Pam3) were added to the plate, and the bound Biotin-Pam3 was detected by streptavidin conjugated with HRP. Absorbance with TLR1/2 in the presence of 150 nM (300 ng/ml) Biotin-Pam3 was set as 100%. (B) TLR1 (5 μg/ml) and TLR2 (4 μg/ml) were coated onto the plate, and 50 nM (100 ng/ml) Biotin-Pam3 and different concentrations of CU-T12-9 (0 to 7 μM) were added. Absorbance with 0 μM CU-T12-9 was set as 100%. CU-T12-9 can compete with Biotin-Pam3 binding to TLR1/2. (C) Binding curve of TLR1/2 with rhodamine-labeled Pam3CSK4 (Rho-Pam3) measured by fluorescence anisotropy. Different concentrations of TLR1/2 were titrated into 10 nM (~20 ng/ml) Rho-Pam3; 549 nm was chosen as the excitation wavelength, and 566 nm was chosen as the emission wavelength (InvivoGen). A Kd of 34.97 ± 1.98 nM was obtained by fitting the binding curve to a one-site saturation model. (D) Titration of the TLR1/TLR2 protein into the Rho-Pam3 results in a significant increase of fluorescence anisotropy. Added CU-T12-9 competes with Rho-Pam3 and results in lower fluorescence anisotropy, demonstrating competitive binding between CU-T12-9 and Pam3CSK4 for TLR1/TLR2. (E) Compound T12-29 was used as a negative control in the fluorescence anisotropy experiment. The results showed no competitive binding between T12-29 and Pam3CSK4 for TLR1/TLR2 up to 10 μM. (F) The hTLR2 protein (60 μl at 0.8 mg/ml) and different concentrations of CU-T12-9 (0 to 40 μM) or Pam3CSK4 were incubated at room temperature for 2 hours. Then, hTLR1 protein (60 μl at 1 mg/ml) was added to the reaction mixture, which was incubated at 37°C for an additional 2 hours before the SEC-LS experiment. (G to I) SEC-LS results for the TLR1/2 protein heterodimer formation by different doses of CU-T12-9: 0 μM, (G) 1 μM, (H) 10 μM, and (I) 40 μM. Increasing CU-T12-9 concentrations lead to more heterodimerization. (J) Pam3CSK4 (260 nM or 400 ng/ml) (positive control) also induces TLR1/2 heterodimerization in this experiment. (K) Molar mass of the three peaks appearing in (H). The TLR1/2 heterodimer peak was present at the molecular weight of about 180 kD.
Fluorescence anisotropy biophysical tests were also carried out for CU-T12-9, along with the negative control compound T12-29, to demonstrate that CU-T12-9 binds to TLR1/TLR2 and shed light on its potential binding mode. The previously reported crystal structure reveals that TLR1 and TLR2 preform a heterodimer, which in turn provides a specific binding pocket for Pam3CSK4 (23). Although the determination of a trimolecular (TLR1, TLR2, and CU-T12-9 or Pam3CSK4) association using fluorescence titration data is complicated (39), we make an assumption that the preformed TLR1/2 complex interacts with Pam3CSK4 at a 1:1 ratio based on the structural observation when we determine their dissociation constant (Kd) values. Similar approach has been used in the literature as well (40).
To determine the binding affinity of CU-T12-9, we used a commercially available Pam3CSK4 derivative (Rho-Pam3) with a rhodamine tag as the fluorescence probe. The anisotropy of Rho-Pam3 showed a robust increase upon its addition to the TLR1/TLR2 complex (excitation, 549 nm; emission, 566 nm) (Fig. 5D), comparable to the anisotropy changes seen with ligand-receptor pairs of comparable sizes (41). The Kd of Rho-Pam3 binding to the TLR1/2 complex was determined to be 34.9 ± 1.9 nM, which is in agreement with the literature reports (42). As a comparison, we also measured the bimolecular interaction between Rho-Pam3 and TLR1 or TLR2, which gives Kd values of 41.64 ± 2.36 nM and 125.08 ± 3.43 nM, respectively (fig. S4).
Next, we titrated CU-T12-9 to the TLR1/2 complex to compete with Rho-Pam3. Increasing concentrations of CU-T12-9 up to 3 μM decreased the anisotropy to its background levels, presumably because of the release of the fluorescent Rho-Pam3 probe. These data were then fit to a one-site competition model with an R2 value of 0.98, indicating a good fitting and that the assumption of a 1:1 binding mode is appropriate. The half-maximal inhibitory concentration (IC50) value of CU-T12-9 was determined to be 54.4 ± 3.6 nM (error derived from the regressional analysis of the inhibitory curve), which is consistent with its inhibitory potency observed in various whole-cell assays. By contrast, the negative control compound T12-29 demonstrated negligible inhibition of the Rho-Pam3 binding up to 10 μM (Fig. 5E). Together, these data suggest that CU-T12-9 directly competes with Pam3 for its recognition of the TLR1/2 complex. Nonetheless, we should also point out that there is a possibility that CU-T12-9 recognizes an allosteric site other than the same binding pocket of Pam3, resulting in the release of Pam3. Determination of the exact binding mode would require further structural elucidation in future studies.
Finally, we measured the binding affinity of CU-T12-9 to the TLR1 and TLR2 proteins individually using a microscale thermophoresis (MST) assay. It was observed that CU-T12-9 can bind to both TLR1 (Kd = 229 ± 66 nM; fig. S5) and TLR2 (Kd = 449 ± 114 nM; fig. S6) individually, but with lower affinity than the biologically active TLR1/2 heterodimer. These results suggest that the binding site of CU-T12-9 is on the interface of the TLR1 and TLR2 proteins.
CU-T12-9 enhances TLR1 and TLR2 dimerization in vitro
The realization that Pam3CSK4 can induce TLR1 and TLR2 dimerization (23), and the results of the competitive binding experiment prompted us to investigate the effects of CU-T12-9 on the dimer formation of the TLR1/TLR2 complex. We used a previously established method using size exclusion chromatography coupled with light scattering (SEC-LS) on the purified extracellular domains of hTLR1 and hTLR2 (43). The instrument was first calibrated using BSA (65 kD) and aldolase (158 kD), and then, we verified the hTLR1 or hTLR2 peak in the SEC-LS experiment (fig. S7). We observed that most hTLR1 existed in a homodimeric state and the hTLR2 in a predominantly monomeric state in the absence of CU-T12-9. Heterodimer formation was detected in the presence of CU-T12-9 in a dose-dependent manner (Fig. 5, F to H). Incubating the TLR1 and TLR2 protein with 40 μM CU-T12-9 for 4 hours resulted in the disappearance of the TLR1 homodimer peak and the presence of a new TLR1/2 heterodimer and TLR1 or TLR2 monomer peaks (Fig. 5I). These observations are comparable to Pam3CSK4, which also promoted TLR1/2 heterodimerization (Fig. 5J). The molar mass of the different respective peaks in Fig. 5H is shown in Fig. 5K. Finally, nuclear magnetic resonance (NMR) experiments also showed that there is neglectable oligomer formation of CU-T12-9 (fig. S8) in various solvents, suggesting that the dimerization of TLR1/2 was not caused by the CU-T12-9 oligomerization. Together, these data indicated that CU-T12-9 not only selectively activates the TLR1/2 signaling pathway but also induces TLR1/2 heterodimerization.
DISCUSSION
Selectively targeting the interactions between TLR family proteins has garnered great interest, but developing drug-like, small-molecule compounds with high affinity and selectivity is difficult. This task of targeting the TLR1/2 complex is particularly challenging given that the ligand-binding pockets at protein-protein interfaces are highly dynamic (44). First, because protein-protein interfaces are usually extensive, there may be a requirement for large ligands to interfere effectively with their functions, posing challenges to the development of small molecular PPI stabilizers (24). All current TLR2 agonists, such as Pam3CSK4 for TLR1/2 and Pam2CSK4 or FSL-1 for TLR2/6, are primarily synthetic lipoproteins containing two or three 15-carbon acyl chains with molecular weights of about 1500 hindering their further development into therapeutics (45). Second, TLR selectivity poses a challenge for small-molecule agonists and antagonists because there are at least 13 homologous TLRs in rodents and 10 in humans, which all share similar structures (46). This is especially the case for TLR1/2 and TLR2/6, two heterodimeric protein complexes that share one common TLR2 protein. A third and final challenge in developing TLR agonists is that native TLR ligands are often highly toxic (47), significantly limiting their applications.
Here, we successfully identified CU-T12-9 as a novel, drug-like compound that specifically activates TLR1/2. To our best knowledge, CU-T12-9 represents the first biochemically and biophysically characterized specific small-molecule agonist for TLR1/2. Cellular studies demonstrated that CU-T12-9 only activated HEK-Blue cells overexpressing hTLR2, but not other TLRs. This activation can be blocked by either anti-hTLR1 or anti-hTLR2 antibodies, but not by an anti-hTLR6 antibody, indicating that CU-T12-9 has high selectivity for the TLR1/2 heterodimer. Next, we showed that CU-T12-9 signaled through NF-κB and invoked an elevation of the downstream effectors TNF-α, IL-10, and iNOS. Last, CU-T12-9 demonstrated negligible cytotoxicity at concentrations up to 100 μM (fig. S9), showing that its immune-enhancing effects are not due to cell stress.
Fluorescence anisotropy biophysical assays revealed competitive binding to the TLR1/2 complex between CU-T12-9 and Pam3CSK4 with an IC50 of 54.4 nM. CU-T12-9 bound to the individual TLR1 and TLR2 proteins at a significantly lower affinity than the heterodimer, suggesting that CU-T12-9 specifically recognizes the protein-protein interface. The SEC-LS assay showed that CU-T12-9, like the classical TLR1/2 ligand Pam3CSK4, can induce dimerization of the TLR1 and TLR2 complex, which gave further insight into the initiation of the TLR1/2 signaling transduction.
Together, these results revealed that a novel small-molecule TLR1/2 agonist, CU-T12-9, recognizes and stabilizes the heterodimer of TLR1/2. Our work therefore describes the development of a first well-characterized, specific small-molecule probe for TLR1/2 with potential biomedical applications.
MATERIALS AND METHODS
SEAP reporter gene detection assay
Materials for the SEAP assay were obtained from Applied Biosystems and used according to the manufacturer’s specifications. HEK 293 cells stably transfected with human TLR2, TLR3, TLR4, TLR5, TLR7, or TLR8 and a SEAP reporter gene were obtained from InvivoGen. Cells were cultured in 200 μl of Dulbecco’s modified Eagle’s medium (DMEM) supplemented with 10% fetal bovine serum (FBS), 10× penicillin/streptomycin, and 10× l-glutamine. Cells were implanted in 96-well plates (4 × 10⁴ cells per well) for 24 hours at 37°C before drug treatment. In the next 24 hours of treatment, medium was removed from the 96-well plate and replaced with 200 μl of supplemented Opti-MEM [0.5% FBS, penicillin (50 U/ml), streptomycin (50 μg/ml), 1× nonessential amino acids] containing 0 to 50.0 μM (or 0 to 100 μM) of compounds, or the positive control ligands for different TLRs, such as Pam3CSK4 (0 to 66 nM or 0 to 100 ng/ml) for TLR1/2, poly(I:C) (0 to 10.9 μg/ml) for TLR3, LPS (0 to 36.5 ng/ml) for TLR4, FLA-BS (0 to 10 μg/ml) for TLR5, and R848 (0 to 6 μg/ml) for TLR7 and TLR8.
A sample buffer (15 μl) from each well was collected and transferred to an opaque white 96-well plate (Microfluor 2, Thermo Scientific). Each well was treated with 45 μl of 1× dilution buffer, covered with microseal (MSB1001, Bio-Rad), and incubated for 30 min at 65°C. After 30 min, plates were cooled to room temperature on ice, and 50 μl of SEAP assay buffer was added to each well. After a 5-min incubation, 50 μl of disodium 3-(4-methoxyspiro{1,2-dioxetane-3,2-(5-chloro)tricyclo[3.3.1.13,7]decan}-4-yl) phenyl phosphate (CSPD) diluted 1:20 with reaction buffer was added to each well. After 20 min, the luminescence of each well was measured using a plate reader (Beckman Coulter, DTX 880) with multimode analysis software.
QUANTI-Blue SEAP assay
Cells were cultured in 200 μl of DMEM supplemented with 10% FBS, 10× penicillin/streptomycin, and 10× l-glutamine. Cells were implanted in 96-well plates (4 × 10⁴ cells per well) for 24 hours at 37°C before drug treatment. In the next 24 hours of treatment, medium was removed from the 96-well plate and replaced with 200 μl of supplemented Opti-MEM [0.5% FBS, penicillin (50 U/ml), streptomycin (50 μg/ml), 1× nonessential amino acids] containing 60 nM CU-T12-9, 0.66 nM (1 ng/ml) Pam3CSK4, or 0.77 nM (1 ng/ml) Pam2CSK4 according to the manufacturer’s protocol (InvivoGen), as well as different antibodies (0 to 10 μg/ml), including anti-hTLR1–IgG, anti-hTLR2–IgA, or anti-hTLR6–IgA (InvivoGen). A sample buffer (20 μl) from each well of the cell culture supernatants was collected and transferred to a transparent 96-well plate (Thermo Scientific). Each well was treated with 200 μl of QUANTI-Blue (InvivoGen) buffer and incubated at 37°C for 1 hour. A purple color can be observed, and optical density was measured using a plate reader at an absorbance of 655 nm (A655).
U937 cell transfection and NF-κB–GFP reporter assay
Human macrophage U937 cells [American Type Culture Collection (ATCC) CRL-1593.2] were grown and maintained in RPMI 1640 medium containing 10% FBS, penicillin (100 U/ml), and streptomycin (100 mg/ml). An NF-κB–GFP reporter was stably inserted using the commercially available pGreenFire plasmid (System Biosciences). Briefly, HEK 293T cells (ATCC CRL-3216) were transfected using a 6:1 polyethylenimine/DNA ratio with the pGreenFire vector (4.33 μg) and the pREV (4.33 μg), pMDL (4.33 μg), and pVSVg (2 μg) viral packaging plasmids. Viral particles were harvested from the medium 48 to 72 hours after transfection and concentrated using an 8.5% PEG-8000 (polyethylene glycol, molecular weight 8000) and 10 mM NaCl solution. The concentrated virus and polybrene (8 μg/ml) were added to U937 cells for 48 hours. Then, U937 growth medium supplemented with puromycin (1 mg/ml) was used to select for stably transfected cells. After complete selection, the cells were sorted for GFP expression using a MoFlo Cytomation (Beckman Coulter) fluorescence-activated cell sorter. After sorting for insertion, cells were treated with a TLR1/2 agonist [66 nM (100 ng/ml) Pam3CSK4, InvivoGen] and sorted for activation. The top 10% of activated cells were collected for each sort until no further peak separation was achieved between the untreated and the treated cells. The sorted cells were seeded in six-well plates at 1 × 10⁶ cells per well with 3 ml of growth medium [RPMI 1640 medium, supplemented with 10% FBS, penicillin (100 U/ml), and streptomycin (100 mg/ml)] and the indicated concentrations of compound and Pam3CSK4 for 24 hours at 37°C in a 5% CO2 humidified incubator. After 24 hours, the cells in each well were mixed and 200 μl of cells containing medium was stained by propidium iodide for 10 min before the flow cytometry analysis.
In vitro NO activation assay for Raw 264.7 cells
Raw 264.7 cells (mouse leukemic monocyte macrophage cell line) were grown in RPMI 1640 medium supplemented with 10% FBS, penicillin (100 U/ml), and streptomycin (100 mg/ml), seeded in 96-well plates at 80,000 cells per well, and grown for 24 hours at 37°C in a 5% CO2 humidified incubator (27). After 24 hours, nonadherent cells and medium were removed and replaced with fresh unsupplemented RPMI 1640 medium. The adherent macrophages were treated with 66 nM (100 ng/ml) Pam3CSK4 (InvivoGen) or different concentrations of CU-T12-9. Plates were then incubated for an additional 24 hours. After incubation, 100 μl of medium was collected and added to flat black 96-well microfluor plates (Thermo Scientific). To each well, 10 μl of 2,3-diaminonaphthalene (0.05 mg/ml in 0.62 M aqueous HCl solution) was added and incubated for 15 min in the dark. The reaction was quenched by addition of 5 μl of a 3 M aqueous NaOH solution, and the plate was read on a Beckman Coulter DTX 880 reader with excitation at 365 nm and emission at 450 nm. The nitrite (a stable metabolite of NO) concentration was determined from a nitrite standard curve (48).
Primary peritoneal macrophage cell isolation and NO activation assay
Sprague-Dawley rats were anesthetized with isoflurane and then decapitated. Peritoneal cells were removed by lavage. Cold dissection solution (30.0 ml of Hanks’ balanced salt solution) was placed into the peritoneal cavity, the abdomen was briefly massaged, and the fluid was removed (20 to 25 ml). The medium was centrifuged, and the cells were then washed by red blood cell lysis buffer (160 mM NH4Cl, 12 mM NaHCO3, 100 μM EDTA, pH 7.3). After centrifugation, the cells were resuspended to 1.0 × 10⁶ cells/ml in culture medium [Iscove’s medium containing 10% FBS with penicillin (50 U/ml), streptomycin (50 μg/ml), and 2 mM l-glutamine; all medium reagents from Gibco]. Cells were seeded in a 96-well plate with a density of 40,000 cells per well. After 2 hours of incubation at 37°C in a 5% CO2 humidified incubator, nonadherent cells were removed by washing with phosphate-buffered saline (PBS) and 200 μl of supplemented Iscove’s medium was subsequently added to each well. After overnight incubation, the medium was changed to Iscove’s medium without FBS and indicated concentrations of CU-T12-9 and 66 nM (100 ng/ml) Pam3CSK4 were added. After 24 hours of treatment, medium was harvested and NO in the supernatant was measured as described previously.
ELISA assays
TNF-α ELISA
Raw 264.7 cells were seeded in six-well plates at 1 × 10⁶ cells per well with 3 ml of medium [RPMI 1640 medium supplemented with 10% FBS, penicillin (100 U/ml), and streptomycin (100 mg/ml)] and grown for 24 hours at 37°C in a 5% CO2 humidified incubator. After 24 hours, nonadherent cells and medium were removed and replaced with fresh RPMI 1640 medium (3 ml per well). The cells were treated with indicated concentrations of CU-T12-9 and 66 nM (100 ng/ml) Pam3CSK4 (InvivoGen) as positive control. Plates were then incubated for an additional 24 hours, and the cell culture supernatants were collected and frozen at −80°C until ready for cytokine measurement. The production of the cytokine TNF-α was quantified using cytokine-specific capture antibodies, detection antibodies, and recombinant human cytokine standards according to commercially available ELISA kits from R&D Systems. The cytokine level in each sample was determined in triplicate.
Competition binding ELISA assay
The 96-well ELISA microplate (BD Biosciences) was coated with a mixture of TLR1 (5 μg/ml) and TLR2 (4 μg/ml) or BSA (5 μg/ml) in 0.1 M acetate buffer (pH 5.0) at 4°C overnight. The wells were washed three times with PBS supplemented with 0.05% Tween 20 (PBST) and then blocked with a 5% BSA solution at room temperature for 1 hour. After washing with PBST three times, the indicated concentration of biotin-labeled Pam3CSK4 or biotin-labeled Pam3CSK4 and CU-T12-9 mixture was added and incubated for 1 hour at room temperature. After five washings, a streptavidin-coupled HRP conjugate was diluted at a ratio of 1:2000 (Thermo Scientific), added into the wells, and incubated at room temperature for 1 hour. After washing with PBST seven times, 100 μl of TMB reagents (BD OptEIA) was added to each well and incubated at room temperature for 10 to 30 min. Fifty microliters of 1 M H3PO4 was subsequently added into each well to stop the reaction, the absorbance at 450 nm was measured on a Beckman Coulter DTX 880 microplate reader, and 620 nm was chosen as the reference wavelength.
Quantitative RT-PCR
Raw 264.7 cells were seeded in six-well plates at 1 × 10⁶ cells per well with 3 ml of medium [RPMI 1640 medium supplemented with 10% FBS, penicillin (100 U/ml), and streptomycin (100 mg/ml)] and grown for 24 hours at 37°C in a 5% CO2 humidified incubator. After 24 hours, nonadherent cells and medium were removed and replaced with fresh RPMI 1640 medium (3 ml per well). The cells were treated with the indicated concentrations of CU-T12-9 and 33 nM (50 ng/ml) Pam3CSK4 as positive control. Plates were then incubated for an additional 0, 2, 8, or 24 hours. At these time points, the medium was removed and the cells were gently washed with cold PBS (3 × 1 ml). Then, 1 ml of PBS was added to each well and the cells were removed from the plate. The mixture was transferred into corresponding 1.5-ml cryotubes and frozen at −80°C until ready for qRT-PCR. Total RNA was extracted by an RNeasy Mini Kit (SABiosciences) according to the manufacturer’s instruction. Complementary DNA (cDNA) was synthesized by RT2 Easy First Strand cDNA Synthesis Kit (SABiosciences) according to the manufacturer’s instruction. The primers for TLR1, TLR2, TNF, iNOS, IL-10, and GAPH were purchased from SABiosciences. qPCR was performed on a CFX96 Real-Time PCR detection system (Bio-Rad) using the SYBR Green method. The data were analyzed by ΔΔCt method (49).
Fluorescence anisotropy assay
Fluorescence polarization experiments were performed at 25°C using a Horiba Fluorolog-3 fluorometer. Equal molar ratio of TLR1 and TLR2 was incubated at 4°C for 30 min before they were titrated with the Rho-Pam3 solution. Indicated concentrations of TLR1, TLR2, or TLR1/2 (stock solution at 10 μM) were titrated into 500 μl of PBS buffer (pH 7.4) including 10 nM (20 ng/ml) Rho-Pam3 (InvivoGen), and the fluorescence anisotropy was measured at an excitation of 549 nm and an emission of 566 nm after the proteins were added and incubated for 3 min. The dissociation constant was obtained by fitting the binding curve to a one-site saturation equation.
To determine the IC50 value of CU-T12-9, 10 μl of Rho-Pam3 (1 μg/ml) was added to 490 μl of PBS buffer (pH 7.4), and then the fluorescence anisotropy was measured at an excitation of 549 nm and an emission of 566 nm by a Horiba Fluorolog-3 fluorometer. Then, 4 μl of TLR1 (10 μM) and 4 μl of TLR2 (10 μM) were titrated into the above buffer and incubated for 30 min, and the anisotropy was determined. Next, serial concentrations of CU-T12-9 (or T12-29 as a negative control) were incubated with the complex TLR1/2-Pam3 solution for 30 min at room temperature before the anisotropy was determined. Regression analysis was carried out using the Origin 9.0 (OriginLab) ligand-binding macro module. Experimental data were fitted into the following equation to determine the IC50 values: y = min + (max − min)/(1 + 10x − log IC50), where y is the total binding, x is the log concentration of rhodamine-labeled Pam3CSK4, min is the nonspecific binding, and max is the maximum binding in the absence of ligand.
hTLR1 and hTLR2 protein expression and purification
The hTLR1 and hTLR2 proteins were expressed in the baculovirus insect cell expression system using the methods described by Iwaki et al. (38). Monolayers of Spodoptera frugiperda (Sf-9) cells were cotransfected with Bright Baculovirus DNA (BD BaculoGold) and the pVL1393 plasmid vector containing cDNA for TLR1 and TLR2. Viral titers were amplified to ~5 × 10⁷ to 10 × 107/ml virus particles. The recombinant viruses were used to infect suspension high 5 insect cells in serum-free medium (Insect-XPRESS Protein-free Insect Cell Medium with l-glutamine, Lonza) at 27°C, 130 rpm. After incubation of high 5 insect cells with recombinant TLR2 viruses for 3 days, the cells changed to green (fig. S8) and the TLR2-containing medium was collected after low-speed centrifugation and dialyzed [Slide-A-Lyzer G2 Dialysis Cassettes, 10,000 molecular weight cutoff (MWCO), Pierce] against 0.1 M tris buffer (pH 8.0) containing 0.3 M NaCl. The dialyzed medium was filtered and purified by a column of nickel nitrilotriacetic acid beads (Qiagen) according to the manufacturer’s instruction. The purified protein was finally dialyzed against 5 mM tris buffer (pH 7.4) containing 0.15 M NaCl and condensed by a centrifugal concentrator (Millipore, 10,000 MWCO). Electrophoretic analysis revealed that TLR2 exhibited a single band with a molecular mass of about 80 kD (fig. S10), which is comparable with previous work (38). About 100 μg of TLR2 protein was obtained from 500 ml of medium. After incubation of high 5 insect cells with recombinant TLR1 viruses for 2 days, the cells also changed to green and the TLR1-containing medium was collected after low-speed centrifugation. The medium was filtered and purified by a column of nProtein A Sepharose beads according to the manufacturer’s instruction (GE Healthcare). Electrophoretic analysis revealed that TLR1 exhibited a single band with a molecular mass of ~100 kD (fig. S10).
Microscale thermophoresis
Interactions between freshly prepared CU-T12-9 and TLR1 (or TLR2) were measured using MST (50) with a Monolith NT.115 (NanoTemper Technologies GmbH). Each protein was labeled with a fluorescent dye (NT-647) using Monolith NT Protein Labeling Kits (amine or cysteine reactive). Proteins were labeled and purified within 45 min. The concentration of NT-647–labeled TLR1 (or TLR2) was held constant at 10 nM, whereas the concentration of the nonlabeled CU-T12-9 was varied between 0.31 nM and 10 μM. The MST buffer contained 50 mM tris-HCl (pH 7.6), 150 mM NaCl, 10 mM MgCl2, and 0.05% Tween 20. Hydrophilic glass capillaries were used in all measurements. Apparent Kd values were determined using NanoTemper Analysis software.
SEC-LS assay
First, 60 μl of hTLR2 in PBS buffer (pH 7.4) was incubated at room temperature for 2 hours with indicated concentrations of CU-T12-9 or Pam3CSK4. Then, 60 μl of hTLR1 in PBS buffer (pH 7.4) was added to the reaction mixture, which was incubated at 37°C for an additional 2 hours. The hTLR1 and hTLR2 proteins were mixed in an equimolar ratio such that the final concentration of hTLR1 was 1 mg/ml (~10 μM) and hTLR2 was 0.8 mg/ml (~10 μM). All buffers and samples were filtered through a 0.1-μm filter. Then, 100 μl of prepared samples was analyzed by injection onto a Shodex KW80X size exclusion column running in PBS buffer (pH 7.4) with a flow rate of 1 ml/min. The column was in line with a multiangle light scattering detector (DAWN EOS, Wyatt Technologies), a refractive index detector (Optilab DSP, Wyatt Technologies), and an absorbance detector (UV 3000, Spectra System) for data collection. Data were analyzed with Astra 4.9 software (Wyatt Technologies).
MTT cell viability assay
In a 96-well plate, 40,000 HEK-Blue hTLR2 cells were seeded in 200 μl of growth medium [DMEM supplemented with 10% FBS, penicillin (100 U/ml), and streptomycin (100 mg/ml)]. Eight wells were left empty for blank controls. The plates were incubated at 37°C, 5% CO2 for 24 hours. In the next 24 hours of treatment, the medium was removed from the 96-well plate and replaced with 200 μl of supplemented Opti-MEM [0.5% FBS, penicillin (50 U/ml), streptomycin (50 μg/ml), 1× nonessential amino acids] containing 0 to 100 μM of compounds. Then, 20 μl (5 mg/ml in PBS) of MTT [3-(4,5-dimethylthiazol-2-yl)-2,5-diphenyltetrazolium bromide] solution was added to each well and incubated (37°C, 5% CO2) for another 4 hours to allow the MTT to be metabolized. The medium was removed and the plate was dried on paper towels to remove any residue. Then, 150 μl of DMSO was added in each well and shaken continuously for 40 min. When all the MTT metabolic products were dissolved, results were read by spectrophotometer at 560 nm. Optical density should be directly correlated with cell quantity. Cytotoxicity (%) was determined using the following formula: Cytotoxicity (%) = (1 − [Compounds (A560) − Background (A560)]/[Control (A560) – Background (A560)]) × 100.
Chemical synthesis
The syntheses of all the analogs are described in the Supplementary Materials.
Statistical analysis
An unpaired Student’s t test was used to evaluate the difference between the two treatments. EC50 values were calculated from sigmoidal dose-response curves with variable slope.
Supplementary Material
Acknowledgments
We thank H. Lu (University of Washington) for providing the HEK-Blue hTLR5 and hTLR8 cells for the experiment, and J.-O. Lee (Korea Advanced Institute of Science and Technology) and Y. Kuroki (Sapporo Medical University School of Medicine) for providing the TLR1 and sTLR2 DNA plasmids. Funding: We thank the NIH (R01GM101279 to H.Y.) for financial supports of this work. Author contributions: K.C., J.I.G., and H.Y. designed the experiments, analyzed the data, and wrote the manuscript. J.I.G. performed the NF-κB–GFP reporter cell line development. M.G. performed the concentration-dependent NMR experiment. P.N.B. and N.K. performed the MST binding assays. K.C. performed all other experiments. Competing interests: The authors declare that they have no competing interests.
SUPPLEMENTARY MATERIALS
Supplementary material for this article is available at http://advances.sciencemag.org/cgi/content/full/1/3/e1400139/DC1
General Methods
Fig. S1. Dose-dependent activation of SEAP signaling by analogs in HEK-Blue hTLR2 cells after 24 hours.
Fig. S2. The MTT cell viability of HEK-Blue hTLR2 cells after 24 hours of incubation with CU-T12-9 and antibodies.
Fig. S3. NO activation of CU-T12-9 can be suppressed by a TLR1/2 antagonist, but not by a TLR4 antagonist.
Fig. S4. Anisotropy assays for TLR1, TLR2, or TLR1/2 protein binding to rhodamine-labeled Pam3CSK4 (Rho-Pam3).
Fig. S5. Binding of CU-T12-9 to TLR1 by MST.
Fig. S6. Binding of CU-T12-9 to TLR2 by MST.
Fig. S7. TLR1 and TLR2 oligomeric states as seen by SEC-LS.
Fig. S8. Concentration-dependent 1H NMR experiments.
Fig. S9. HEK-Blue hTLR2 and Raw 264.7 cell viability upon CU-T12-9 treatment.
Fig. S10. Protein expression and characterization.
Table S1. SAR studies of the GA analogs in activation of SEAP signaling in HEK-Blue hTLR2 cells.
Scheme S1. General synthesis of TLR1/2 agonist GA.
Synthesis and experimental data.
REFERENCES AND NOTES
- 1.Kanzler H., Barrat F. J., Hessel E. M., Coffman R. L., Therapeutic targeting of innate immunity with Toll-like receptor agonists and antagonists. Nat. Med. 13, 552–559 (2007). [DOI] [PubMed] [Google Scholar]
- 2.Beutler B., Inferences, questions and possibilities in Toll-like receptor signalling. Nature 430, 257–263 (2004). [DOI] [PubMed] [Google Scholar]
- 3.O’Neill L. A., ‘Fine tuning’ TLR signaling. Nat. Immunol. 9, 459–461 (2008). [DOI] [PubMed] [Google Scholar]
- 4.Yoshida T., Mei H., Dörner T., Hiepe F., Radbruch A., Fillatreau S., Hoyer B. F., Memory B and memory plasma cells. Immunol. Rev. 237, 117–139 (2010). [DOI] [PubMed] [Google Scholar]
- 5.Steinman R. M., Banchereau J., Taking dendritic cells into medicine. Nature 449, 419–426 (2007). [DOI] [PubMed] [Google Scholar]
- 6.Dupont J., Altclas J., Lepetic A., Lombardo M., Vázquez V., Salgueira C., Seigelchifer M., Arndtz N., Antunez E., von Eschen K., Janowicz Z., A controlled clinical trial comparing the safety and immunogenicity of a new adjuvanted hepatitis B vaccine with a standard hepatitis B vaccine. Vaccine 24, 7167–7174 (2006).16884836 [Google Scholar]
- 7.Guha M., Anticancer TLR agonists on the ropes. Nat. Rev. Drug Discov. 11, 503–505 (2012). [DOI] [PubMed] [Google Scholar]
- 8.Cheng C., Jain P., Bettahi I., Pal S., Tifrea D., de la Maza L. M., A TLR2 agonist is a more effective adjuvant for a Chlamydia major outer membrane protein vaccine than ligands to other TLR and NOD receptors. Vaccine 29, 6641–6649 (2011). [DOI] [PMC free article] [PubMed] [Google Scholar]
- 9.Borsutzky S., Ebensen T., Link C., Becker P. D., Fiorelli V., Cafaro A., Ensoli B., Guzmán C. A., Efficient systemic and mucosal responses against the HIV-1 Tat protein by prime/boost vaccination using the lipopeptide MALP-2 as adjuvant. Vaccine 24, 2049–2056 (2006). [DOI] [PubMed] [Google Scholar]
- 10.Steinhagen F., Kinjo T., Bode C., Klinman D. M., TLR-based immune adjuvants. Vaccine 29, 3341–3355 (2011). [DOI] [PMC free article] [PubMed] [Google Scholar]
- 11.van Duin D., Mohanty S., Thomas V., Ginter S., Montgomery R. R., Fikrig E., Allore H. G., Medzhitov R., Shaw A. C., Age-associated defect in human TLR-1/2 function. J. Immunol. 178, 970–975 (2007). [DOI] [PubMed] [Google Scholar]
- 12.Vanneman M., Dranoff G.. Combining immunotherapy and targeted therapies in cancer treatment. Nat. Rev. Cancer 12, 237–251 (2012). [DOI] [PMC free article] [PubMed] [Google Scholar]
- 13.Zhang Y., Luo F., Cai Y., Liu N., Wang L., Xu D., Chu Y., TLR1/TLR2 agonist induces tumor regression by reciprocal modulation of effector and regulatory T cells. J. Immunol. 186, 1963–1969 (2011). [DOI] [PubMed] [Google Scholar]
- 14.Engel A. L., Holt G. E., Lu H. L., The pharmacokinetics of Toll-like receptor agonists and the impact on the immune system. Expert Rev. Clin. Pharmacol. 4, 275–289 (2011). [DOI] [PMC free article] [PubMed] [Google Scholar]
- 15.Arits A. H., Mosterd K., Essers B. A., Spoorenberg E., Sommer A., De Rooij M. J., van Pelt H. P., Quaedvlieg P. J., Krekels G. A., van Neer P. A., Rijzewijk J. J., van Geest A. J., Steijlen P. M., Nelemans P. J., Kelleners-Smeets N. W., Photodynamic therapy versus topical imiquimod versus topical fluorouracil for treatment of superficial basal-cell carcinoma: A single blind, non-inferiority, randomised controlled trial. Lancet Oncol. 14, 647–654 (2013). [DOI] [PubMed] [Google Scholar]
- 16.Lu H., Yang Y., Gad E., Wenner C. A., Chang A., Larson E. R., Dang Y., Martzen M., Standish L. J., Disis M. L., Polysaccharide krestin is a novel TLR2 agonist that mediates inhibition of tumor growth via stimulation of CD8 T cells and NK cells. Clin. Cancer Res. 17, 67–76 (2011). [DOI] [PMC free article] [PubMed] [Google Scholar]
- 17.Murata M., Activation of Toll-like receptor 2 by a novel preparation of cell wall skeleton from Mycobacterium bovis BCG Tokyo (SMP-105) sufficiently enhances immune responses against tumors. Cancer Sci. 99, 1435–1440 (2008). [DOI] [PMC free article] [PubMed] [Google Scholar]
- 18.Schmidt J., Welsch T., Jäger D., Mühlradt P. F., Büchler M. W., Märten A., Intratumoural injection of the toll-like receptor-2/6 agonist ‘macrophage-activating lipopeptide-2’ in patients with pancreatic carcinoma: A phase I/II trial. Br. J. Cancer 97, 598–604 (2007). [DOI] [PMC free article] [PubMed] [Google Scholar]
- 19.Tan A. C., Mifsud E. J., Zeng W., Edenborough K., McVernon J., Brown L. E., Jackson D. C., Intranasal administration of the TLR2 agonist Pam2Cys provides rapid protection against influenza in mice. Mol. Pharm. 9, 2710–2718 (2012). [DOI] [PubMed] [Google Scholar]
- 20.Nawijn M. C., Motta A. C., Gras R., Shirinbak S., Maazi H., van Oosterhout A. J., TLR-2 activation induces regulatory T cells and long-term suppression of asthma manifestations in mice. PLOS One 8, e55307 (2013). [DOI] [PMC free article] [PubMed] [Google Scholar]
- 21.Shechter R., London A., Kuperman Y., Ronen A., Rolls A., Chen A., Schwartz M., Hypothalamic neuronal toll-like receptor 2 protects against age-induced obesity. Sci. Rep. 3, 1254 (2013). [DOI] [PMC free article] [PubMed] [Google Scholar]
- 22.Takeuchi O., Hoshino K., Akira S., Cutting edge: TLR2-deficient and MyD88-deficient mice are highly susceptible to Staphylococcus aureus infection. J. Immunol. 165, 5392–5396 (2000). [DOI] [PubMed] [Google Scholar]
- 23.Jin M. S., Kim S. E., Heo J. Y., Lee M. E., Kim H. M., Paik S. G., Lee H., Lee J. O., Crystal structure of the TLR1-TLR2 heterodimer induced by binding of a tri-acylated lipopeptide. Cell 130, 1071–1082 (2007). [DOI] [PubMed] [Google Scholar]
- 24.Thiel P., Kaiser M., Ottmann C., Small-molecule stabilization of protein–protein interactions: An underestimated concept in drug discovery? Angew. Chem. Int. Ed. 51, 2012–2018 (2012). [DOI] [PubMed] [Google Scholar]
- 25.Cheng K., Wang X. H., Yin H., Small molecule inhibitors of the TLR3/dsRNA complex. J. Am. Chem. Soc. 133, 3764–3767 (2011). [DOI] [PMC free article] [PubMed] [Google Scholar]
- 26.Wang X. H., Smith C., Yin H., Targeting Toll-like receptors with small molecule agents. Chem. Soc. Rev. 42, 4859–4866 (2013). [DOI] [PMC free article] [PubMed] [Google Scholar]
- 27.Cheng K., Wang X. H., Zhang S. T., Yin H., Discovery of small-molecule inhibitors of the TLR1/TLR2 complex. Angew. Chem. Int. Ed. Engl. 51, 12246–12249 (2012). [DOI] [PMC free article] [PubMed] [Google Scholar]
- 28.Guan Y., Omueti-Ayoade K., Mutha S. K., Hergenrother P. J., Tapping R. I., Identification of novel synthetic Toll-like receptor 2 agonists by high throughput screening. J. Biol. Chem. 285, 23755–23762 (2010). [DOI] [PMC free article] [PubMed] [Google Scholar]
- 29.Hennessy E. J., Parker A. E., O’Neill L. A., Targeting Toll-like receptors: Emerging therapeutics? Nat. Rev. Drug Discov. 9, 293–307 (2010). [DOI] [PubMed] [Google Scholar]
- 30.Kang J. Y., Nan X., Jin M. S., Youn S. J., Ryu Y. H., Mah S., Han S. H., Lee H., Paik S. G., Lee J. O., Recognition of lipopeptide patterns by Toll-like receptor 2-Toll-like receptor 6 heterodimer. Immunity 31, 873–884 (2009). [DOI] [PubMed] [Google Scholar]
- 31.Kawai T., Akira S., Signaling to NF-κB by Toll-like receptors. Trends Mol. Med. 13, 460–469 (2007). [DOI] [PubMed] [Google Scholar]
- 32.Qiu D., Zhao G., Aoki Y., Shi L., Uyei A., Nazarian S., Ng J. C., Kao P. N., Immunosuppressant PG490 (triptolide) inhibits T-cell interleukin-2 expression at the level of purine-box/nuclear factor of activated T-cells and NF-κB transcriptional activation. J. Biol. Chem. 274, 13443–13450 (1999). [DOI] [PubMed] [Google Scholar]
- 33.SoRelle R., Nobel Prize awarded to scientists for nitric oxide discoveries. Circulation 98, 2365–2366 (1998). [DOI] [PubMed] [Google Scholar]
- 34.Lee C. C., Avalos A. M., Ploegh H. L.. Accessory molecules for Toll-like receptors and their function. Nat. Rev. Immunol. 12, 168–179 (2012). [DOI] [PMC free article] [PubMed] [Google Scholar]
- 35.Rolls A., Shechter R., London A., Ziv Y., Ronen A., Levy R., Schwartz M., Toll-like receptors modulate adult hippocampal neurogenesis. Nat. Cell Biol. 9, 1081–1088 (2007). [DOI] [PubMed] [Google Scholar]
- 36.L. A. J. O’Neill, Bryant C. E., Doyl S. L., Therapeutic targeting of Toll-like receptors for infectious and inflammatory diseases and cancer. Pharmacol. Rev. 61, 177–197 (2009). [DOI] [PMC free article] [PubMed] [Google Scholar]
- 37.Balkwill F., Tumour necrosis factor and cancer. Nat. Rev. Cancer 9, 361–371 (2009). [DOI] [PubMed] [Google Scholar]
- 38.Iwaki D., Mitsuzawa H., Murakami S., Sano H., Konishi M., Akino T., Kuroki Y., The extracellular Toll-like receptor 2 domain directly binds peptidoglycan derived from Staphylococcus aureus. J. Biol. Chem. 277, 24315–24320 (2002). [DOI] [PubMed] [Google Scholar]
- 39.Redpath S., Alam S. M., Lin C. M., O’Rourke A. M., Gascoigne N. R.. Cutting edge: Trimolecular interaction of TCR with MHC class II and bacterial superantigen shows a similar affinity to MHC:peptide ligands. J. Immunol. 163, 6–10 (1999). [PubMed] [Google Scholar]
- 40.Calderón Villalobos L. I., Lee S., De Oliveira C., Ivetac A., Brandt W., Armitage L., Sheard L. B., Tan X., Parry G., Mao H., Zheng N., Napier R., Kepinski S., Estelle M., A combinatorial TIR1/AFB–Aux/IAA co-receptor system for differential sensing of auxin. Nat. Chem. Biol. 8, 477–485 (2012) [DOI] [PMC free article] [PubMed] [Google Scholar]
- 41.Xu H. Q., Zhang A. H., Auclair C., Xi X. G., Simultaneously monitoring DNA binding and helicase‐catalyzed DNA unwinding by fluorescence polarization. Nucleic Acids Res. 31, e70 (2003). [DOI] [PMC free article] [PubMed] [Google Scholar]
- 42.Liu X., Wetzler L. M., Nascimento L. O., Massari P., Human airway epithelial cell responses to Neisseria lactamica and purified porin via Toll-like receptor 2-dependent signaling. Infect. Immun. 78, 5314–5323 (2010). [DOI] [PMC free article] [PubMed] [Google Scholar]
- 43.Wen J., Arakawa T., Philo J. S., Size-exclusion chromatography with on-line light-scattering, absorbance, and refractive index detectors for studying proteins and their interactions. Anal. Biochem. 240, 155–166 (1996). [DOI] [PubMed] [Google Scholar]
- 44.Wells J. A., McClendon C. L., Reaching for high-hanging fruit in drug discovery at protein–protein interfaces. Nature 450, 1001–1009 (2007). [DOI] [PubMed] [Google Scholar]
- 45.Gleeson M. P., Generation of a set of simple, interpretable ADMET rules of thumb. J. Med. Chem. 51, 817–834 (2008). [DOI] [PubMed] [Google Scholar]
- 46.Akira S., Uematsu S., Takeuchi O., Pathogen recognition and innate immunity. Cell 124, 783–801 (2006). [DOI] [PubMed] [Google Scholar]
- 47.Lahiri A., Das P., Chakravortty D., Engagement of TLR signaling as adjuvant: Towards smarter vaccine and beyond. Vaccine 26, 6777–6783 (2008). [DOI] [PubMed] [Google Scholar]
- 48.Nussler A. K., Glanemann M., Schirmeier A., Liu L., Nüssler N., Fluorometric measurement of nitrite/nitrate by 2,3-diaminonaphthalene. Nat. Protoc. 1, 2223–2226 (2006). [DOI] [PubMed] [Google Scholar]
- 49.Nolan T., Hands R. E., Bustin S. A., Quantification of mRNA using real-time RT-PCR. Nat. Protoc. 1, 1559–1582 (2006). [DOI] [PubMed] [Google Scholar]
- 50.Wienken C. J., Baaske P., Rothbauer U., Braun D., Duhr S.. Protein-binding assays in biological liquids using microscale thermophoresis. Nat. Commun. 1, 100 (2010). [DOI] [PubMed] [Google Scholar]
- 51.Medzhitov R., Toll-like receptors and innate immunity. Nat. Rev. Immunol. 1, 135–145 (2001). [DOI] [PubMed] [Google Scholar]
- 52.Piersanti G., Giorgi L., Bartoccini F., Tarzia G., Minetti P., Gallo G., Giorgi F., Castorina M., Ghirardi O., Carminati P., Synthesis of benzo(1,2-d;3,4-d′)diimidazole and 1H-pyrazolo(4,3-b)pyridine as putative A2A receptor antagonists. Org. Biomol. Chem. 5, 2567–2571 (2007). [DOI] [PubMed] [Google Scholar]
- 53.Kuz’menko T. A., Kuz’menko V. V., Simonov A. M., Korobov M. S., Filippov S. A., Unusual cleavage of phenacyl-substituted benzimidazolium salts. Synthesis of 1,4-diarylimidazoles. Chem. Hetero. Comp. 18, 293–297 (1982). [Google Scholar]
- 54.Liu Y. K., Lou S. J., Xu D. Q., Xu Z. Y., Regiospecific synthesis of nitroarenes by palladium-catalyzed nitrogen-donor-directed aromatic C–H nitration. Chemistry 16, 13590–13593 (2010). [DOI] [PubMed] [Google Scholar]
Associated Data
This section collects any data citations, data availability statements, or supplementary materials included in this article.
Supplementary Materials
Supplementary material for this article is available at http://advances.sciencemag.org/cgi/content/full/1/3/e1400139/DC1
General Methods
Fig. S1. Dose-dependent activation of SEAP signaling by analogs in HEK-Blue hTLR2 cells after 24 hours.
Fig. S2. The MTT cell viability of HEK-Blue hTLR2 cells after 24 hours of incubation with CU-T12-9 and antibodies.
Fig. S3. NO activation of CU-T12-9 can be suppressed by a TLR1/2 antagonist, but not by a TLR4 antagonist.
Fig. S4. Anisotropy assays for TLR1, TLR2, or TLR1/2 protein binding to rhodamine-labeled Pam3CSK4 (Rho-Pam3).
Fig. S5. Binding of CU-T12-9 to TLR1 by MST.
Fig. S6. Binding of CU-T12-9 to TLR2 by MST.
Fig. S7. TLR1 and TLR2 oligomeric states as seen by SEC-LS.
Fig. S8. Concentration-dependent 1H NMR experiments.
Fig. S9. HEK-Blue hTLR2 and Raw 264.7 cell viability upon CU-T12-9 treatment.
Fig. S10. Protein expression and characterization.
Table S1. SAR studies of the GA analogs in activation of SEAP signaling in HEK-Blue hTLR2 cells.
Scheme S1. General synthesis of TLR1/2 agonist GA.
Synthesis and experimental data.