

Abstract
Oncogenic levels of Myc expression sensitize cells to multiple apoptotic stimuli, and this protects long-lived organisms from cancer development. How cells discriminate physiological from supraphysiological levels of Myc is largely unknown. Here, we show that induction of apoptosis by Myc in breast epithelial cells requires association of Myc with Miz1. Gene expression and ChIP-Sequencing experiments show that high levels of Myc invade target sites that lack consensus E-boxes in a complex with Miz1 and repress transcription. Myc/Miz1-repressed genes encode proteins involved in cell adhesion and migration and include several integrins. Promoters of repressed genes are enriched for binding sites of the serum-response factor (SRF). Restoring SRF activity antagonizes Myc repression of SRF target genes, attenuates Myc-induced apoptosis, and reverts a Myc-dependent decrease in Akt phosphorylation and activity, a well-characterized suppressor of Myc-induced apoptosis. We propose that high levels of Myc engage Miz1 in repressive DNA binding complexes and suppress an SRF-dependent transcriptional program that supports survival of epithelial cells.
Keywords: Akt, apoptosis, Miz1, Myc
Introduction
Deregulated and enhanced expression of Myc contributes to the genesis of a large fraction, potentially the majority, of all human tumors (Dang, 2012). Paradoxically, high expression levels of Myc not only promote transformation, but also sensitize cells against a broad range of pro-apoptotic stimuli and enhance the cellular dependence on trophic factors provided by the cell's environment (Askew et al, 1991; Evan et al, 1992; Murphy et al, 2008). Like the induction of senescence by oncogenic RAS, sensitization to apoptosis by enhanced expression of Myc is a form of ‘intrinsic tumor suppression’ that protects long-lived organisms from tumorigenesis (Lowe et al, 2004). The ability of cells to respond in this manner has been reported from a multitude of experimental systems, suggesting that it is a central part of Myc biology (Nilsson & Cleveland, 2003).
How cells can discriminate between different levels of Myc is only beginning to emerge. Myc proteins bind broadly to enhancers and promoters of RNA polymerase II genes with an open chromatin structure (Guccione et al, 2006; Zeller et al, 2006; Chen et al, 2008). Comparing genome-wide occupancy profiles at different Myc levels shows that the apparent affinity of Myc for individual target sites varies widely, such that Myc highly occupies some promoters and enhancers in normal proliferating cells, whereas others are occupied to a detectable degree only in cells expressing oncogenic levels of Myc (Lin et al, 2012; Sabo et al, 2014; Walz et al, 2014). GO-term analyses show that differences in occupancy correlate with the function of encoded genes, such that functionally related genes have Myc binding sites with similar apparent affinity (Walz et al, 2014). These findings suggested that oncogenic levels of Myc ‘invade’ low-affinity binding sites and that genes with low-affinity promoters encode proteins with functions that are distinct from proteins encoded by genes that are regulated by physiological Myc levels. Consistent with this model is the identification of a group of genes that is regulated specifically by oncogenic Myc levels in a B-cell line, which expresses a tetracycline-inducible allele of Myc and which has been used to model Myc function in Burkitt lymphomas (Yustein et al, 2010).
Myc binds DNA together with a partner protein, Max, and Myc/Max heterodimers activate transcription (Meyer & Penn, 2008; Dang, 2012). Consistent with the broad binding of Myc to open promoters and enhancers, Myc is required for upregulation of virtually all induced genes during the mitogenic stimulation of primary B-cells, demonstrating that Myc can act as a ‘general amplifier’ of transcription (Lin et al, 2012; Nie et al, 2012). Surprisingly, Myc-driven tumor cells differ from their normal counterparts not only as they show enhanced expression, but also due to decreased expression of directly bound Myc target genes (Yustein et al, 2010). One reason for this is that Myc/Max heterodimers can repress transcription when they associate with Miz1 (Wiese et al, 2013; Walz et al, 2014). Complex formation with Miz1 is detectable in transformed, but not in primary cells, suggesting that it is a stress response to oncogenic Myc levels (Wolf et al, 2013; Walz et al, 2014).
Collectively, the available data suggest that transcriptional changes occurring specifically in response to oncogenic Myc levels —either due to invasion of low-affinity binding sites, complex formation with Miz1 or both—enable cells to discriminate physiological from oncogenic levels of Myc and sensitize cells toward apoptosis. Consistent with this model, RNA- and ChIP-Sequencing experiments in U20S cells that express a doxycycline-inducible allele of Myc had shown that genes encoding proteins involved in cell survival and suppression of apoptosis are occupied only at oncogenic levels of Myc and that these genes are repressed by Myc (Walz et al, 2014). Here, we tested this hypothesis in mammary epithelial cells, a well-established model of Myc-induced apoptosis (Partanen et al, 2007; Zhan et al, 2008).
Results
Myc promotes apoptosis of mammary epithelial cells in a Miz1-dependent manner
To test which aspects of Myc function require the interaction with Miz1 in epithelial cells, we used lentiviruses to stably express wild-type Myc (termed WT in the figures) and MycV394D (MycVD), a point mutant that is unable to bind to Miz1 and repress transcription via Miz1 (van Riggelen et al, 2010). We used lentiviruses carrying two different promoters: the phosphoglycerate kinase (PGK) promoter to express moderate levels of Myc and the spleen focus-forming virus (SFFV) promoter to express high levels of Myc in MCF10A, a non-tumorigenic mammary epithelial cell line (Fig1A). MCF10A cells carry a deletion of the CDKN2A/B locus that encodes Arf and have three copies of MYC; hence, endogenous Myc levels are slightly higher than in primary cells (Worsham et al, 2006). Comparison to endogenous levels showed that overall levels of Myc in cells expressing ectopic Myc from the PGK promoter were about twofold elevated relative to parental MCF10A cells (Fig1A; Supplementary Fig S1A). Levels of Myc driven from the SFFV promoter were higher and similar to those found in HeLa and HCT116 colon carcinoma cells, which are known to express high levels of endogenous Myc (Fig1A and shown for Myc-ER in Supplementary Fig S1A).
Figure 1.

- Immunoblot analysis documenting different Myc expression levels. The left panel shows levels of Myc in pools of cells infected with a virus that carries a PGK promoter (moderate levels); the right panel shows expression levels when Myc is expressed under the control of the SFFV promoter (high levels). Vinculin was used as a loading control (n = 3; unless otherwise indicated, n indicates the number of biological repeat experiments in the following legends).
- Myc and MycVD promote mammosphere formation. The indicated pools of MCF10A cells were grown under non-adherent conditions. The graph shows the number of secondary mammospheres formed per 1,000 plated cells. P-values were calculated using a Student's t-test (n = 3, ns: P > 0.05; **P ≤ 0.01; ****P ≤ 0.0001).
- Myc sensitizes MCF10A cells to apoptosis in a Miz1-dependent manner. The indicated pools of MCF10A cells expressing moderate Myc levels were grown under control or glutamine-deprived (−Gln) conditions for 24 h. Where indicated, doxorubicin was added (0.1 μg/ml; 24 h). The graph shows the percentage of early apoptotic (annexinV+/PI−) and late apoptotic (annexinV+/PI+; PI: propidium iodide) cells. Error bars show standard deviation (n = 3). P-values were calculated using a Student's t-test (*P ≤ 0.05; ***P ≤ 0.001).
- High levels of Myc and MycVD induce a CD44high/CD24low surface phenotype in mammary epithelial cells. Pools of infected cells were analyzed by FACS. The upper panels show a representative experiment in HMLE cells. The lower panels show the quantification of CD44high/CD24low cells in HMLE and MCF10A cells. Error bars show standard deviation (n = 3). P-values were calculated using a Student's t-test (**P ≤ 0.01; ****P ≤ 0.0001).
- High expression levels of Myc WT are counterselected more rapidly than MycVD in MCF10A cells. Upper panel: Cells were infected with the indicated vectors and harvested for immunoblots at the indicated time points. Vinculin was used as a loading control. A representative result is shown. Lower panel: Quantification of relative MYC levels from three independent biological experiments. P-values were calculated using a Student's t-test.
- Colony assays documenting growth of pools of MCF10A cells infected with the indicated SFFV promoter-based expression viruses. A representative result of crystal violet stainings is shown (n = 3).
- Photographs documenting growth of pools of MCF10A cells infected with the indicated SFFV promoter-based expression viruses in three-dimensional culture. Pictures were taken at day 4 of acinar culture. Scale bar, 50 μm.
At moderate expression levels (PGK), neither Myc nor MycVD significantly affected the growth of MCF10A cells (Supplementary Fig S1B). However, both Myc and MycVD accelerated cell cycle re-entry of serum-starved cells upon re-stimulation (Supplementary Fig S1C) and enhanced the sphere-forming (clonogenic) potential of these cells in non-adherent conditions (Fig1B). Ectopic expression of Myc is known to sensitize cells to a range of pro-apoptotic stimuli including glutamine starvation and DNA damage (Rupnow et al, 1998; Yuneva et al, 2007). Myc and MycVD differed in their pro-apoptotic properties, since more cells expressing Myc than cells expressing MycVD underwent apoptosis, both in unstressed conditions and upon glutamine starvation or exposure to doxorubicin (Fig1C).
Consistent with the effect of moderate Myc expression on sphere formation, high SFFV-driven expression levels of both wild-type Myc and MycVD induced a shift in a large percentage of the cell population to a CD44+/CD24low surface phenotype that is characteristic of mammary stem cells in MCF10A and in HMLE cells (Liu et al, 2009) (Fig1D). We noted in these experiments that expression of Myc decreased progressively during culture of both infected MCF10A and HMLE cells, whereas expression of MycVD was better tolerated during prolonged culture, arguing that cells that express high levels of Myc, but not cells expressing MycVD, are rapidly counterselected (Fig1E; Supplementary Fig S1D). In accord with this interpretation, elevated levels of Myc, but not of MycVD, suppressed colony formation of MCF10A cells and induced overt apoptosis in two-dimensional culture (Fig1F; Supplementary Fig S1E). Culturing MCF10A cells in matrigel also resulted in rapid death of cells expressing high levels of Myc, but not MycVD, arguing that death is not due to the two-dimensional culture conditions (Fig1G). We concluded that both sensitization to apoptosis by moderate levels of Myc and overt apoptosis induced by high levels of Myc require association with Miz1.
Characterization of Myc/Miz1-mediated apoptosis
To characterize the underlying molecular mechanisms and identify and compare genes directly regulated by Myc and MycVD, we generated MCF10A cells that express elevated levels of the steroid activatable Myc-ER (Myc-ER) and MycVD-ER chimeric proteins under the control of the SFFV promoter (Eilers et al, 1989; Littlewood et al, 1995). MCF10A cells do not express endogenous ERα (Lane et al, 1999). Immunoblots confirmed that the amounts of both proteins were identical in both cell pools (Fig2A). Incubation with increasing amounts of 4-OHT resulted in a concentration-dependent increase in nuclear Myc-ER and MycVD-ER (Supplementary Fig S2A). This was paralleled by a concentration-dependent increase in the percentage of both early (annexinV-positive) and late apoptotic (annexinV/propidium iodide-double positive) cells that express Myc-ER (Fig2B). While the relative proportion of early and late apoptotic cells varied between different experiments, addition of 4-OHT at any concentration elicited only a small increase in the percentage of either early or late apoptosis in cells expressing MycVD-ER (Fig2B). Consistently, 4-OHT-mediated activation of Myc-ER, but not MycVD-ER, induced a robust accumulation of p53 and cleavage of PARP at high Myc levels (Fig2C). Activation of Myc-ER, but not MycVD-ER, also induced apoptosis in HMLE mammary epithelial cells (Supplementary Fig S2B and C).
Figure 2.

- Immunoblot documenting levels of Myc and Myc-ER in pools of infected cells. MCF10A cells were infected with lentiviruses expressing Myc-ER or MycVD-ER under control of the SFFV promoter. Empty vector is termed ‘ctr’. Vinculin was used as a loading control (n = 3).
- Induction of apoptosis by Myc-ER is dose and Miz1 dependent. FACS assays documenting the percentage of early (annexinV+/PI−) and late (annexinV+/PI+) apoptotic cells after incubation of MCF10A cells with the indicated concentrations of 4-OHT for 48 h. Error bars show standard deviation (n = 3). The symbols for P-values refer to the difference between Myc-ER and MycVD-ER and are calculated for the sum of apoptotic cells with a Student's t-test (*P ≤ 0.05; **P ≤ 0.01; ***P ≤ 0.001; ****P ≤ 0.0001).
- High levels of Myc, but not of MycVD, induce p53 and cleavage of PARP. The panels show immunoblots of MCF10A-Myc-ER and MycVD-ER whole-cell lysates after culture in the presence of 5 nM or 100 nM 4-OHT for 24 h. Cdk2 is used as a loading control.
- Summary of microarray analyses of gene expression in MCF10A-Myc-ER and MycVD-ER cells upon incubation with 100 nM 4-OHT for 24 h. The y-axis shows change in gene expression in response to MycVD-ER (4-OHT versus control); the x-axis shows changes induced by activation of Myc-ER for significantly regulated probe IDs (P < 0.05). Arrays were performed from triplicate biological samples (r indicates Pearson's correlation coefficient for activated or repressed genes, respectively).
- GO-term analysis of genes that are repressed by Myc-ER (log2FC ≤ −0.5), but less by MycVD-ER (log2FC ≥ 0.5 for the difference between Myc-ER and MycVD-ER). The y-axis indicates significance as –log10 q-value (Benjamini); only significant GO-terms are shown.
- qRT-PCR assays documenting repression of the indicated genes in response to incubation of MCF10A-Myc-ER and MycVD-ER cells with 5 nM or 100 nM 4-OHT for 24 h. The y-axis shows fold repression relative to control cells. Bars represent mean plus SEM of at least 5 independent biological experiments. P-values were calculated using a Student's t-test (ns: P > 0.05; *P ≤ 0.05; **P ≤ 0.01).
We used a number of criteria to validate that Miz1-dependent induction of apoptosis shows characteristic features of Myc-induced apoptosis. Depletion of Max strongly attenuated Myc-induced apoptosis, validating that apoptosis was due to Myc-induced changes in transcription (Supplementary Fig S3A) (Amati et al, 1993). Analysis of two transcription-deficient mutants of Myc, MycΔBR that lacks the basic region, and MycD (MycT358D/S373D/T400D), which is strongly compromised in its ability to bind to Max (Huang et al, 2004), confirmed that binding to DNA and to Max is required for apoptosis (Supplementary Fig S3B). Consistent with previous observations (Hermeking & Eick, 1994; Nieminen et al, 2013), shRNA-mediated depletion of p53 (TP53) abolished Myc-induced apoptosis (Supplementary Fig S3C). Previous work had established that Myc activates expression of Bim (BCL2L11) and that Bim is a critical mediator of Myc-induced apoptosis (Egle et al, 2004; Hemann et al, 2005; Muthalagu et al, 2014). Consistent with these data, depletion of Bim or ectopic expression of Bcl-2, which buffers Bim, attenuated Myc-induced apoptosis (Supplementary Fig S3D and E). Both Myc and MycVD induced Bim to a similar extent, suggesting that elevated Bim levels are tolerated in cells expressing MycVD (Supplementary Fig S3F).
Miz1-dependent transcriptional repression by Myc
Neither induction of Myc nor of MycVD in proliferating MCF10A cells led to significant alterations in cellular RNA content (Supplementary Fig S4A). We therefore performed microarray experiments from triplicate biological samples to identify Myc-dependent changes in gene expression. These experiments identified 993 genes that were significantly induced and 804 genes that were repressed in response to activation of Myc-ER and MycVD-ER (P < 0.05). The ability of MycVD-ER to activate these target genes was very similar to that of wild-type Myc-ER (r = 0.785 for all activated genes) (Fig2D). In contrast, the ability of MycVD-ER to repress transcription was significantly compromised (r = 0.397; P < 2.2 × 10⁻¹⁶ for the difference between activation and repression; ANCOVA) (Fig2D). qRT-PCR analysis of individual genes confirmed the results of this analysis (Supplementary Fig S4B). Gene set enrichment analysis (GSEA) showed that genes activated by Myc and MycVD in MCF10A cells were similar to previously identified target genes of Myc (Supplementary Fig S4C). Importantly, GSEA confirmed that MycVD was compromised in its ability to repress known Myc targets and multiple other gene sets (Supplementary Fig S4C and D). GO-term analysis of genes that were differentially repressed by Myc and MycVD showed an enrichment of genes involved in apoptosis as well as in cell migration, cell adhesion, and angiogenesis (Fig2E). For example, integrins alpha1 and beta4 as well as laminins A3, B3, and C2 are repressed by Myc, but not by MycVD. This analysis is consistent with previous observations showing that multiple integrin genes are targets for Myc-dependent repression (Wilson et al, 2004; Gebhardt et al, 2006; Liu et al, 2012). The microarray analysis had been performed on samples exposed to 100 nM 4-OHT, which reflects high levels of Myc. qRT-PCR analyses of individual genes that are targets for Miz1-dependent repression showed that elevated concentrations of 4-OHT were required for Miz1-dependent repression since there was no significant repression at 5 nM 4-OHT (Fig2F).
Depletion of Miz1 was highly toxic in MCF10A cells, precluding an independent confirmation that repression of cell adhesion genes requires Miz1 (K.E. Wiese, unpublished data). To address this issue, we made use of the finding that U2OS cells tolerate depletion of Miz1. GO-term analysis and analysis of individual genes showed that genes repressed by wild-type Myc, but not MycVD, were highly similar in both cell lines (compare Fig2E with Supplementary Fig S5A). We have shown previously that depletion of Miz1 in U20S cells de-represses a large fraction of Myc-repressed genes and that for each gene, the degree of de-repression upon depletion of Miz1 parallels de-repression in cells expressing MycVD instead of wild-type Myc (Walz et al, 2014). This observation is recapitulated in Supplementary Fig S5B (left panel; each dot reflects expression for a bin of 70 genes). Importantly, the degree of de-repression upon depletion of Miz1 in U20S cells also paralleled the de-repression observed when MycVD-ER instead of Myc-ER is expressed in MCF10A cells for all genes that are repressed by Myc (Supplementary Fig S5B, right panel). The observation argues that Miz1-dependent repression is conserved between both cell types and that the lack of repression by the VD mutant is due to its inability to form a complex with Miz1.
Myc-dependent gene repression is detectable in human mammary tumors
Previous work has established that human breast tumors can be stratified according to the similarity between their gene expression pattern and genes regulated by Myc in tissue culture (Horiuchi et al, 2012). To test whether Miz1-dependent repression by Myc can be detected in mammary tumors, we initially showed that Miz1 is expressed both in triple negative breast tumors that express high levels of Myc and in low-grade tumors that express lower Myc levels (Fig3A). We then analyzed publically available data sets of gene expression in human breast cancer, taking a set of target genes that are activated by Myc as an initial measure for Myc activity (Schuhmacher et al, 2001; Miller et al, 2005). Consistent with Myc protein expression, the fraction of tumors expressing high levels of Myc-activated target genes increased with increasing grade (Fig3B). Notably, analyzing expression of a set of 50 genes that are repressed by wild-type Myc, but not by MycVD, showed the inverse relationship, with the fraction of tumors that express high levels of Myc/Miz1-repressed genes decreasing with increasing grade (Fig3B). Over all tumors and particularly among the grade 2 tumors, tumors expressing high levels of Myc-activated genes expressed low levels of Myc/Miz1-repressed genes and vice versa (Fig3B). Consistent with the tissue culture data, low-level expression of Myc/Miz1-repressed genes was significantly associated with mutation of p53 (Fig3B, P = 0.0066). Taken together, the data argue that Myc/Miz1-mediated repression occurs in human mammary tumorigenesis.
Figure 3.
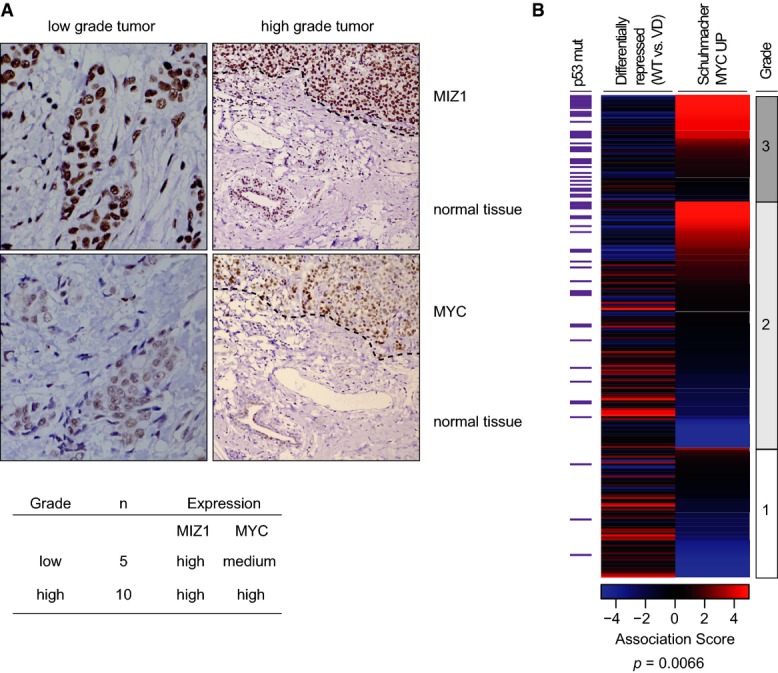
- Left: Immunohistochemistry documenting levels of Miz1 and Myc in low-grade (400× magnification) and high-grade (triple negative, 200× magnification) breast cancer. Dashed lines in the right panels separate tumor from normal tissue. Representative examples are shown. Right: Table summarizing the results of all analyzed tumor cases.
- Heatmap of gene expression in mammary tumors. The graph shows association scores documenting similarity of gene expression in a given tumor to the indicated predefined gene sets: red color shows high expression (high association score); blue color indicates low expression of genes contained in a given gene set (low association score). Tumor grade and p53 mutation status are indicated on the sides of the heatmap. The P-value refers to the correlation of low levels of Myc/Miz1 repressed genes with p53 mutation status and was calculated with the use of a Fisher's exact test.
Chromatin binding of Myc/Miz1 complexes
In order to test which effects on gene expression are direct, we performed ChIP-Sequencing experiments using antibodies directed against Miz1 and the ER-moiety of the Myc-ER fusion protein. We analyzed chromatin isolated from Myc-ER, MycVD-ER, and control cells grown in the presence and absence of 4-OHT (see Supplementary Table S1 for all statistics, Fig4A for example tracks and Supplementary Fig S6A for control immunoblots). Consistent with multiple published data on the association of Myc with chromatin, active Myc-ER proteins bound to thousands of promoters of RNA polymerase II-transcribed genes (Fig4B). In parallel, we performed ChIP-Sequencing for endogenous Miz1 under all experimental conditions (Fig4A–D). We have previously shown that Miz1 binds to limited number of core promoters (129) in primary neuronal progenitor cells, which carry a direct binding site for Miz1 in their promoter (Wolf et al, 2013). Miz1 occupied almost all of these sites in MCF10A cells (Supplementary Fig S6B). Consistent with results obtained in other cell types, genes with a consensus Miz1 binding sites were not regulated by Myc (Walz et al, 2014).
Figure 4.

- Example for ChIP-Sequencing tracks at the MRPS23 locus. ChIP-Seq was performed with the indicated antibodies from control MCF10A cells and from cells expressing either Myc-ER or MycVD-ER in the presence of 100 nM 4-OHT.
- Heatmap documenting binding of Myc-ER and endogenous Miz1 proteins to core promoters transcribed by RNA polymerase II at all human genes (UCSC RefSeq list) in a window of ±5 kb surrounding the transcription start site (TSS). Genes are ranked according to Myc occupancy.
- Distribution of Miz1 (top panel) and Myc-ER tags (bottom panel) in control cells (vector) and cells expressing Myc-ER in the presence or absence of 100 nM 4-OHT. Binding is shown for a window of ±5 kb around Miz1 peaks (found ±1.5 kb from a TSS) as reference coordinates.
- Distribution of Miz1 (top panel) and MycVD-ER tags (bottom panel) in control and MycVD-ER manipulated conditions. Binding is shown as in (C).
- Enrichment of consensus (CACGTG) and non-consensus (CANNTG) E-box sequences in binding sites that are bound by both Myc-ER and MycVD-ER (top panel) or in genes that are specifically bound only by Myc-ER jointly with Miz1 (bottom panel). The plots show enrichment over a defined background data set (Myc peaks in 4-OHT situation shifted by 500 bp).
- Occupancy of Myc-ER (left panel) and Miz1 (right panel) at Myc-activated and Myc-repressed genes in Myc-ER cells exposed to 100 nM 4-OHT.
Similar to observations made in human and mouse tumor cell lines, Miz1 bound a large number of sites that included between 1,288 and 3,718 core promoters (numbers given for a false discovery rate FDR ≤ 0.1) of RNA polymerase II-transcribed genes (Fig4B; Supplementary Fig S6B and Supplementary Table S1) (Walz et al, 2014). Chromatin binding of Miz1 to core promoters was not identical between the different experimental conditions, since activation of Myc-ER globally enhanced binding of Miz1 to core promoters (Fig4B and C). In cells expressing active Myc-ER, Miz1 bound to 3,718 core promoters and the binding site overlapped with a Myc binding site in 2,282 promoters (P < 2.2 × 10−308). The overall binding pattern of MycVD-ER was very similar to that of Myc-ER; however, promoter occupancy appeared lower, leading to a decrease in the number of promoters for which significant binding could be detected (Fig4B and D; Supplementary Table S1). In contrast to wild-type Myc-ER, activation of MycVD-ER did not increase binding of Miz1 to core promoters, arguing that wild-type Myc-ER and Miz1 bind co-operatively to core promoters (compare Fig4C with D).
Sites that are bound by both Myc and MycVD were enriched for the presence of consensus E-boxes (Fig4E, upper panel). In contrast, no significant enrichment of either Myc or Miz1 consensus binding sequences was observed at binding sites that were bound selectively by Myc-ER together with Miz1, but not by MycVD-ER (Fig4E, lower panel). The overall occupancy of Myc on activated promoters was higher than on repressed target genes, whereas the occupancy of both classes of promoters by Miz1 was similar (Fig4F). As a consequence, the ratio of Myc/Miz1 bound to Myc-repressed promoters is lower than on Myc-activated promoters. This is consistent with our previous observation that the ratio of Myc/Miz1 bound to a promoter correlates closely with the direction of the transcriptional response to Myc (Walz et al, 2014). Taken together, the data suggest that a fraction of active Myc-ER proteins, but not of MycVD-ER proteins, invades core promoters in a complex with Miz1, leading to transcriptional repression.
Myc/Miz1-repressed genes are enriched for genes regulated by serum-response factor (SRF)
To better understand how Miz1-dependent transcriptional repression sensitizes cells to apoptosis, we performed a second GSEA analysis searching for transcription factor binding sites that are enriched in promoters of Myc-repressed genes (Supplementary Fig S7A). Promoters of genes that are repressed by wild-type Myc-ER, but not by MycVD-ER, were enriched in binding sites for the serum-response factor (SRF), the structurally related myocyte enhancer factor 2 (Mef2) and c/EBPδ (Fig5A; Supplementary Fig S7A). Analysis of a set of genes that have SRF sites in their promoter confirmed that the majority of genes in this set are repressed by Myc-ER and less repressed by MycVD-ER (Supplementary Fig S7B). The identification of c/EBPδ as a regulator of Myc/Miz1-repressed genes is consistent with the observation that Miz1 represses the CEPD gene itself (Do-Umehara et al, 2013).
Figure 5.

- Promoters of Myc-repressed genes contain SRF motifs. Example plots for two SRF gene sets found in the GSEA analysis of motif gene sets (C3, see Supplementary Fig S7A for a list). The analysis was performed comparing cells expressing Myc-ER versus MycVD-ER. For one of these sets, the genes regulated in response to induction of Myc-ER are included as red dots in Supplementary Fig S7B. ES = enrichment score; NES = normalized enrichment score; FDR = false discovery rate.
- Plots documenting repression of murine Srf and Mrtf-A targets by Myc-ER versus MycVD-ER. Direct target genes of Srf and Mrtf-A in MEFs were used to generate custom gene sets and subjected to GSEA analysis.
- Venn diagrams documenting overlap of Srf- (left panel) or Srf/Mrtf-A (right panel)-bound genes with Myc-ER-regulated genes. P-values show significance of overlap between target genes (based on hypergeometric distribution).
- GO-term analysis demonstrating functional categories of direct Srf/Mrtf-A target genes (left panel) or target genes overlapping with Myc-repressed genes (right panel).
- Venn diagram showing overlap of Srf-bound genes with genes bound by Myc-ER and Miz1 in cells expressing active Myc-ER. P-value shows significance of overlap between target genes (based on hypergeometric distribution).
- Myc/Miz1 and SRF bind independently from each other. The distance between SRF (MCF7 cells, GSM1010839) and Myc binding sites (peak middle) at repressed target genes is plotted as the density estimate of a histogram. The Myc/Miz complex is shown for comparison.
Analysis of an experimentally identified set of direct target genes of murine Srf (Esnault et al, 2014) confirmed that Srf target genes are significantly repressed by Myc in a Miz1-dependent manner (Fig5B). SRF binds to two functional classes of genes, one of which encodes proteins involved in chromatin function. The other class encodes genes involved in cell adhesion, migration and apoptosis; SRF uses an actin-regulated co-activator, MRTF-A, to activate this class of genes (Posern & Treisman, 2006; Esnault et al, 2014). Myc-repressed genes are enriched in the latter class of SRF target genes (Fig5B–D). Consistent with the mRNA expression data, the set of promoters bound by both Myc and Miz1 overlapped significantly with SRF-bound promoters (Fig5E; P = 1.55−7). On promoters bound by SRF and by Myc/Miz1, individual binding sites usually do not overlap (Fig5F; Supplementary Fig S7C for examples) arguing that SRF and Myc/Miz1 bind independently of each other. Consistent with this notion, extensive co-immunoprecipitation revealed no evidence that Myc or Miz1 interact with SRF. qRT-PCR analysis of three SRF target genes showed that all three were repressed upon activation of Myc-ER (Supplementary Fig S7D). Importantly, repression by Myc was also observed in the presence of constitutively active RhoA, a major upstream activator of SRF, demonstrating that Myc does not regulate SRF indirectly via effects on Rho activity (Posern & Treisman, 2006) (Supplementary Fig S7D). We concluded that Myc represses multiple SRF target genes in a Miz1-dependent manner.
Restoration of SRF activity alleviates Myc-dependent apoptosis
As mentioned above, activation of target genes involved in cell adhesion and migration by SRF depends on an actin-regulated co-activator, MRTF-A. ΔN-MAL, an amino-terminally truncated allele of MRTF-A, lacks a domain that binds actin and regulates nucleocytoplasmic shuttling of MRTF-A and is hence constitutively active (Miralles et al, 2003; Vartiainen et al, 2007). Using lentiviral infection, we expressed ΔN-MAL in a doxycycline-inducible manner (Fig6A). qRT-PCR assays showed that ΔN-MAL activated SRF target genes and was able to restore normal expression in cells with active Myc (Fig6B). To test whether transcriptional repression of SRF target genes contributes to the pro-apoptotic properties of Myc, we used MCF10A cells that express moderate levels of Myc-ER; in the presence of 4-OHT, these cells displayed enhanced sensitivity to deprivation of glutamine and to DNA damage (doxorubicin) like their constitutive counterparts (Fig6C and D). In addition, they displayed enhanced sensitivity to TRAIL, a hallmark of cells expressing deregulated Myc (Fig6C and D) (Wang et al, 2004). Using activation of caspase-3 as an indicator of apoptosis, we found that induction of ΔN-MAL expression by addition of doxycycline had little effect on apoptosis in the absence of 4-OHT and in unstressed cells, but significantly attenuated cell death in response to deprivation of glutamine, to addition of TRAIL and to DNA damage in the presence of active Myc (Fig6C and D). Identical results were obtained using caspase-3/7 activity assays (Fig6E and F; Supplementary Fig S8A). AnnexinV/propidium iodide-staining confirmed that expression of ΔN-MAL had little effect on cell viability in control conditions, but reduced induction of apoptosis in the presence of 4-OHT (Fig6G; Supplementary Fig S8B). Expression of a constitutive active allele of SRF, SRF-VP16, mimicked the effects of ΔN-MAL on Myc-dependent apoptosis, arguing that SRF is indeed the critical target of ΔN-MAL (Fig6H).
Figure 6.

- Immunoblots documenting doxycycline-inducible expression of GFP-tagged ΔN-MAL (Dox) in MCF10A-Myc-ER cells. Cells were treated with 200 nM 4-OHT where indicated. Vinculin was used as a loading control. + = 0.025 μg/ml Dox, ++ = 1 μg/ml Dox.
- qRT-PCR assays documenting expression of SRF targets under the indicated experimental conditions. + = 1 μg/ml Dox (to induce ΔN-MAL) or 100 nM 4-OHT, respectively (n = 2). Bars represent mean + SD of technical triplicates (n = 2).
- Immunofluorescence assays using antibodies directed against cleaved caspase-3 in either control cultures or cultures exposed to TRAIL (50 ng/ml, 1.5 h), doxorubicin (0.1 μg/ml, 24 h) or deprived of glutamine (48 h). 100 nM 4-OHT and doxycycline (Dox, 1 μg/ml) were added where indicated. Nuclei were counterstained with Hoechst. Results are shown for a representative experiment.
- Quantification of (C). Error bars show SD of triplicate biological assays (n = 3). P-values were calculated using a Student's t-test (*P ≤ 0.05; **P ≤ 0.01).
- Caspase-3/7 activity assays documenting attenuation of Myc-dependent apoptosis after glucose or glutamine deprivation in response to expression of ΔN-MAL. Error bars show SD of triplicate biological assays (n = 3). P-values were calculated using a Student's t-test (**P ≤ 0.01).
- Same as (E), except that cells were treated with doxorubicin. P-values were calculated using a Student's t-test (*P ≤ 0.05).
- FACS assays documenting percentage of early apoptotic (annexinV+/PI−) and late apoptotic (annexinV+/PI+) cells under the indicated experimental conditions. Error bars show SD of triplicate biological assays (n = 3). P-values were calculated using a Student's t-test (*P ≤ 0.05).
- Caspase-3/7 activity assays documenting attenuation of Myc-dependent apoptosis after glutamine deprivation in response to expression of SRF-VP16. Error bars show SD of triplicate biological assays (n = 3). P-values were calculated using a Student's t-test (***P ≤ 0.001).
Akt activity is downstream of Myc and SRF
Multiple genes that are repressed by Myc/Miz1 and activated by SRF encode proteins that participate in signal transduction pathways and promote survival of epithelial cells (see Discussion). Integrins, for example, activate focal adhesion kinase (Fak) and integrin-linked kinase (Ilk), enhancing Akt phosphorylation at S473 and Akt activity as a downstream effector (Khwaja et al, 1997; Danen & Yamada, 2001; Troussard et al, 2003; Hannigan et al, 2005; Hehlgans et al, 2007). We confirmed that Fak and Ilk promote phosphorylation of Akt at S473 in MCF10A cells (Supplementary Fig S8C). Since Akt limits Myc-induced apoptosis (Kauffmann-Zeh et al, 1997), this raises the possibility that Myc might limit growth-factor-dependent survival signals and Akt activity via repression of SRF target genes. We therefore probed MCF10A cells for Akt activity in the presence of active Myc-ER, ΔN-MAL or both (Fig7A). In support of this model, activation of Myc attenuated phosphorylation of AktS473 and of the Akt downstream target, Gsk3S9. Induction of ΔN-MAL restored both AktS473 and Gsk3S9 phosphorylation in the presence of active Myc. Neither Myc nor ΔN-MAL had consistent effects on phosphorylation of Akt at T308, which is phosphorylated by Pdk1, or on phosphorylation of Mek (Fig7A). To probe the relevance of this regulation, we used MK-2206, a selective inhibitor of Akt kinases (Hirai et al, 2010). Consistent with previous observations (Kauffmann-Zeh et al, 1997), chemical inhibition of Akt had no significant effect on apoptosis in the absence of 4-OHT, but enhanced apoptosis in cells grown in the presence of 4-OHT (Fig7B). Furthermore, Akt inhibition diminished the ability of ΔN-MAL to alleviate Myc-induced apoptosis in glutamine-deprived cells (Fig7B).
Figure 7.

- Immunoblots documenting levels and phosphorylation status of the indicated proteins in MCF10A Myc-ER cells treated with Dox (1 μg/ml) and/or 4-OHT (200 nM) for 24 h.
- Effect of Akt inhibition on Myc-dependent sensitization to apoptosis and rescue by ΔN-MAL. Data show caspase-3/7 activity in Myc-ER cells treated with 4-OHT and/or doxycycline in control or glutamine-deprived (−Gln) conditions. Where indicated, cells were incubated with 250 nM Akt inhibitor MK-2206 for 24 h. Error bars show SEM (n = 3). P-values were calculated with a Student's t-test (ns: P > 0.05; *P ≤ 0.05).
- Effect of siRNA-mediated depletion of Akt1/2 on Myc-dependent sensitization to apoptosis and rescue by ΔN-MAL. The experiment was performed as in (B), except that cells were transfected with either 100 nM control siRNA or siRNA targeting Akt1/2 for 72 h. qRT-PCR assays showed an average 40% reduction in Akt1 and Akt2 mRNA levels (see Supplementary Fig S8D). Error bars show SD (n = 3); P-values were calculated with a Student's t-test (ns: P > 0.05; *P ≤ 0.05).
- Constitutively active Akt reverts Myc-dependent sensitization to apoptosis. MCF10A Myc-ER cells were infected with either control or retrovirus expressing v-akt. The upper panel shows caspase-3/7 activity in Myc-ER cells treated with 4-OHT in control or glutamine-deprived conditions. Error bars show SEM (n = 3). The lower panel shows an immunoblot documenting expression of v-akt. P-value was calculated using a Student's t-test (****P ≤ 0.0001).
- Model linking SRF/MRTF-A promoted adhesion signaling to phosphorylation of Akt S473 and survival of mammary epithelial cells. High levels of Myc and formation of the Myc/Miz1 complex inhibit SRF/MRTF-A target genes, adhesion and survival signaling, leading to the induction of apoptosis. Constitutive SRF/MRTF-A activity is expected to have little effect on Akt activity in control cells, but restores Akt activity in cells expressing high Myc levels.
Depletion of both Akt1 and Akt2 using a siRNA targeting both isoforms also blunted the ability of SRF to alleviate Myc-induced apoptosis (Fig7C; Supplementary Fig S8D). Since siRNA-mediated depletion of Akt also reduced cell growth in these assays, the total caspase activity shown here, which is normalized to cell number at the start of the experiment, slightly underestimates the apoptotic activity in wells treated with siAkt1/2. Conversely, expression of constitutively active Akt suppressed Myc-induced apoptosis in glutamine-deprived conditions (Fig7D). We concluded that repression of SRF activity by high Myc levels limits anti-apoptotic signaling via Akt and that this contributes to sensitizing MCF10A cells toward multiple apoptotic stimuli (see Fig7E for a model).
Discussion
Enhanced and oncogenic levels of Myc sensitize cells to stress-induced apoptosis and can even induce frank apoptosis (Nilsson & Cleveland, 2003). A large body of evidence validates Myc-induced apoptosis as a tumor-suppressive mechanism in vivo (Eischen et al, 1999; Pelengaris et al, 2002; Egle et al, 2004; Hemann et al, 2005). Downstream effectors that mediate Myc-induced apoptosis include BIM, which is a direct target gene that is transcriptionally upregulated by Myc, and the Arf-protein that is stabilized by Myc (Zindy et al, 1998; Egle et al, 2004; Chen et al, 2013; Muthalagu et al, 2014). In addition, several previous observations suggest that transcriptional repression via Miz1 contributes to Myc-induced apoptosis in tissue culture and in vivo (Patel & McMahon, 2006, 2007; van Riggelen et al, 2010). In this report, we addressed the question why cells induce apoptosis specifically in response to supraphysiological levels of Myc, using mammary epithelial cells as model. We show that oncogenic levels of Myc repress genes that encode signaling proteins required to maintain the activity of Akt, a kinase that provides a critical survival signal for epithelial cells and for cells expressing elevated Myc levels (Kauffmann-Zeh et al, 1997; Altman et al, 2011).
Previous work has established that both variations in DNA sequence and chromatin structure affect the apparent affinity of Myc for different promoters (Blackwell et al, 1993; Guccione et al, 2006; Sauve et al, 2007; Rodrik-Outmezguine et al, 2011; Guo et al, 2014). ChIP-sequencing studies in human tumor cells and in mouse models show that oncogenic levels of Myc ‘invade’ low-affinity binding sites, allowing a discrimination between genes bound and regulated by physiological and by high levels of Myc (Lin et al, 2012; Sabo et al, 2014; Walz et al, 2014). In tumor cells, high levels of Myc also recruit Miz1 to core promoters and the ratio of Myc and Miz1 bound to each promoter correlates with the transcriptional response to changes in Myc levels (Walz et al, 2014). Consistent with these previous findings, we showed here that activation of wild-type Myc-ER, but not of MycVD-ER, enhances binding of Miz1 to core promoters. Only a small proportion of promoters that are specifically bound by Myc, but not by MycVD, had consensus E-boxes and all lacked consensus Miz1-binding sites. Since the presence of consensus Myc binding sequences enhances binding affinity in vitro (Sauve et al, 2007) and correlates with enhanced occupancy in vivo (Guo et al, 2014), we suggest that these promoters have a low affinity for Myc. Notably, the Arf-protein promotes assembly of Myc/Miz1 complexes, suggesting that Myc/Miz1-dependent repression is itself a stress-regulated pathway (Herkert et al, 2010; Inoue et al, 2013; Peter et al, 2014).
Joint target genes of Myc and Miz1 overlapped significantly with genes that are upregulated by several transcription factors. A significant overlap was observed with genes bound and activated by the serum-response factor, SRF (Posern & Treisman, 2006). The use of an amino-terminally truncated and constitutively active allele of the SRF-co-activator MRTF-A (ΔN-MAL) (Vartiainen et al, 2007), allowed us to override Myc-dependent repression of SRF target genes. Restoring SRF activity significantly attenuated sensitization to three paradigmatic inducers of Myc-induced apoptosis, exposure to DNA damaging agents, deprivation of glutamine and exposure to the TRAIL death receptor ligand. We obtained no evidence that Myc or Miz1 interacts with SRF directly and the binding sites of both factors on jointly bound promoters do not overlap, arguing that repression is not due to a direct interaction of these factors. Transcriptional activation by SRF requires histone acetylation (Alberts et al, 1998); conversely, repression by Myc correlates with histone de-acetylation at target promoters (Walz et al, 2014). Most likely, therefore, Myc/Miz1 complexes repress SRF target genes by recruiting histone deacetylases to joint target promoters.
Myc-induced apoptosis is inhibited by the Akt protein kinase (Kauffmann-Zeh et al, 1997). Multiple integrins, including those that are repressed by Myc via Miz1 in mammary epithelial cells, are upstream activators of PI3-kinase and Akt (King et al, 1997; Velling et al, 2004; Dennis et al, 2012). In addition, Myc, but not MycVD, represses multiple additional genes directly involved in signal transduction, including Sos2, neuregulin-1 (NRG1; a ligand of Erbb3), Neuropilin-1 (VEGF receptor), TGFbeta receptor II, and the Styk1 kinase that complexes with Akt. Akt activity requires phosphorylation at two sites, threonine 308 (T308) and serine 473 (S473) (Fayard et al, 2010). We found that high levels of Myc reduced phosphorylation of AktS473 and Gsk3S9 and activation of SRF restores phosphorylation of both sites. We therefore propose that one mechanism by which Myc/Miz1-mediated repression sensitizes epithelial cells to apoptosis is via reducing adhesive interactions with the microenvironment that normally provide Akt-dependent pro-survival signals; in this model, Myc-induced apoptosis is mechanistically similar to anoikis (Fig7E) (Khwaja et al, 1997). Akt protects cells from apoptosis in part since it phosphorylates and thereby inactivates the pro-apoptotic Bad protein (Datta et al, 1997). Myc also induces expression of Bim, a BH3-only pro-apoptotic protein (Muthalagu et al, 2014). Downstream of Myc, both repression of SRF and induction of Bim may therefore alter the balance of pro- to anti-apoptotic proteins at the mitochondrial outer membrane and thereby sensitize cells to induction of apoptosis. In this model, induction of Bim is not sufficient to induce frank apoptosis as long as SRF is active as observed in MCF10A cells. A decrease in Akt is also expected to activate Gsk3 kinase that phosphorylates Myc at T58; phosphorylation at this site promotes Myc turnover and enhances Myc-induced apoptosis (Welcker et al, 2004; Yeh et al, 2004; Hemann et al, 2005; Wang et al, 2011). Repression of SRF target genes may therefore also provide a feedback signal that reduces Myc expression by ubiquitin-mediated proteolysis and that ensures that Myc-dependent transcription is geared toward apoptosis in tumor cells, in which degradation of Myc is compromised.
Materials and Methods
Tissue culture and lentiviral transduction
HMLE and MCF10A cells were maintained in DMEM/F-12 supplemented with 1% penicillin/streptomycin, 10 μg/ml insulin, 0.5 μg/ml hydrocortisone and 20 ng/ml EGF. For MCF10A cells, 5% horse serum and 100 μg/ml cholera toxin were added. HeLa, HCT116 and HEK293TN cells were grown in DMEM with 10% FCS and 1% penicillin/streptomycin.
Three-dimensional culture of MCF10A cells was performed as previously described (Debnath et al, 2003). To score mammosphere formation, single-cell suspensions of MCF10A cells were seeded into 24-well ultralow attachment plates at a density of 2 × 10⁴ cells/ml (primary culture) or 5 × 10³ cells/ml for secondary sphere formation, in DMEM/F-12 containing 1% penicillin/streptomycin, 1% methylcellulose, 5 μg/ml insulin, 0.5 μg/ml hydrocortisone, 20 ng/ml EGF, 4 μg/ml heparin and 2% B27.
MCF10A cells transduced with pBabeMYC-ER have been described previously (Nieminen et al, 2007). Lentiviral particles were produced in HEK293TN cells with the 2nd-generation packaging plasmids psPAX2 and pMD2.G (provided by Didier Trono). To achieve stable lentiviral overexpression of MYC or MYC-ER fusion proteins, cells were transduced with pRRL-SFFV, pRRL-PGK or pLeGO-G/Puro vectors in the presence of 8 μg/ml protamine sulfate and selected with 85 μg/ml hygromycin B or 1 μg/ml puromycin 48 h later. Cells transduced with GFP-tagged ΔN-MRTF in pInducer20 were selected with 200 μg/ml neomycin.
Cells were transfected with siRNA AKT1/2 (Cell Signaling Technology, #6211) or control siRNA (Qiagen) using HiPerFect transfection reagent (Qiagen) and incubated for 72 h before analysis.
Pools of cells were either treated with 4-OHT to induce MYC-ER activity (100 nM unless indicated otherwise), doxycycline (1 μg/ml) to induce expression of ΔN-MAL or ethanol as solvent control.
Flow cytometry and caspase-3/7 analysis
To determine the percentage of apoptotic cells, supernatants of respective cultures were harvested and pooled with adherent cells after trypsinization. Cell pellets were resuspended in annexinV-binding buffer (10 mM HEPES, pH 7.4; 140 mM NaCl; 2.5 mM CaCl2) and then stained with recombinant annexinV conjugated to Pacific Blue. Propidium iodide was added immediately prior to acquisition on a BD FACSCanto II flow cytometer. Cell surface stainings of HMLE or MCF10A cells were performed with fluorochrome-conjugated antibodies against CD44 (APC) and CD24 (FITC) in PBS, 10% FCS. Caspase activity was measured using the Caspase-Glo 3/7 luminescence kit (Promega) with VICTORTMX3 (PerkinElmer).
Gene expression and microarray analysis
Total RNA was extracted using peqGOLD TriFast Reagent (PEQLAB) according to the manual. M-MLV Reverse Transcriptase (Invitrogen) was used to synthesize first-strand cDNA with random hexamer primers (Roche). qRT-PCRs were performed in technical triplicates using ABsolute SYBR Green Mix (Thermo Scientific) on an Agilent MX3000P system. Data were quantified with the comparative CT method using RPS14 as reference for normalization. Primers are listed in Supplementary Table S3.
For microarray analysis, total RNA was extracted with QIAGEN RNeasy Kit and on-column DNAse-digested. Labeling and hybridization were performed following Agilent two-color microarray-based gene expression analysis protocol, and slides (Agilent Human Genome Microarray 4 × 44 K v2) were scanned using an Agilent DNA Microarray Scanner G2505C with Agilent Scan Control version A.8.1.3 software.
Immunoblotting
Adherent cells were lysed in sonication buffer (50 mM HEPES; 140 mM NaCl; 1 mM EDTA; 1% Triton X-100; 0.1% sodium deoxycholate; 0.1% SDS) containing protease and phosphatase inhibitor cocktails (Sigma). Preparation of nuclear extracts was achieved by incubating cells with swelling buffer (25 mM HEPES; 1.5 mM MgCl2; 10 mM KCl; 0.1% NP-40; 1 mM DTT) and subsequent lysis of the nuclear pellets in sonication buffer. Protein lysates were boiled in Laemmli sample buffer, separated by SDS–PAGE and transferred to a PVDF membrane (Millipore). Antibodies are listed in Supplementary Table S2.
ChIP-Sequencing and statistical analyses
Cells were induced with 100 nM 4-OHT for 1 h and cross-linked with 1% formaldehyde at room temperature. Nuclei were isolated as described above, and sonication was performed in a Branson sonifier to achieve fragment sizes < 300 bp. Prior to immunoprecipitation, anti-ERα or anti-Miz1 (10E2) antibodies were coupled to Protein A or G-magnetic beads, respectively (Dynabeads, Invitrogen). Bound chromatin was eluted with 1% SDS and decross-linked DNA was purified by phenol–chloroform extraction. ChIP-DNA library preparation was performed with NEBNext ChIP Prep Master Mix Set for Illumina. Fragments were size-selected on an agarose gel, purified with Qiagen gel extraction kit and PCR-amplified. Quality of the DNA library was analyzed with an Experion DNA Chip (Bio-Rad) and quantified using a picogreen assay. Sequencing was performed on an Illumina GAIIx sequencer. After quality control, fastq files were normalized to equal tag counts and aligned to the human genome (hg19) using Bowtie v0.12.8. SAMtools was used to generate binary files, and peaks were called with MACS-1.4.2 using a mixed-input sample as control. Annotated peak lists were generated by closestBed command (BEDTools-2.17.0) using a UCSC annotation file of RefSeq transcriptional start sites. Integrated Genome Browser software 8.0 was used to visualize ChIP-Seq tracks in wig format. seqMINER density array method was employed to generate distributions of tags around respective reference coordinates, and data were visualized as histograms using R (http://www.R-project.org) or as heatmap with Java Treeview software. Genomic Srf binding data are taken from Esnault et al (2014) or downloaded from GEO (MCF7 data set, GSM1010839). Microarray and ChIP-Sequencing data have been deposited to the GEO repository and are available under series record GSE59001 (Muthalagu et al, 2014) and reference series GSE59147.
Expression data and additional phenotypic data for the Miller data set were downloaded from the Bioconductor homepage as part of the breast CancerUPP library. For calculation of association scores, we used a method that was previously used to determine the expression of an embryonic stem cell signature in breast cancer patients (Mizuno et al, 2010). All statistical analysis was performed using R environment. Unless indicated otherwise, P-values were calculated using an unpaired, two-sided Student's t-test. P-values for calculating the significance of overlaps between different lists are based on a hypergeometric distribution.
Acknowledgments
We thank Michael Krause and Lukas Rycak for performing and analyzing the microarray experiments; the Biomedicum Imaging Unit and Biomedicum Functional Genomics Unit (U. Helsinki) for core services; and Renate Metz, Tiina Raatikainen, Sabine Roth, and Wolfgang Hädelt for excellent technical assistance. HMLE cells were obtained from R. Weinberg, and MCF10A cells were a kind gift from M. Bentires-Alj. We thank A. Schambach and J. Kühle for lentiviral vectors; J. Downward for v-akt-; and D. Brandt for the ΔN-MAL/SRF-plasmids. This work was supported by grants of the Thyssen-Stiftung and the Deutsche Forschungsgemeinschaft (DFG 222/12-1) to M.E. as well as grants from the Academy of Finland (J.K), Finnish Cancer Organizations (to J.K.) and Integrative Life Science Doctoral Program/U.Helsinki (to H.M.H.).
Author contributions
KEW, HMH, BvE, EW, and CE performed the experiments; KEW, BvE, EW, AR, and RT analyzed data; AR, RT, JK, and ME designed experiments; and ME wrote the paper.
Conflict of interest
The authors declare that they have no conflict of interest.
Supporting Information
Supplementary Figure S1
Supplementary Figure S2
Supplementary Figure S3
Supplementary Figure S4
Supplementary Figure S5
Supplementary Figure S6
Supplementary Figure S7
Supplementary Figure S8
Supplementary Table S1
Supplementary Table S2
Supplementary Table S3
Supplementary Figure and Table Legends
Review Process File
References
- Alberts AS, Geneste O, Treisman R. Activation of SRF-regulated chromosomal templates by Rho-family GTPases requires a signal that also induces H4 hyperacetylation. Cell. 1998;92:475–487. doi: 10.1016/s0092-8674(00)80941-1. [DOI] [PubMed] [Google Scholar]
- Altman JK, Sassano A, Kaur S, Glaser H, Kroczynska B, Redig AJ, Russo S, Barr S, Platanias LC. Dual mTORC2/mTORC1 targeting results in potent suppressive effects on acute myeloid leukemia (AML) progenitors. Clin Cancer Res. 2011;17:4378–4388. doi: 10.1158/1078-0432.CCR-10-2285. [DOI] [PMC free article] [PubMed] [Google Scholar]
- Amati B, Littlewood TD, Evan GI, Land H. The c-Myc protein induces cell cycle progression and apoptosis through dimerization with Max. EMBO J. 1993;13:5083–5087. doi: 10.1002/j.1460-2075.1993.tb06202.x. [DOI] [PMC free article] [PubMed] [Google Scholar]
- Askew DS, Ashmun RA, Simmons BC, Cleveland JL. Constitutive c-myc expression in an IL-3-dependent myeloid cell line suppresses cell cycle arrest and accelerates apoptosis. Oncogene. 1991;6:1915–1922. [PubMed] [Google Scholar]
- Blackwell TK, Huang J, Ma A, Kretzner L, Alt FW, Eisenman RN, Weintraub H. Binding of Myc proteins to canonical and noncanonical DNA sequences. Mol Cell Biol. 1993;13:5216–5224. doi: 10.1128/mcb.13.9.5216. [DOI] [PMC free article] [PubMed] [Google Scholar]
- Chen X, Xu H, Yuan P, Fang F, Huss M, Vega VB, Wong E, Orlov YL, Zhang W, Jiang J, Loh YH, Yeo HC, Yeo ZX, Narang V, Govindarajan KR, Leong B, Shahab A, Ruan Y, Bourque G, Sung WK, et al. Integration of external signaling pathways with the core transcriptional network in embryonic stem cells. Cell. 2008;133:1106–1117. doi: 10.1016/j.cell.2008.04.043. [DOI] [PubMed] [Google Scholar]
- Chen D, Kon N, Zhong J, Zhang P, Yu L, Gu W. Differential effects on ARF stability by normal versus oncogenic levels of c-Myc expression. Mol Cell. 2013;51:46–56. doi: 10.1016/j.molcel.2013.05.006. [DOI] [PMC free article] [PubMed] [Google Scholar]
- Danen EH, Yamada KM. Fibronectin, integrins, and growth control. J Cell Physiol. 2001;189:1–13. doi: 10.1002/jcp.1137. [DOI] [PubMed] [Google Scholar]
- Dang CV. MYC on the path to cancer. Cell. 2012;149:22–35. doi: 10.1016/j.cell.2012.03.003. [DOI] [PMC free article] [PubMed] [Google Scholar]
- Datta SR, Dudek H, Tao X, Masters S, Fu H, Gotoh Y, Greenberg ME. Akt phosphorylation of BAD couples survival signals to the cell- intrinsic death machinery. Cell. 1997;91:231–241. doi: 10.1016/s0092-8674(00)80405-5. [DOI] [PubMed] [Google Scholar]
- Debnath J, Muthuswamy SK, Brugge JS. Morphogenesis and oncogenesis of MCF-10A mammary epithelial acini grown in three-dimensional basement membrane cultures. Methods. 2003;30:256–268. doi: 10.1016/s1046-2023(03)00032-x. [DOI] [PubMed] [Google Scholar]
- Dennis MD, Jefferson LS, Kimball SR. Role of p70S6K1-mediated phosphorylation of eIF4B and PDCD4 proteins in the regulation of protein synthesis. J Biol Chem. 2012;287:42890–42899. doi: 10.1074/jbc.M112.404822. [DOI] [PMC free article] [PubMed] [Google Scholar]
- Do-Umehara HC, Chen C, Urich D, Zhou L, Qiu J, Jang S, Zander A, Baker MA, Eilers M, Sporn PH, Ridge KM, Sznajder JI, Budinger GR, Mutlu GM, Lin A, Liu J. Suppression of inflammation and acute lung injury by Miz1 via repression of C/EBP-delta. Nat Immunol. 2013;14:461–469. doi: 10.1038/ni.2566. [DOI] [PMC free article] [PubMed] [Google Scholar] [Retracted]
- Egle A, Harris AW, Bouillet P, Cory S. Bim is a suppressor of Myc-induced mouse B cell leukemia. Proc Natl Acad Sci USA. 2004;101:6164–6169. doi: 10.1073/pnas.0401471101. [DOI] [PMC free article] [PubMed] [Google Scholar]
- Eilers M, Picard D, Yamamoto KR, Bishop JM. Chimaeras of myc oncoprotein and steroid receptors cause hormone-dependent transformation of cells. Nature. 1989;340:66–68. doi: 10.1038/340066a0. [DOI] [PubMed] [Google Scholar]
- Eischen CM, Weber JD, Roussel MF, Sherr CJ, Cleveland JL. Disruption of the ARF-Mdm2-p53 tumor suppressor pathway in Myc-induced lymphomagenesis. Genes Dev. 1999;13:2658–2669. doi: 10.1101/gad.13.20.2658. [DOI] [PMC free article] [PubMed] [Google Scholar]
- Esnault C, Stewart A, Gualdrini F, East P, Horswell S, Matthews N, Treisman R. Rho-actin signaling to the MRTF coactivators dominates the immediate transcriptional response to serum in fibroblasts. Genes Dev. 2014;28:943–958. doi: 10.1101/gad.239327.114. [DOI] [PMC free article] [PubMed] [Google Scholar]
- Evan GI, Wyllie AH, Gilbert CS, Littlewood TD, Land H, Brooks M, Waters CM, Penn LZ, Hancock DC. Induction of apoptosis in fibroblasts by c-myc protein. Cell. 1992;69:119–128. doi: 10.1016/0092-8674(92)90123-t. [DOI] [PubMed] [Google Scholar]
- Fayard E, Xue G, Parcellier A, Bozulic L, Hemmings BA. Protein kinase B (PKB/Akt), a key mediator of the PI3K signaling pathway. Curr Top Microbiol Immunol. 2010;346:31–56. doi: 10.1007/82_2010_58. [DOI] [PubMed] [Google Scholar]
- Gebhardt A, Frye M, Herold S, Benitah SA, Braun K, Samans B, Watt FM, Elsasser HP, Eilers M. Myc regulates keratinocyte adhesion and differentiation via complex formation with Miz1. J Cell Biol. 2006;172:139–149. doi: 10.1083/jcb.200506057. [DOI] [PMC free article] [PubMed] [Google Scholar]
- Guccione E, Martinato F, Finocchiaro G, Luzi L, Tizzoni L, Dall' Olio V, Zardo G, Nervi C, Bernard L, Amati B. Myc-binding-site recognition in the human genome is determined by chromatin context. Nat Cell Biol. 2006;8:764–770. doi: 10.1038/ncb1434. [DOI] [PubMed] [Google Scholar]
- Guo J, Li T, Schipper J, Nilson KA, Fordjour FK, Cooper JJ, Gordan R, Price DH. Sequence specificity incompletely defines the genome-wide occupancy of Myc. Genome Biol. 2014;15:482. doi: 10.1186/s13059-014-0482-3. [DOI] [PMC free article] [PubMed] [Google Scholar]
- Hannigan G, Troussard AA, Dedhar S. Integrin-linked kinase: a cancer therapeutic target unique among its ILK. Nat Rev Cancer. 2005;5:51–63. doi: 10.1038/nrc1524. [DOI] [PubMed] [Google Scholar]
- Hehlgans S, Haase M, Cordes N. Signalling via integrins: implications for cell survival and anticancer strategies. Biochim Biophys Acta. 2007;1775:163–180. doi: 10.1016/j.bbcan.2006.09.001. [DOI] [PubMed] [Google Scholar]
- Hemann MT, Bric A, Teruya-Feldstein J, Herbst A, Nilsson JA, Cordon-Cardo C, Cleveland JL, Tansey WP, Lowe SW. Evasion of the p53 tumour surveillance network by tumour-derived MYC mutants. Nature. 2005;436:807–811. doi: 10.1038/nature03845. [DOI] [PMC free article] [PubMed] [Google Scholar]
- Herkert B, Dwertmann A, Herold S, Abed M, Naud JF, Finkernagel F, Harms GS, Orian A, Wanzel M, Eilers M. The Arf tumor suppressor protein inhibits Miz1 to suppress cell adhesion and induce apoptosis. J Cell Biol. 2010;188:905–918. doi: 10.1083/jcb.200908103. [DOI] [PMC free article] [PubMed] [Google Scholar]
- Hermeking H, Eick D. Mediation of c-Myc-induced apoptosis by p53. Science. 1994;265:2091–2093. doi: 10.1126/science.8091232. [DOI] [PubMed] [Google Scholar]
- Hirai H, Sootome H, Nakatsuru Y, Miyama K, Taguchi S, Tsujioka K, Ueno Y, Hatch H, Majumder PK, Pan BS, Kotani H. MK-2206, an allosteric Akt inhibitor, enhances antitumor efficacy by standard chemotherapeutic agents or molecular targeted drugs in vitro and in vivo. Mol Cancer Ther. 2010;9:1956–1967. doi: 10.1158/1535-7163.MCT-09-1012. [DOI] [PubMed] [Google Scholar]
- Horiuchi D, Kusdra L, Huskey NE, Chandriani S, Lenburg ME, Gonzalez-Angulo AM, Creasman KJ, Bazarov AV, Smyth JW, Davis SE, Yaswen P, Mills GB, Esserman LJ, Goga A. MYC pathway activation in triple-negative breast cancer is synthetic lethal with CDK inhibition. J Exp Med. 2012;209:679–696. doi: 10.1084/jem.20111512. [DOI] [PMC free article] [PubMed] [Google Scholar]
- Huang Z, Traugh JA, Bishop JM. Negative control of the Myc protein by the stress-responsive kinase Pak2. Mol Cell Biol. 2004;24:1582–1594. doi: 10.1128/MCB.24.4.1582-1594.2004. [DOI] [PMC free article] [PubMed] [Google Scholar]
- Inoue S, Hao Z, Elia AJ, Cescon D, Zhou L, Silvester J, Snow B, Harris IS, Sasaki M, Li WY, Itsumi M, Yamamoto K, Ueda T, Dominguez-Brauer C, Gorrini C, Chio II, Haight J, You-Ten A, McCracken S, Wakeham A, et al. Mule/Huwe1/Arf-BP1 suppresses Ras-driven tumorigenesis by preventing c-Myc/Miz1-mediated down-regulation of p21 and p15. Genes Dev. 2013;27:1101–1114. doi: 10.1101/gad.214577.113. [DOI] [PMC free article] [PubMed] [Google Scholar]
- Kauffmann-Zeh A, Rodriguez-Viciana P, Ulrich E, Gilbert C, Coffer P, Downward J, Evan G. Suppression of c-Myc-induced apoptosis by Ras signalling through PI(3)K and PKB. Nature. 1997;385:544–548. doi: 10.1038/385544a0. [DOI] [PubMed] [Google Scholar]
- Khwaja A, Rodriguez-Viciana P, Wennstrom S, Warne PH, Downward J. Matrix adhesion and Ras transformation both activate a phosphoinositide 3-OH kinase and protein kinase B/Akt cellular survival pathway. EMBO J. 1997;16:2783–2793. doi: 10.1093/emboj/16.10.2783. [DOI] [PMC free article] [PubMed] [Google Scholar]
- King WG, Mattaliano MD, Chan TO, Tsichlis PN, Brugge JS. Phosphatidylinositol 3-kinase is required for integrin-stimulated AKT and Raf-1/mitogen-activated protein kinase pathway activation. Mol Cell Biol. 1997;17:4406–4418. doi: 10.1128/mcb.17.8.4406. [DOI] [PMC free article] [PubMed] [Google Scholar]
- Lane MA, Romagnoli L, Cruise B, Cohn GM. Spontaneous conversion to estrogen receptor expression by the human breast epithelial cell line, MCF-10A. Oncol Rep. 1999;6:507–511. doi: 10.3892/or.6.3.507. [DOI] [PubMed] [Google Scholar]
- Lin CY, Loven J, Rahl PB, Paranal RM, Burge CB, Bradner JE, Lee TI, Young RA. Transcriptional Amplification in Tumor Cells with Elevated c-Myc. Cell. 2012;151:56–67. doi: 10.1016/j.cell.2012.08.026. [DOI] [PMC free article] [PubMed] [Google Scholar]
- Littlewood TD, Hancock DC, Danielian PS, Parker MG, Evan GI. A modified oestrogen receptor ligand binding domain as an improved switch for the regulation of heterologous proteins. Nucleic Acid Res. 1995;23:1686–1690. doi: 10.1093/nar/23.10.1686. [DOI] [PMC free article] [PubMed] [Google Scholar]
- Liu M, Casimiro MC, Wang C, Shirley LA, Jiao X, Katiyar S, Ju X, Li Z, Yu Z, Zhou J, Johnson M, Fortina P, Hyslop T, Windle JJ, Pestell RG. p21CIP1 attenuates Ras- and c-Myc-dependent breast tumor epithelial mesenchymal transition and cancer stem cell-like gene expression in vivo. Proc Natl Acad Sci USA. 2009;106:19035–19039. doi: 10.1073/pnas.0910009106. [DOI] [PMC free article] [PubMed] [Google Scholar]
- Liu H, Radisky DC, Yang D, Xu R, Radisky ES, Bissell MJ, Bishop JM. MYC suppresses cancer metastasis by direct transcriptional silencing of alphav and beta3 integrin subunits. Nat Cell Biol. 2012;14:567–574. doi: 10.1038/ncb2491. [DOI] [PMC free article] [PubMed] [Google Scholar]
- Lowe SW, Cepero E, Evan G. Intrinsic tumour suppression. Nature. 2004;432:307–315. doi: 10.1038/nature03098. [DOI] [PubMed] [Google Scholar]
- Meyer N, Penn LZ. Reflecting on 25 years with MYC. Nat Rev Cancer. 2008;8:976–990. doi: 10.1038/nrc2231. [DOI] [PubMed] [Google Scholar]
- Miller LD, Smeds J, George J, Vega VB, Vergara L, Ploner A, Pawitan Y, Hall P, Klaar S, Liu ET, Bergh J. An expression signature for p53 status in human breast cancer predicts mutation status, transcriptional effects, and patient survival. Proc Natl Acad Sci USA. 2005;102:13550–13555. doi: 10.1073/pnas.0506230102. [DOI] [PMC free article] [PubMed] [Google Scholar]
- Miralles F, Posern G, Zaromytidou AI, Treisman R. Actin dynamics control SRF activity by regulation of its coactivator MAL. Cell. 2003;113:329–342. doi: 10.1016/s0092-8674(03)00278-2. [DOI] [PubMed] [Google Scholar]
- Mizuno H, Spike BT, Wahl GM, Levine AJ. Inactivation of p53 in breast cancers correlates with stem cell transcriptional signatures. Proc Natl Acad Sci USA. 2010;107:22745–22750. doi: 10.1073/pnas.1017001108. [DOI] [PMC free article] [PubMed] [Google Scholar]
- Murphy DJ, Junttila MR, Pouyet L, Karnezis A, Shchors K, Bui DA, Brown-Swigart L, Johnson L, Evan GI. Distinct thresholds govern Myc's biological output in vivo. Cancer Cell. 2008;14:447–457. doi: 10.1016/j.ccr.2008.10.018. [DOI] [PMC free article] [PubMed] [Google Scholar]
- Muthalagu N, Junttila MR, Wiese KE, Wolf E, Morton J, Bauer B, Evan GI, Eilers M, Murphy DJ. BIM is the primary mediator of MYC-induced apoptosis in multiple solid tissues. Cell Rep. 2014;8:1347–1353. doi: 10.1016/j.celrep.2014.07.057. [DOI] [PMC free article] [PubMed] [Google Scholar]
- Nie Z, Hu G, Wei G, Cui K, Yamane A, Resch W, Wang R, Green DR, Tessarollo L, Casellas R, Zhao K, Levens D. c-Myc Is a Universal Amplifier of Expressed Genes in Lymphocytes and Embryonic Stem Cells. Cell. 2012;151:68–79. doi: 10.1016/j.cell.2012.08.033. [DOI] [PMC free article] [PubMed] [Google Scholar]
- Nieminen AI, Partanen JI, Hau A, Klefstrom J. c-Myc primed mitochondria determine cellular sensitivity to TRAIL-induced apoptosis. EMBO J. 2007;26:1055–1067. doi: 10.1038/sj.emboj.7601551. [DOI] [PMC free article] [PubMed] [Google Scholar]
- Nieminen AI, Eskelinen VM, Haikala HM, Tervonen TA, Yan Y, Partanen JI, Klefstrom J. Myc-induced AMPK-phospho p53 pathway activates Bak to sensitize mitochondrial apoptosis. Proc Natl Acad Sci USA. 2013;110:E1839–E1848. doi: 10.1073/pnas.1208530110. [DOI] [PMC free article] [PubMed] [Google Scholar]
- Nilsson JA, Cleveland JL. Myc pathways provoking cell suicide and cancer. Oncogene. 2003;22:9007–9021. doi: 10.1038/sj.onc.1207261. [DOI] [PubMed] [Google Scholar]
- Partanen JI, Nieminen AI, Makela TP, Klefstrom J. Suppression of oncogenic properties of c-Myc by LKB1-controlled epithelial organization. Proc Natl Acad Sci USA. 2007;104:14694–14699. doi: 10.1073/pnas.0704677104. [DOI] [PMC free article] [PubMed] [Google Scholar]
- Patel JH, McMahon SB. Targeting of Miz-1 Is Essential for Myc-mediated Apoptosis. J Biol Chem. 2006;281:3283–3289. doi: 10.1074/jbc.M513038200. [DOI] [PubMed] [Google Scholar]
- Patel JH, McMahon SB. BCL2 is a downstream effector of MIZ-1 essential for blocking c-MYC-induced apoptosis. J Biol Chem. 2007;282:5–13. doi: 10.1074/jbc.M609138200. [DOI] [PubMed] [Google Scholar]
- Pelengaris S, Khan M, Evan GI. Suppression of myc-induced apoptosis in Beta cells exposes multiple oncogenic properties of myc and triggers carcinogenic progression. Cell. 2002;109:321–334. doi: 10.1016/s0092-8674(02)00738-9. [DOI] [PubMed] [Google Scholar]
- Peter S, Bultinck J, Myant K, Jaenicke LA, Walz S, Muller J, Gmachl M, Treu M, Boehmelt G, Ade CP, Schmitz W, Wiegering A, Otto C, Popov N, Sansom O, Kraut N, Eilers M. Tumor cell-specific inhibition of MYC function using small molecule inhibitors of the HUWE1 ubiquitin ligase. EMBO Mol Med. 2014;6:1525–1541. doi: 10.15252/emmm.201403927. [DOI] [PMC free article] [PubMed] [Google Scholar]
- Posern G, Treisman R. Actin' together: serum response factor, its cofactors and the link to signal transduction. Trends Cell Biol. 2006;16:588–596. doi: 10.1016/j.tcb.2006.09.008. [DOI] [PubMed] [Google Scholar]
- van Riggelen J, Muller J, Otto T, Beuger V, Yetil A, Choi PS, Kosan C, Moroy T, Felsher DW, Eilers M. The interaction between Myc and Miz1 is required to antagonize TGFbeta-dependent autocrine signaling during lymphoma formation and maintenance. Genes Dev. 2010;24:1281–1294. doi: 10.1101/gad.585710. [DOI] [PMC free article] [PubMed] [Google Scholar]
- Rodrik-Outmezguine VS, Chandarlapaty S, Pagano NC, Poulikakos PI, Scaltriti M, Moskatel E, Baselga J, Guichard S, Rosen N. mTOR kinase inhibition causes feedback-dependent biphasic regulation of AKT signaling. Cancer Discov. 2011;1:248–259. doi: 10.1158/2159-8290.CD-11-0085. [DOI] [PMC free article] [PubMed] [Google Scholar]
- Rupnow BA, Alarcon RM, Giaccia AJ, Knox SJ. p53 mediates apoptosis induced by c-Myc activation in hypoxic or gamma irradiated fibroblasts. Cell Death Differ. 1998;5:141–147. doi: 10.1038/sj.cdd.4400328. [DOI] [PubMed] [Google Scholar]
- Sabo A, Kress TR, Pelizzola M, de Pretis S, Gorski MM, Tesi A, Morelli MJ, Bora P, Doni M, Verrecchia A, Tonelli C, Faga G, Bianchi V, Ronchi A, Low D, Muller H, Guccione E, Campaner S, Amati B. Selective transcriptional regulation by Myc in cellular growth control and lymphomagenesis. Nature. 2014;511:488–492. doi: 10.1038/nature13537. [DOI] [PMC free article] [PubMed] [Google Scholar]
- Sauve S, Naud JF, Lavigne P. The mechanism of discrimination between cognate and non-specific DNA by dimeric b/HLH/LZ transcription factors. J Mol Biol. 2007;365:1163–1175. doi: 10.1016/j.jmb.2006.10.044. [DOI] [PubMed] [Google Scholar]
- Schuhmacher M, Kohlhuber F, Holzel M, Kaiser C, Burtscher H, Jarsch M, Bornkamm GW, Laux G, Polack A, Weidle UH, Eick D. The transcriptional program of a human B cell line in response to Myc. Nucleic Acids Res. 2001;29:397–406. doi: 10.1093/nar/29.2.397. [DOI] [PMC free article] [PubMed] [Google Scholar]
- Troussard AA, Mawji NM, Ong C, Mui A, St-Arnaud R, Dedhar S. Conditional knock-out of integrin-linked kinase demonstrates an essential role in protein kinase B/Akt activation. J Biol Chem. 2003;278:22374–22378. doi: 10.1074/jbc.M303083200. [DOI] [PubMed] [Google Scholar]
- Vartiainen MK, Guettler S, Larijani B, Treisman R. Nuclear actin regulates dynamic subcellular localization and activity of the SRF cofactor MAL. Science. 2007;316:1749–1752. doi: 10.1126/science.1141084. [DOI] [PubMed] [Google Scholar]
- Velling T, Nilsson S, Stefansson A, Johansson S. beta1-Integrins induce phosphorylation of Akt on serine 473 independently of focal adhesion kinase and Src family kinases. EMBO Rep. 2004;5:901–905. doi: 10.1038/sj.embor.7400234. [DOI] [PMC free article] [PubMed] [Google Scholar]
- Walz S, Lorenzin F, Morton J, Wiese KE, von Eyss B, Herold S, Rycak L, Dumay-Odelot H, Karim S, Bartkuhn M, Roels F, Wustefeld T, Fischer M, Teichmann M, Zender L, Wei CL, Sansom O, Wolf E, Eilers M. Activation and repression by oncogenic MYC shape tumour-specific gene expression profiles. Nature. 2014;511:483–487. doi: 10.1038/nature13473. [DOI] [PMC free article] [PubMed] [Google Scholar]
- Wang Y, Engels IH, Knee DA, Nasoff M, Deveraux QL, Quon KC. Synthetic lethal targeting of MYC by activation of the DR5 death receptor pathway. Cancer Cell. 2004;5:501–512. doi: 10.1016/s1535-6108(04)00113-8. [DOI] [PubMed] [Google Scholar]
- Wang X, Cunningham M, Zhang X, Tokarz S, Laraway B, Troxell M, Sears RC. Phosphorylation regulates c-Myc's oncogenic activity in the mammary gland. Cancer Res. 2011;71:925–936. doi: 10.1158/0008-5472.CAN-10-1032. [DOI] [PMC free article] [PubMed] [Google Scholar]
- Welcker M, Orian A, Jin J, Grim JA, Harper JW, Eisenman RN, Clurman BE. The Fbw7 tumor suppressor regulates glycogen synthase kinase 3 phosphorylation-dependent c-Myc protein degradation. Proc Natl Acad Sci USA. 2004;101:9085–9090. doi: 10.1073/pnas.0402770101. [DOI] [PMC free article] [PubMed] [Google Scholar]
- Wiese KE, Walz S, von EB, Wolf E, Athineos D, Sansom O, Eilers M. The Role of MIZ-1 in MYC-Dependent Tumorigenesis. Cold Spring Harb Perspect Med. 2013;3:91–100. doi: 10.1101/cshperspect.a014290. [DOI] [PMC free article] [PubMed] [Google Scholar]
- Wilson A, Murphy MJ, Oskarsson T, Kaloulis K, Bettess MD, Oser GM, Pasche AC, Knabenhans C, Macdonald HR, Trumpp A. c-Myc controls the balance between hematopoietic stem cell self-renewal and differentiation. Genes Dev. 2004;18:2747–2763. doi: 10.1101/gad.313104. [DOI] [PMC free article] [PubMed] [Google Scholar]
- Wolf E, Gebhardt A, Kawauchi D, Walz S, von Eyss B, Wagner N, Renninger C, Krohne G, Asan E, Roussel MF, Eilers M. Miz1 is required to maintain autophagic flux. Nat Commun. 2013;4:2535. doi: 10.1038/ncomms3535. [DOI] [PMC free article] [PubMed] [Google Scholar]
- Worsham MJ, Pals G, Schouten JP, Miller F, Tiwari N, van Spaendonk R, Wolman SR. High-resolution mapping of molecular events associated with immortalization, transformation, and progression to breast cancer in the MCF10 model. Breast Cancer Res Treat. 2006;96:177–186. doi: 10.1007/s10549-005-9077-8. [DOI] [PubMed] [Google Scholar]
- Yeh E, Cunningham M, Arnold H, Chasse D, Monteith T, Ivaldi G, Hahn WC, Stukenberg PT, Shenolikar S, Uchida T, Counter CM, Nevins JR, Means AR, Sears R. A signalling pathway controlling c-Myc degradation that impacts oncogenic transformation of human cells. Nat Cell Biol. 2004;6:308–318. doi: 10.1038/ncb1110. [DOI] [PubMed] [Google Scholar]
- Yuneva M, Zamboni N, Oefner P, Sachidanandam R, Lazebnik Y. Deficiency in glutamine but not glucose induces MYC-dependent apoptosis in human cells. J Cell Biol. 2007;178:93–105. doi: 10.1083/jcb.200703099. [DOI] [PMC free article] [PubMed] [Google Scholar]
- Yustein JT, Liu YC, Gao P, Jie C, Le A, Vuica-Ross M, Chng WJ, Eberhart CG, Bergsagel PL, Dang CV. Induction of ectopic Myc target gene JAG2 augments hypoxic growth and tumorigenesis in a human B-cell model. Proc Natl Acad Sci USA. 2010;107:3534–3539. doi: 10.1073/pnas.0901230107. [DOI] [PMC free article] [PubMed] [Google Scholar]
- Zeller KI, Zhao X, Lee CW, Chiu KP, Yao F, Yustein JT, Ooi HS, Orlov YL, Shahab A, Yong HC, Fu Y, Weng Z, Kuznetsov VA, Sung WK, Ruan Y, Dang CV, Wei CL. Global mapping of c-Myc binding sites and target gene networks in human B cells. Proc Natl Acad Sci USA. 2006;103:17834–17839. doi: 10.1073/pnas.0604129103. [DOI] [PMC free article] [PubMed] [Google Scholar]
- Zhan L, Rosenberg A, Bergami KC, Yu M, Xuan Z, Jaffe AB, Allred C, Muthuswamy SK. Deregulation of scribble promotes mammary tumorigenesis and reveals a role for cell polarity in carcinoma. Cell. 2008;135:865–878. doi: 10.1016/j.cell.2008.09.045. [DOI] [PMC free article] [PubMed] [Google Scholar]
- Zindy F, Eischen CM, Randle DH, Kamijo T, Cleveland JL, Sherr CJ, Roussel MF. Myc signaling via the ARF tumor suppressor regulates p53-dependent apoptosis and immortalization. Genes Dev. 1998;12:2424–2433. doi: 10.1101/gad.12.15.2424. [DOI] [PMC free article] [PubMed] [Google Scholar]
Associated Data
This section collects any data citations, data availability statements, or supplementary materials included in this article.
Supplementary Materials
Supplementary Figure S1
Supplementary Figure S2
Supplementary Figure S3
Supplementary Figure S4
Supplementary Figure S5
Supplementary Figure S6
Supplementary Figure S7
Supplementary Figure S8
Supplementary Table S1
Supplementary Table S2
Supplementary Table S3
Supplementary Figure and Table Legends
Review Process File