Abstract
Imaging and tracking of nano- and micron-sized organelles in cells with nanometer precision is crucial for understanding cellular behaviors at the molecular scale. Because of the fast intracellular dynamic processes, the imaging and tracking method must also be fast. In addition, to ensure that the observed dynamics is relevant to the native functions, it is critical to keep the cells under their native states. Here, we demonstrate a plasmonics-based imaging technique for studying the dynamics of organelles in three dimensions (3D) with high localization precision (5 nm) and temporal (10 ms) resolution. The technique is label-free and can track subcellular structures in the native state of the cells. Using the technique, we have successfully observed nanometer steps of organelle (e.g., mitochondria) transportation along neurite microtubules in primary neurons, and reconstructed the 3D structure of neurite microtubule bundles at the nanometer scale from the tracks of the moving organelles.
Keywords: Plasmonic imaging, intracellular organelle detection, 3D tracking, microtubule structure mapping, surface plasmon resonance
Table of Contents
Plasmonic imaging and tracking provides a fast label-free method for studying intracellular dynamics. Nanometer tracking accuracy and millisecond temporal resolution were achieved. Three-dimensional tracking of moving organelle allowed a structural mapping of microtubule with high precision.
1. Introduction
Imaging and tracking fast intracellular dynamic processes with nanometer precision is critical to understand the underlying molecular processes of many biological phenomena, including cell growth, mass transportation, signaling transduction and cell migration[1]. Myriad intracellular events are well orchestrated at the molecular level within the tiny volume of a single cell. Aberrant regulations cause various developmental and neurodegenerative diseases[2]. Despite the great need, tracking the intracellular dynamics remains a difficult challenge. A technique for this task requires high spatial localization accuracy and temporal resolution. It should also be non-invasive in order to minimize perturbations to the native dynamic processes under study. To date, the most popular method is fluorescence imaging techniques[3]. Although powerful, fluorescence emission is relatively weak, which requires time to collect sufficient photons, thus limiting the imaging speed. Moreover, labeling of living systems with fluorescent tags may disturb their native cellular processes and affect the original physiological functions.
To overcome these drawbacks, label-free imaging techniques have been employed for imaging and tracking. Previous studies on unstained lipid droplet demonstrated a nonperturbative tracking strategy using coherent anti-Stokes Raman scattering (CARS) microscopy and stimulated Raman scattering (SRS) microscopy[4]. Other nonlinear optical techniques, such as second harmonic generation (SHG) microscopy and third harmonic generation (THG) microscopy, have also been applied for studying dynamic trafficking of lipid bodies[5]. By combining with multi-photon excited native fluorescence, these multimodal methods showed a powerful imaging capability of studying intrinsic metabolic signals in tissue[6]. However, the imaging rates of these techniques are limited for studying fast dynamic processes.[7]
Surface plasmon resonance (SPR) is a surface sensing technique widely used in life sciences and pharmaceutical discovery. The extremely high sensitivity to mass density changes on the surface makes SPR an indispensable technique in assessing protein-protein interaction and studying binding kinetics. Recently, SPR microscopy has been demonstrated in the total internal reflection (TIR) configuration[8]. This plasmonics-based microscopy technique provides superior spatial resolution, allowing for studying protein binding kinetics[9]. However, tracking of subcellular organelles with high spatial and temporal resolution has not been shown previously.
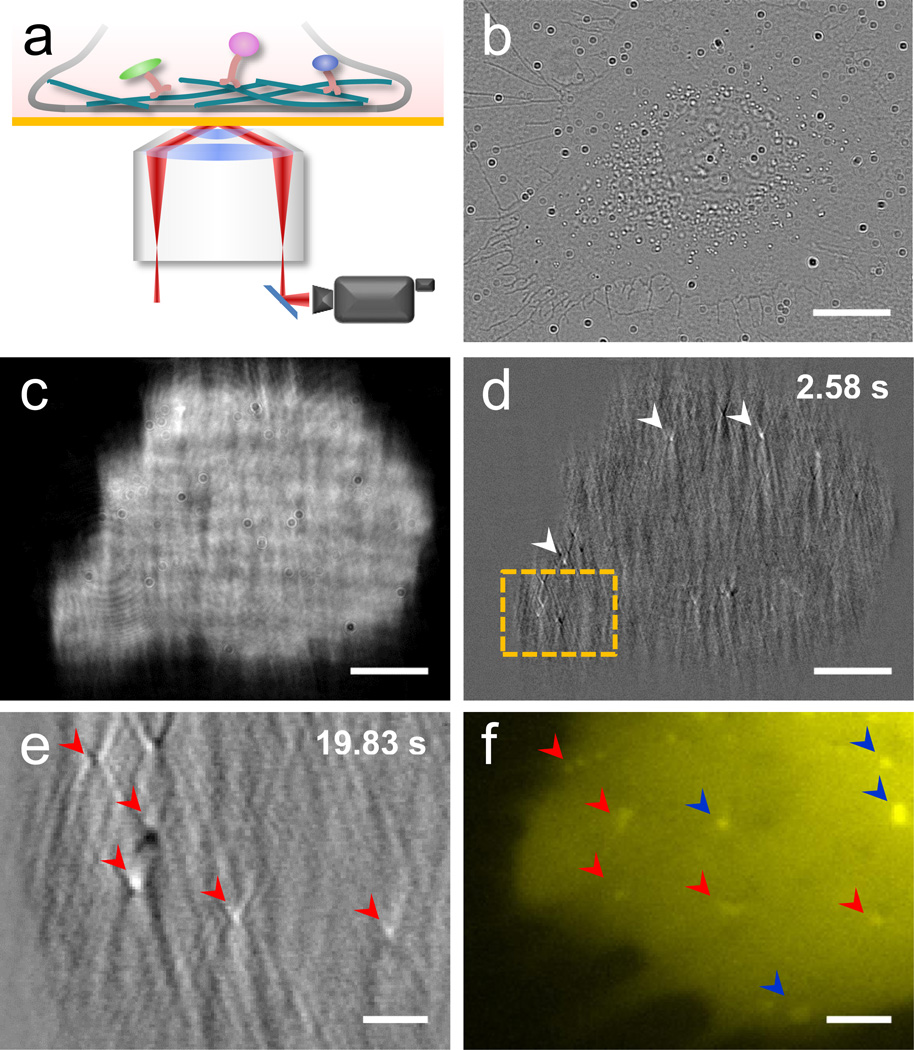
Here, we demonstrate tracking of single organelle dynamics in cells with this plasmonics-based imaging technique[8–10]. The technique excites surface plasmonic waves on a gold surface with light, and the presence of an organelle on or near the surface scatters the plasmonic waves (Figure 1a), leading to a high contrast image of the organelle without labels. By analyzing the high contrast plasmonic images over time, we have tracked intracellular dynamics in three dimensions with nanometer localization precision and millisecond temporal resolution, and observed stepwise movement of the organelles (mitochondria) that are originated from the motor proteins.
Figure 1. Plasmonic imaging of intracellular organelle dynamics in live cell.
(a) Schematic diagram of plasmonic imaging setup for imaging intracellular processes. (b, c) Transmitted (b) and plasmonic (c) images of single SH-EP1 cell. (d) A representative image of intracellular organelles after subtracting the first frame, where the white arrows indicate the intracellular organelles. (e, f) Zoom-in images of another plasmonic image after subtracting the first frame (e) and epi-fluorescence (f) labeled with MitoTracker® in region marked by orange boxes in (d). Red arrows indicate common features of plasmonic images and fluorescence. Blue arrows indicate fluorescence-only features. Note the blurry of the fluorescence image of (f) is affected by the gold film. Scale bar: (b–d) 25 µm; (e, f) 5 µm.
2. Results and Discussion
Figures 1b and c show a bright field and corresponding plasmonic images of a live cell. Compared to the traditional bright field image (b), the plasmonic image (c) shows a much higher image contrast. This high contrast imaging capability allows for tracking of individual organelles inside a cell (Supporting Information Figure S1). In order to focus on the dynamics of the organelles, we subtract the first frame from the subsequent frames. The time-differential images reveal only moving organelles, and thus suppressing non-moving objects in the cell (Supporting Information Video S1). Figure 1d is such a differential image, which shows several bright spots as marked by white arrows. Zooming-in of a lower left region of the image reveals more clearly the bright spots, each with a “V” shape tail along the propagation direction of the surface plasmonic wave (Figure 1e and Supporting Information Video S2). The tail is due to the scattering of the surface plasmonic wave by the organelles, which also shows up in the plasmonic images of nanoparticles as we reported previously[10b].
To identify the organelles, we stained the cell with a fluorescent dye, MitoTracker®, which targets at mitochondria. Figure 1f is a fluorescent image of the same region as the time-differential plasmonic image shown in Figure 1e (Supporting Information Video S3). The organelles revealed in the plasmonic image match well with those in the fluorescent image (Supporting Information Figure S2), which indicates that the features tracked by the plasmonic imaging technique are mitochondria. However, some mitochondria in the fluorescent image do not show up in the plasmonic image, which is probably due to that they are located outside of the evanescent field associated with the plasmonic waves. In addition to dot-like mitochondria, we also observed elongated ones. Figure S3 in the Supporting Information shows two mitochondria sliding on the same track, each has a length of ~1.5 µm (Supporting Information Video S4). Since mitochondria are the largest and most abundant organelles in cell, we expected most of the features revealed in plasmonic image are from mitochondria.
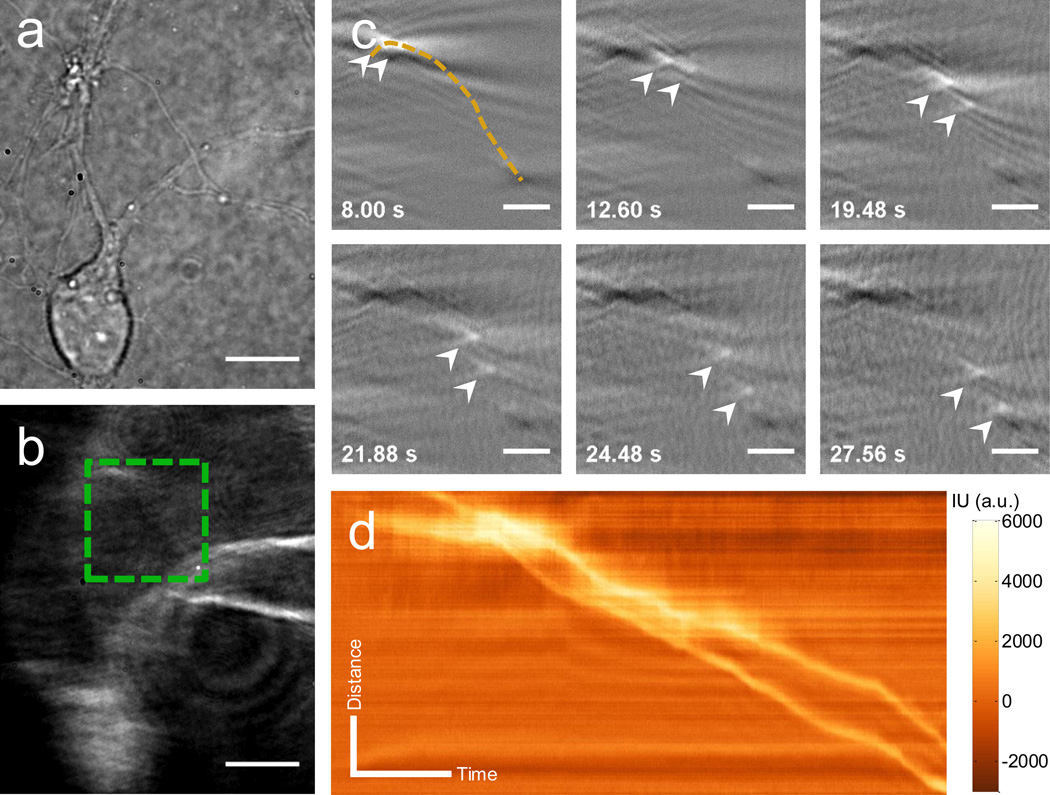
Mitochondria are essential organelles responsible for energy production and many other cellular processes, including cell apoptosis and aging[11]. Their trafficking and distribution are critical for local energy supply in distal structures, such as axons and dendrites in neurons. Various neurodegenerative diseases are related to inappropriate mitochondrial trafficking[2a, 12]. Plasmonic imaging provides a label-free approach to study mitochondria in native state, eliminating complications with dye-labeling process, which could hinder the respiratory function of mitochondria. To explore the long-range axonal transport, we studied the organelle dynamics in primary neurons. The plasmonic imaging of the neurons has superior image contrast, compared to the traditional bright field optical images, allowing us to resolve clearly minor structures, such as axons and dendrites (Figures 2a and 2b). It also allows us to observe confined organelle transportation in the neurite structure. Figure 2c shows several snapshots of the time-differential plasmonic images of two organelles marked with arrows moving from upper left towards the lower right of the frame. A movie of the organelle transportation is provided in the supplementary material to show more details of the dynamic process (Supporting Information Video S5). The moving tracks of the two organelles (the yellow dashed line in Figure 2c) follow well the neurite structure as shown in the plasmonic image marked by a dashed square box in Figure 2b. The dynamics of the two organelles moving along the neurite structure is described by plotting the distance vs. time, or known as kymographs in Figure 2d. The kymographs provide detailed information about the motion of the organelles. For example, the local slope is the velocity of the moving organelle. These examples demonstrate a label-free imaging of single organelle dynamics in cells.
Figure 2. Plasmonic tracking of intracellular organelle dynamics in live cell.
Transmitted (a) and plasmonic (b) images of primary hippocampus neuron obtained by the plasmonic imaging system. (c) Snapshots of plasmonic images of the movement of two intracellular organelles along the neurite structure (marked as dashed line) in region marked by a dashed box in (b). (d) Kymograph of two organelles in (c). Scale bar: (a), (b), 10 µm; (c) 3 µm; (d) Distance: 3 µm; Time: 5 s.
We show below that it is also possible to accurately track the movement of the organelles with the plasmonic imaging capability. As shown in Figure 1e, the plasmonic image of an organelle displays a V-shape diffraction pattern with a bright spot at the apex of the “V” (Supporting Information Figures S4a and S4b). The bright spot reflects the center of mass of the organelle. By fitting the bright spot with a 2D Gaussian distribution function, we located the position of the organelle, and tracked its transportation by following the position over time (Supporting Information Figures S4c and S4d).
Recent studies have revealed that motor proteins move along their tracks in a stepwise manner by alternating their track-binding motor domain[3c, 4a, 13]. This microtubule-depended motion is a universal model for organelle transporting, including mitochondria, lipid droplets, endosomes, and lysosomes. Most of these previous works are based on labeling the motor proteins or organelles with fluorescent tags, which may disturb the native behavior of the motor proteins. In fact, evidence has shown that changing in the load of the motor proteins may alter the stepping sizes[14], which underscores the importance of non-invasive and label-free plasmonic imaging and tracking of organelle transportation. Additionally, plasmonic imaging intensity is rather bright, compared to fluorescent imaging, making it possible to track fast movement of organelles.
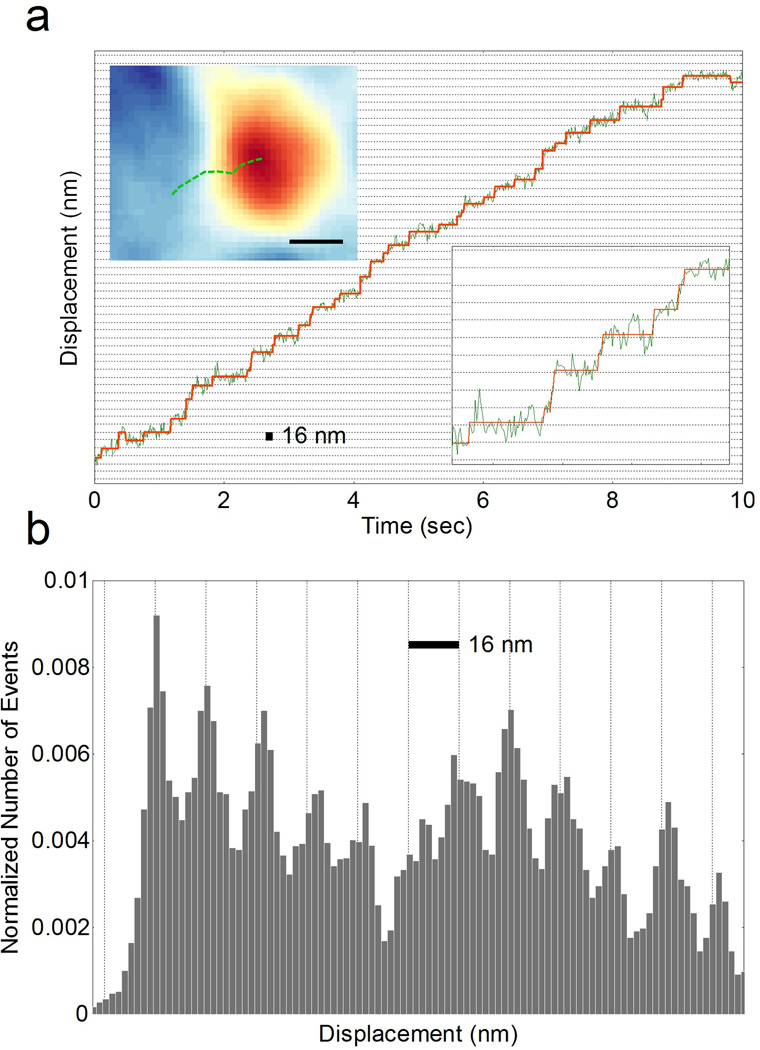
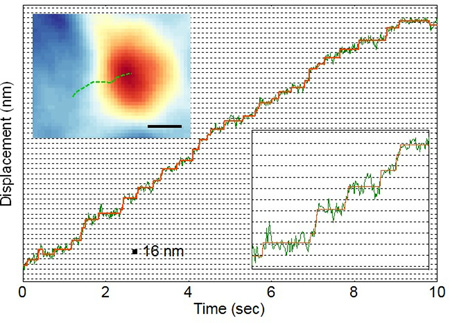
To track the fast organelle transportation dynamics, we recorded moving organelles in neurites using a frame rate up to 100 frames per second. Faster frame rates are also possible because the plasmonic imaging measures the scattering of the plasmonic waves by the organelles, which is sufficiently strong and can be detected with a fast camera. Figure 3a shows the displacement of an organelle determined with the plasmonic tracking method over time. Stepwise changes in the displacement with a step size of ~16 nm can be identified (inset of lower right of Figure 3a). This step size is consistent with previous reports for microtubule-based movement of dynein[13d, 14–15]. Pair-wise statistical analysis of the displacement reveal pronounced peaks separated with 16 nm intervals, which further confirms the stepwise transportation of the organelles observed here (Figure 3b). Note that both 8 nm and 16 nm step sizes have been reported in kinesin and dynein driven motion[13a, 16]. The absence of the 8 nm-steps in the present work might be due to the complexity of organelle behavior in native environment.
Figure 3. Stepping observation of single organelle.
(a) Green line: the trajectory of an organelle moving in cell over time. Red line: fitting of the trajectory with a stepwise function. Upper left inset: Trajectory of a moving organelle in x-y plane. Bottom right: zoom in of the trajectory between time 1.7 s and 3 s. (b) Pair-wised histogram of organelle displacement, showing discrete peaks with a separation of 16 nm. Scale bar: (a) Space between two horizontal grid line: 16 nm. Top inset: 400 nm (b) space between two vertical line: 16 nm.
In addition to accurate tracking of the organelle displacement laterally (x-y or the image plane), the plasmonic imaging technique can track the organelle displacement vertically (z-direction). This is because the evanescent field associated with the surface plasmonic waves decays exponentially from the surface into the solution phase, and consequently, the plasmonic imaging intensity is also an exponential function of the vertical position (z displacement) of the organelle. We experimentally verified the z-axis decay constant by measuring the imaging intensity of small particles placed at various distances from the gold surface (Supporting Information Figure S5). The measured decay constant (95.8 nm) is consistent with simulation result using multiple layer model.[17] From the measured plasmonic imaging intensity change, and the decay constant, we were able to determine the z component of the displacement with high accuracy. The capability of accurate tracking in z direction is not available for the conventional fluorescence-based imaging method, which makes the present plasmonic tracking method unique for studying the dynamics of subcellular organelles in 3D.
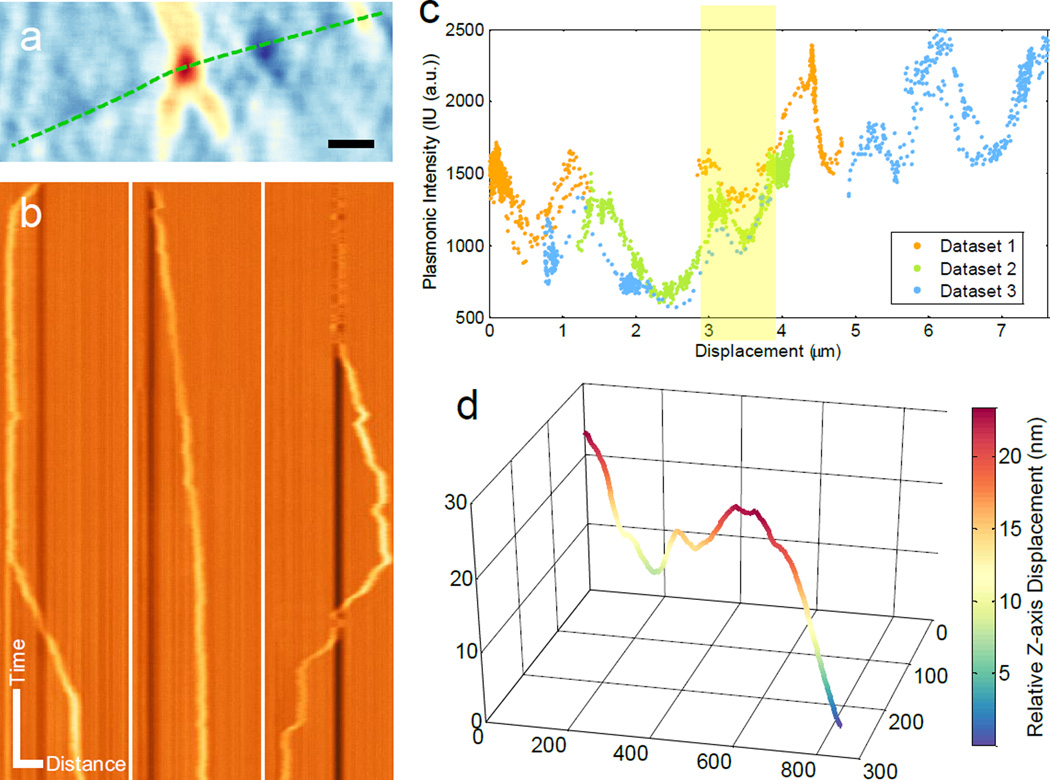
To obtain structural information of microtubules, we monitored the movement of single organelles back and forth along a section of a neurite fiber (Figure 4a). Kymographs of three different recordings are plotted in Figure 4b, which show different movements of the organelle along the same microtubule. The plasmonic imaging intensity of the organelle is plotted against the net displacement along the neurite fiber in Figure 4c, which reveals a large variation of the intensity along the fiber. The patterns of the intensity variation for repeated recordings of the organelle moving back and forth along the fiber are similar, which indicates that the plasmonic intensity depends mainly on the location along the fiber. We thus believe that the observed variation in the plasmonic imaging intensity of the organelle was due to the local variation in the distance between the microtubule and the surface. This z-position information, along with the x and y positions, allowed us to extract the 3D structure of the microtubule from the plasmonic images. Figure 4d shows the extracted 3D structure of a section of microtubule bundle (Supporting Information Note S1).
Figure 4. 3D mapping of microtubule structure by single organelle tracking.
(a) Trajectory of moving organelle in x-y plane. (b) Kymograph of three different runs of the same organelle. Vertical direction: time. Horizontal direction: distance. (c) Plasmonic image intensity variation of an organelle along its track. (d) 3D structure of microtubule bundle of the region highlighted with yellow shade in (c). Scale bar: (a) 1 µm (b) Time: 5 s; Distance: 2 µm.
We evaluated the accuracy of displacement tracking in x-y directions by Gaussian fitting of the negative shadow region (Supporting Information Note S2). The standard deviation in x-y direction is about 5 nm (Supporting Information Figure S6), which is sufficient for resolving a 16 nm step of the motor proteins. To further validate the observation of the 16 nm step in the pair-wise histogram analysis and eliminate the possible artificial measurement errors, we performed same analysis procedure to a step-exclusive ramp signal with similar noise. We did not observe obvious steps (Supporting Information Figure S7). The accuracy of displacement tracking z-direction was determined from the plasmonic imaging intensity noise, which corresponds to an accuracy of ~ 5nm (Supporting Information Note S1). Noise from camera and light source limited the tracking accuracy. It can be fundamentally improved by using ultrafast camera with high-power light source and averaging over frames. The temporal resolution of present study is 10 ms, limited by the frame rate of the camera used in the experiment. This temporal resolution compares favorably with the fluorescence-based method, and much faster frame-camera could be used to acquire plasmonic images, which would allow for even faster tracking speed.
3. Conclusion
In conclusion, we have demonstrated a plasmonic imaging technique for tracking single organelle dynamics with nanometer precision. The scattering of the surface plasmonic waves by organelles creates high contrast images of the organelles, allowing for tracking of organelle dynamics with 5-nm accuracy, and ms-time resolution. Compared to fluorescent tracking techniques, the present plasmonic imaging method is label-free, fast, and provides accurate position information in all the three dimensions. Using the plasmonic tracking technique, we have successfully observed stepwise transportation of organelles in cell native state, providing molecular scaled information of the motor proteins behind the organelle transportation. From the tracks of the individual organelles, we have further extracted the 3D structure of microtubule bundles in live cells. We anticipate the plasmonic imaging technique provide a powerful new tool for quantitative analysis of intracellular dynamic in live cells.
4. Experimental Section
Cell culture and fluorescence staining
Primary rat hippocampus neurons (Life Technologies, Carlsbad, CA, USA) were recovered from cryopreservation and seeded on poly-L-lysine (Trevigen, Gaithersburg, MD, USA) coated sensor chip surface at ~105 cells/cm2. After incubation in a humidified atmosphere with 5% CO2 at 37°C for 4~8 days, cells attached to the surface and were ready for experiment. Neurons were cultured in neurobasal medium (Life Technologies, Carlsbad, CA, USA) with B-27® supplement (Life Technologies, Carlsbad, CA, USA) and GlutaMAX™ (Life Technologies, Carlsbad, CA, USA). Mitochondria were stained with MitoTracker® Orange CMTMRos (Life Technologies, Carlsbad, CA, USA) for observations.
Plasmonic imaging
An inverted microscope (X81, Olympus, Shinjuku, Tokyo, Japan) with total internal reflection (TIR) configuration illumination was implemented in the plasmonic imaging system. P-polarized light beam (~5 mW) from a 680 nm fiber-coupled superluminescent diode (SLD) (Qphotonics LLC, Ann Arber, MI, USA) was introduced into the microscope via a TIR fluorescence tube lens (TIRF module, Olympus, Shinjuku, Tokyo, Japan) and a 50/50 beam splitter (Thorlabs, Newton, New Jersey, USA). The reflected light from the gold surface was detected by a CMOS camera (ORCA-Flash 4.0, Hamamatsu Photonics, Hamamatsu, Japan) with 4M pixels and a pixel size of 6.5 µm. A total of 160 × optical zoom was achieved by using a high numeric aperture 100 × objective combined with a 1.6 × magnification changer. Sensor chips were prepared by coating BK-7 glass coverslips with a ~1.5 nm chromium layer and the followed with a ~47 nm gold layer. To remove contaminations, each chip was rinsed with deionized water and ethanol followed by hydrogen-flame annealing. Before cell seeding, gold surface was modified with poly-L-lysine (5 µg/ml) solution for ~1 hour in a Flexi-Perm (Sarstedt, Newton, NC, USA) cell culture chamber attached on chip surface. For intracellular organelle observation, full resolution (2048 × 2048 px) image sequences at a video rate (25 fps) or a fast rate (100 fps) were either recorded in the computer memory and then saved to disk, or directly streamed into a solid-state drive (SSD) array.
Organelle localization and tracking
A custom MATLAB (Natick, MA, USA) program was used to accurately localize the mass centroid of the organelle. 2-D Gaussian function was employed for precise positioning throughout the whole image sequences. Before fitting, images were spatially filtered with 7 × 7 pixel average kernel. Local plasmonic intensity was obtained by calculating the mean value of the center 13 × 17 pixel region.
Organelle step analysis
When a target organelle moved laterally during the recording, a negative intensity region appeared after the first frame was subtracted from the whole image sequences (Supporting Information Figure S5). This region was used as a reference to evaluate the system noise and control the quality of stepping analysis in each case. To analyze the stepwise organelle movements, the signal drift was corrected by low-pass filtering of the recorded images in the reference area. Corrected x-y trajectory was then aligned along the principal axis of motion. On-axis (along the principal axis of motion) and off-axis (perpendicular to the principal axis of motion) components were assigned to the trajectory. The direction of the principal axis was determined by minimizing the off-axis distance variation over the entire trace.
For step detection, a step-finding algorithm developed by Drs. Jacob Kerssemakers and Marileen Dogterom was employed to analyze the on-axis component[18]. This algorithm is accomplished by least-square fitting using a series of amplitude-undetermined steps. High ratio of χ2fit and χ2counter-fit indicated the real steps in the trajectory. To unbiasedly analyze the step size, we applied Chung-Kennedy filtering procedure to single on-axis trajectory[19]. This filter uses forward and backward moving average algorithm to preserve the step feature while removing noise. This algorithm has been widely used to reduce noise for quantitative analysis of biological events[13d, 20]. Pair-wised histogram of filtered trace was further implemented for statistical analysis and step size identification. For every trajectory, a reference region was fitted with 2D Gaussian function, and long-term drift was corrected in order to characterize the positioning inaccuracy due to the system noise over time.
Microtubule 3D structure mapping
Sequential x-y trajectories of organelle were translated into net displacement by pixelated distance calculation according to their common tracks. Intensity and position were determined by Gaussian fitting along the displacement trajectory. Height of the microtubule bundle can be calculated from the plasmonic image intensity (Supporting Information Notes S1).
Data analysis
All data analysis were carried out by using custom-written MATLAB scripts and/or Image J[21]. Multiple Kymograph Image J plugin was used in moving organelle visualization.
Supplementary Material
Acknowledgements
We thank Gordon and Betty Moore Foundation and NIH (R21 DA033839) for financial support.
References
- 1.Hirokawa N, Takemura R. Nat. Rev. Neurosci. 2005;6(3):201–214. doi: 10.1038/nrn1624. [DOI] [PubMed] [Google Scholar]
- 2.a) De Vos KJ, Grierson AJ, Ackerley S, Miller CC. Annu. Rev. Neurosci. 2008;31:151–173. doi: 10.1146/annurev.neuro.31.061307.090711. [DOI] [PubMed] [Google Scholar]; b) Sheng ZH, Cai Q. Nat. Rev. Neurosci. 2012;13(2):77–93. doi: 10.1038/nrn3156. [DOI] [PMC free article] [PubMed] [Google Scholar]
- 3.a) Huang B, Wang W, Bates M, Zhuang X. Science. 2008;319(5864):810–813. doi: 10.1126/science.1153529. [DOI] [PMC free article] [PubMed] [Google Scholar]; b) Huang B, Bates M, Zhuang X. Annu. Rev. Biochem. 2009;78:993–1016. doi: 10.1146/annurev.biochem.77.061906.092014. [DOI] [PMC free article] [PubMed] [Google Scholar]; c) Yildiz A, Forkey JN, McKinney SA, Ha T, Goldman YE, Selvin PR. Science. 2003;300(5628):2061–2065. doi: 10.1126/science.1084398. [DOI] [PubMed] [Google Scholar]; d) Schindler TD, Chen L, Lebel P, Nakamura M, Bryant Z. Nat. Nanotechnol. 2014;9(1):33–38. doi: 10.1038/nnano.2013.229. [DOI] [PMC free article] [PubMed] [Google Scholar]; e) Patterson G, Davidson M, Manley S, Lippincott-Schwartz J. Annu. Rev. Phys. Chem. 2010;61:345–367. doi: 10.1146/annurev.physchem.012809.103444. [DOI] [PMC free article] [PubMed] [Google Scholar]
- 4.a) Nan X, Potma EO, Xie XS. Biophys. J. 2006;91(2):728–735. doi: 10.1529/biophysj.105.074534. [DOI] [PMC free article] [PubMed] [Google Scholar]; b) Dou W, Zhang D, Jung Y, Cheng JX, Umulis DM. Biophys. J. 2012;102(7):1666–1675. doi: 10.1016/j.bpj.2012.01.057. [DOI] [PMC free article] [PubMed] [Google Scholar]
- 5.Debarre D, Supatto W, Pena AM, Fabre A, Tordjmann T, Combettes L, Schanne-Klein MC, Beaurepaire E. Nat. Methods. 2006;3(1):47–53. doi: 10.1038/nmeth813. [DOI] [PubMed] [Google Scholar]
- 6.Zipfel WR, Williams RM, Christie R, Nikitin AY, Hyman BT, Webb WW. Proc. Natl. Acad. Sci. U. S. A. 2003;100(12):7075–7080. doi: 10.1073/pnas.0832308100. [DOI] [PMC free article] [PubMed] [Google Scholar]
- 7.Jungst C, Winterhalder MJ, Zumbusch A. J. Biophotonics. 2011;4(6):435–441. doi: 10.1002/jbio.201000120. [DOI] [PubMed] [Google Scholar]
- 8.Huang B, Yu F, Zare RN. Anal. Chem. 2007;79(7):2979–2983. doi: 10.1021/ac062284x. [DOI] [PubMed] [Google Scholar]
- 9.Wang W, Yang Y, Wang S, Nagaraj VJ, Liu Q, Wu J, Tao N. Nat. Chem. 2012;4(10):846–853. doi: 10.1038/nchem.1434. [DOI] [PMC free article] [PubMed] [Google Scholar]
- 10.a) Wang S, Shan X, Patel U, Huang X, Lu J, Li J, Tao N. Proc. Natl. Acad. Sci. U. S. A. 2010;107(37):16028–16032. doi: 10.1073/pnas.1005264107. [DOI] [PMC free article] [PubMed] [Google Scholar]; b) Shan X, Diez-Perez I, Wang L, Wiktor P, Gu Y, Zhang L, Wang W, Lu J, Wang S, Gong Q, Li J, Tao N. Nat. Nanotechnol. 2012;7(10):668–672. doi: 10.1038/nnano.2012.134. [DOI] [PubMed] [Google Scholar]
- 11.a) Chan DC. Cell. 2006;125(7):1241–1252. doi: 10.1016/j.cell.2006.06.010. [DOI] [PubMed] [Google Scholar]; b) Lin MT, Beal MF. Nature. 2006;443(7113):787–795. doi: 10.1038/nature05292. [DOI] [PubMed] [Google Scholar]
- 12.Chen H, Chan DC. Hum. Mol. Genet. 2009;18(R2):R169–R176. doi: 10.1093/hmg/ddp326. [DOI] [PMC free article] [PubMed] [Google Scholar]
- 13.a) Yildiz A, Tomishige M, Vale RD, Selvin PR. Science. 2004;303(5658):676–678. doi: 10.1126/science.1093753. [DOI] [PubMed] [Google Scholar]; b) Kural C, Kim H, Syed S, Goshima G, Gelfand VI, Selvin PR. Science. 2005;308(5727):1469–1472. doi: 10.1126/science.1108408. [DOI] [PubMed] [Google Scholar]; c) Cui B, Wu C, Chen L, Ramirez A, Bearer EL, Li WP, Mobley WC, Chu S. Proc. Natl. Acad. Sci. U. S. A. 2007;104(34):13666–13671. doi: 10.1073/pnas.0706192104. [DOI] [PMC free article] [PubMed] [Google Scholar]; d) Nan X, Sims PA, Chen P, Xie XS. J. Phys. Chem. B. 2005;109(51):24220–24224. doi: 10.1021/jp056360w. [DOI] [PubMed] [Google Scholar]; e) DeWitt MA, Chang AY, Combs PA, Yildiz A. Science. 2012;335(6065):221–225. doi: 10.1126/science.1215804. [DOI] [PMC free article] [PubMed] [Google Scholar]; f) Gu Y, Sun W, Wang G, Jeftinija K, Jeftinija S, Fang N. Nat. Commun. 2012;3:1030. doi: 10.1038/ncomms2037. [DOI] [PubMed] [Google Scholar]; g) Vale RD. Cell. 2003;112(4):467–480. doi: 10.1016/s0092-8674(03)00111-9. [DOI] [PubMed] [Google Scholar]; h) Nan X, Sims PA, Xie XS. Chemphyschem. 2008;9(5):707–712. doi: 10.1002/cphc.200700839. [DOI] [PubMed] [Google Scholar]; i) Sims PA, Xie XS. Chemphyschem. 2009;10(9–10):1511–1516. doi: 10.1002/cphc.200900113. [DOI] [PMC free article] [PubMed] [Google Scholar]
- 14.Mallik R, Carter BC, Lex SA, King SJ, Gross SP. Nature. 2004;427(6975):649–652. doi: 10.1038/nature02293. [DOI] [PubMed] [Google Scholar]
- 15.Rai AK, Rai A, Ramaiya AJ, Jha R, Mallik R. Cell. 2013;152(1–2):172–182. doi: 10.1016/j.cell.2012.11.044. [DOI] [PubMed] [Google Scholar]
- 16.Reck-Peterson SL, Yildiz A, Carter AP, Gennerich A, Zhang N, Vale RD. Cell. 2006;126(2):335–348. doi: 10.1016/j.cell.2006.05.046. [DOI] [PMC free article] [PubMed] [Google Scholar]
- 17.a) Shan X, Huang X, Foley KJ, Zhang P, Chen K, Wang S, Tao N. Anal. Chem. 2009;82(1):234–240. doi: 10.1021/ac901816z. [DOI] [PubMed] [Google Scholar]; b) Shan X, Wang S, Tao N. Appl. Phys. Lett. 2010;97(22) doi: 10.1063/1.3519364. - [DOI] [PMC free article] [PubMed] [Google Scholar]; c) Shan X, Fang Y, Wang S, Guan Y, Chen H-Y, Tao N. Nano Lett. 2014;14(7):4151–4157. doi: 10.1021/nl501805e. [DOI] [PubMed] [Google Scholar]
- 18.Kerssemakers JW, Munteanu EL, Laan L, Noetzel TL, Janson ME, Dogterom M. Nature. 2006;442(7103):709–712. doi: 10.1038/nature04928. [DOI] [PubMed] [Google Scholar]
- 19.Chung SH, Kennedy RA. J. Neurosci. Methods. 1991;40(1):71–86. doi: 10.1016/0165-0270(91)90118-j. [DOI] [PubMed] [Google Scholar]
- 20.Qiu W, Derr ND, Goodman BS, Villa E, Wu D, Shih W, Reck-Peterson SL. Nat. Struct. Mol. Biol. 2012;19(2):193–200. doi: 10.1038/nsmb.2205. [DOI] [PMC free article] [PubMed] [Google Scholar]
- 21.Schneider CA, Rasband WS, Eliceiri KW. Nat. Methods. 2012;9(7):671–675. doi: 10.1038/nmeth.2089. [DOI] [PMC free article] [PubMed] [Google Scholar]
Associated Data
This section collects any data citations, data availability statements, or supplementary materials included in this article.


