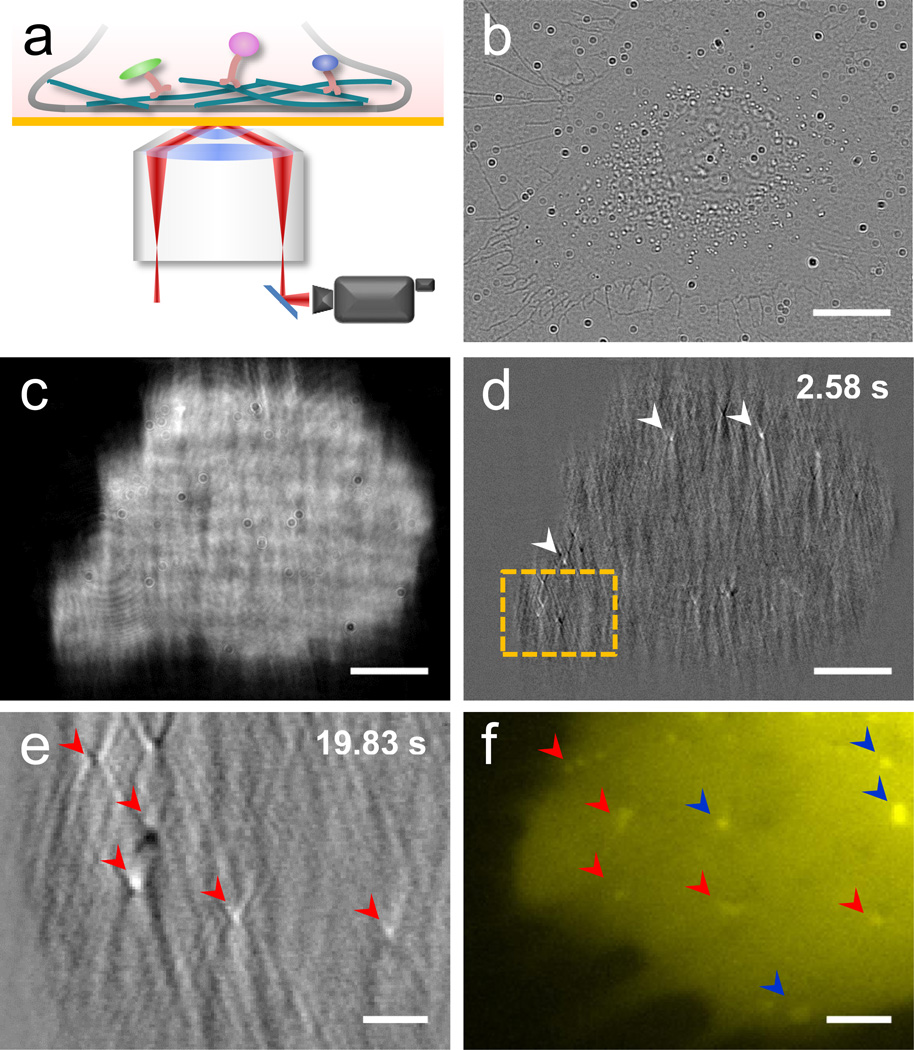
Figure 1. Plasmonic imaging of intracellular organelle dynamics in live cell.
(a) Schematic diagram of plasmonic imaging setup for imaging intracellular processes. (b, c) Transmitted (b) and plasmonic (c) images of single SH-EP1 cell. (d) A representative image of intracellular organelles after subtracting the first frame, where the white arrows indicate the intracellular organelles. (e, f) Zoom-in images of another plasmonic image after subtracting the first frame (e) and epi-fluorescence (f) labeled with MitoTracker® in region marked by orange boxes in (d). Red arrows indicate common features of plasmonic images and fluorescence. Blue arrows indicate fluorescence-only features. Note the blurry of the fluorescence image of (f) is affected by the gold film. Scale bar: (b–d) 25 µm; (e, f) 5 µm.

