Abstract
Purpose:
To test the use of a three-dimensional (3D) optical cone beam computed tomography reconstruction algorithm, for estimation of the imparted 3D dose distribution from megavoltage photon beams in a water tank for quality assurance, by imaging the induced Cherenkov-excited fluorescence (CEF).
Methods:
An intensified charge-coupled device coupled to a standard nontelecentric camera lens was used to tomographically acquire two-dimensional (2D) projection images of CEF from a complex multileaf collimator (MLC) shaped 6 MV linear accelerator x-ray photon beam operating at a dose rate of 600 MU/min. The resulting projections were used to reconstruct the 3D CEF light distribution, a potential surrogate of imparted dose, using a Feldkamp–Davis–Kress cone beam back reconstruction algorithm. Finally, the reconstructed light distributions were compared to the expected dose values from one-dimensional diode scans, 2D film measurements, and the 3D distribution generated from the clinical Varian ECLIPSE treatment planning system using a gamma index analysis. A Monte Carlo derived correction was applied to the Cherenkov reconstructions to account for beam hardening artifacts.
Results:
3D light volumes were successfully reconstructed over a 400 × 400 × 350 mm3 volume at a resolution of 1 mm. The Cherenkov reconstructions showed agreement with all comparative methods and were also able to recover both inter- and intra-MLC leaf leakage. Based upon a 3%/3 mm criterion, the experimental Cherenkov light measurements showed an 83%–99% pass fraction depending on the chosen threshold dose.
Conclusions:
The results from this study demonstrate the use of optical cone beam computed tomography using CEF for the profiling of the imparted dose distribution from large area megavoltage photon beams in water.
Keywords: Cherenkov, Cerenkov, dosimetry, 3D, three-dimensional
1. INTRODUCTION
Due to the increasing complexity of modern radiotherapy treatment plans and time-intensitive nature of current gold standard point scanning dosimetry methods, more robust three-dimensional (3D) techniques have been investigated by using gel and scintillation dosimeters and a variety of reconstruction techniques.1–11 Recently, several studies proposed that the inherent optical photons generated in pure water by radiotherapy photon beams via the Cherenkov effect may be imaged and used as a potential surrogate for the relative dose distribution.12,13 The technique was extended to optical tomography by utilizing a telecentric lens to provide orthographic projections suitable for reconstruction using a simple parallel beam back projection algorithm, similar to telecentric illumination used in previously reported gel dosimetry systems.6,14 However, the limited field of view provided by telecentric lenses precludes profiling of larger beams [i.e., up to 40 × 40 cm2 for routine linear accelerator (Linac) quality assurance (QA) during installation]. Furthermore, such lenses are expensive and provide telecentricity at the cost of aperture (i.e., light collection). Therefore, an approach which utilizes a more cost-effective nontelecentric lens for full field volumetric optical estimation of dose distributions would be advantageous and serves as the incremental advancement studied herein.
The range of commercial optical technologies to image emission from water tanks in a conventional macroview mode is extremely large and quite inexpensive. A key part of exploiting these low-cost and high-quality imaging systems is the ability to accurately backproject the data to allow visualization of the emission profile. In the present study, we explore such a method by using optical cone beam computed tomography of Cherenkov-excited fluorescence (CEF) for 3D dosimetry of megavoltage photon beams in water, a reconstruction technique studied previously in gel and radiochromic plastic dosimetry applications.15–19 Herein, we explore the application of this device for commissioning of static beam shapes. The imaging system, image processing, and reconstruction methodology were developed here and tested on a complexly shaped radiation field, specifically examining the unique niche areas for potential use in imaging of complex beams in a fast timescale in water. The accuracy relative to the expected dose was quantitatively examined and a potential calibration factor proposed, with a particular focus on the resolution and gamma index of the images.
2. MATERIALS AND METHODS
2.A. Experimental setup
Images were captured using an intensified charge-coupled device (ICCD) (PIMAX3 Unigen II, Gen III phosphor, Princeton Instruments, Acton, MA) coupled to a large aperture fixed focal length wide-angle lens (24 mm f/1.8, Sigma Corporation, Ronkonkama, NY). The imaging system camera was placed 2 m from the beam isocenter at the surface of a water tank (45.7 × 45.7 × 45.7 cm3) filled with tap water and a 1.0 g l−1 concentration of quinine sulfate, see Fig. 1(a). The use of quinine sulphate is detailed in a previous publication, and results in emission in the blue (shorter) wavelengths, within the spectral sensitivity of the camera used in this study. The camera was also aligned perpendicular to the beam direction, in line with the surface of the water (e.g., horizontal water surface in the vertical center of the images) and centered to the beam axis (i.e., the beam isocenter at a source surface distance, SSD, of 100 cm was at the origin of each camera image). Experiments were also conducted using a 6 MV x-ray photon beam from a clinical Linac (Varian 2100CD, Varian Medical Systems, Palo Alto, CA) with the XY jaws set to 25 × 25 cm2 and a multileaf collimator beam shape as that shown in Fig. 1(b), operating at a dose rate of 600 MU/min. The given imaging setup was chosen such that the theoretical depth of field would be sufficient to cover the entire Cherenkov light volume. Given a focal length of f = 24 mm, object distance of do = 2 m, aperture setting of F = 1.4, and camera pixel size of c = 12.8 μm, the depth of field was calculated in a manner similar to previous studies and found to be 31.8 cm.9,13 The field shape was chosen as an analog to a resolution test, in which seven square fields of increasing size (0.5, 1.0, 1.5, 2.0, 2.5, 3.0, and 3.5 cm) were arranged in a pattern using the multileaf collimator (MLC). The addition of the fluorophore (quinine sulphate) is necessary to convert the anisotropic Cherenkov photons to isotropic fluorescence, as reported previously.13 To prevent reflections within the water tank, the interior of all faces except that facing the camera was painted matte black. To minimize the effects of background lighting and improve the signal-to-background ratio, the room lights were turned off and the imaging system was synced to the Linac trigger signal as reported previously.20
FIG. 1.
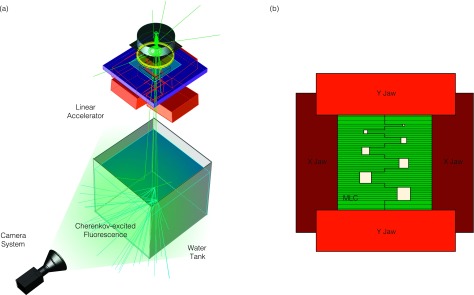
In (a), the experimental setup is shown. The camera is placed perpendicular to the radiation beam direction and images the Cherenkov-excited fluorescence through the sidewall of the water tank. In (b), the jaw and MLC configuration that create the field aperture are shown.
2.B. Tomographic image acquisition and processing
Tomographic images were acquired between 0° and 360° with a 2° angular resolution. Rather than employing a rotating camera, rotation was provided by the treatment couch and Linac collimator in the following manner: (1) optical projections from 0° to 180° were captured by setting the couch to 90° and rotating the collimator from 90° to 270° and (2) optical projections from 180° to 360° were captured by setting the couch to 270° and rerotating the collimator from 90° to 270°. At each angle, 50 MU (approximately 0.5 Gy) was delivered and the ICCD was set to 50 on CCD accumulations per image readout (i.e., each image was a summation of 50 Linac pulses), resulting in 18 frames/angle.
Due to the susceptibility of the camera sensor and intensifier to stray radiation and the inherently weak intensity of the induced Cherenkov light volume, a number of image processing steps are necessary to generate projections suitable for tomographic reconstruction.13,21
-
(1)
A radiation background image was taken at a single angle using identical imaging parameters (e.g., 50 on CCD accumulations for 50 MU), and the lens cap on to account for false counts collected due only to stray radiation striking the intensifier phosphor (due to the cylindrical symmetry of the Linac gantry head, it is not expected that this background will change with collimator rotational angle). This background was subtracted from each of the 18 images acquired at each beam angle. This process is a necessary background subtraction.
-
(2)
To account for interpixel sensitivity heterogeneity, as well as vignetting due to the camera lens, a flat field calibration image was taken by imaging a uniform reference intensity object with the lens on the camera. Each of the 18 images at each beam angle was then divided by this calibration factor. This process is a necessary sensitivity correction.
-
(3)
To form a single projection image, all 18 frames were median filtered as a stack. This process is a necessary hotspot removal step.
-
(4)
An edge-preserving bilateral filter was then applied to each resulting projection image as described previously.13,22 This process is important in improving the signal-to-noise ratio of the measurements by reducing interpixel Poisson noise due to the nature of the light measurement itself.
As a result of camera gating and the absence of ambient room lighting, a second background image due to ambient lighting was deemed unnecessary.
2.C. Beam hardening correction
As described in a previous study, discrepancies between the Cherenkov light emission and deposited dose arise due to hardening of the x-ray photon beam with depth in the irradiated material.23 To account for this phenomenon, in this study, the x-ray photon spectrum for a 6 MV beam from a Varian 2100C was simulated using a validated EGS/BEAMnrc geometry and recorded as a function of radial position on the phantom surface using the gamos/geant4 architecture.24–26 The results were generated for radial positions up to 20 cm for a fully open (no jaws) and represent a superposition of both the primary and extrafocal sources as detailed by Liu et al.27 For each location within the irradiated water medium, the x-ray photon spectrum, ϕ(r, z), was calculated analytically as
| (1) |
where ϕ(E, ro, zo) is the x-ray photon spectrum at the phantom surface, zo, at radial position, ro, calculated from the Monte Carlo simulation; μ(E) is the attenuation coefficient in water (calculated from data from the NIST x-ray attenuation coefficient database); and d is the distance traversed by an x-ray traveling in a straight line from (ro, zo) to (r, z).28 As an approximation, x-rays were assumed to travel in a straight line from the target (located at a distance equal to the SSD above the phantom surface), to each location within the phantom. Therefore, because z is the known depth of interest within the water phantom, the corresponding radial position at the phantom surface for any location in the water volume can be calculated as
| (2) |
where for the given study, SSD = 100 cm. Finally, to calculate the ratio of the relative light intensity to dose deposition at each point in the water volume, was calculated as
| (3) |
where was reported previously.23 The resulting calibration factor was applied to each voxel in the reconstruction to properly account for beam hardening artifacts.
2.D. Feldkamp–Davis–Kress (FDK) reconstruction
Cone beam reconstruction was performed using the open source cone beam reconstructer (OSCaR) based upon the FDK algorithm in matlab (v7.12.0 R2011a, The MathWorks, Natick MA), both with a standard ramp filter.29,30 In the cone beam geometry, the detector was translated to the focal plane of the camera (i.e., the source to axis distance, SAD, and source to detector distance, SDD, were the same, and the dimensions of the detector pixels were chosen to be 0.8 mm based upon the imaging of a reference object, see Fig. 2).
FIG. 2.

In (a), the cone beam geometry is shown. The camera captures a two-dimensional (2D) projection image of the induced 3D light volume. In the context of conventional x-ray cone beam tomography geometry, this is equivalent to a detector plate placed at the focal plane of the image system, in which the detector pixel size is the resolution of the imaging pixels at the focal plane. In addition, in this configuration, the source to axis distance (SAD) is equivalent to the source to detector distance (SDD). In (b) and (c), reference images are shown, where the center of the imaging chip (1024 × 1024 pixels) is aligned with the isocenter of the Linac, and a reference resolution checkerboard object is imaged to determine the spatial resolution.
2.E. Gamma index analysis
For 2D and 3D comparisons, the resulting Cherenkov light reconstruction was compared to the 3D dose distribution, which was exported from the treatment planning system (TPS, Eclipse, Varian, Palo Alto, CA) at a 1 mm resolution. Both volumes were normalized to a relative value of 100% at the center of the largest 3.5 cm field shape at a depth of +1.5 cm. For spatial registration, the 3D Cherenkov light reconstruction was also registered to the TPS system using rigid 3D registration in matlab.
After these processing procedures, gamma index maps were calculated for the following conditions:
-
(1)
A horizontal 2D map at a depth +1.5 cm for the Cherenkov light reconstruction with respect to the TPS.
-
(2)
The vertical 2D gamma index map at crossplane position of +5 cm for the Cherenkov light reconstruction with respect to the TPS.
-
(3)
The entire 3D gamma index map for the Cherenkov light measurement with respect to the TPS.
All gamma index maps were calculated using in matlab using a 3%/3 mm criterion.31 Using the resulting maps, passing fractions were calculated as a function of threshold dose in increments of 1%.
2.F. One-dimensional (1D) comparison to other experimental techniques
The experimental Cherenkov light reconstructions were also compared to other experimental methods, including scans using a water tank (IBA water phantom, IBA Dosimetry, Germany) and diode detector (Scandrotix, IBA Dosimetry, Germany), as well as phosphor film measurements (Kodak RT2000 CR System, Kodak, Rochester, NY).
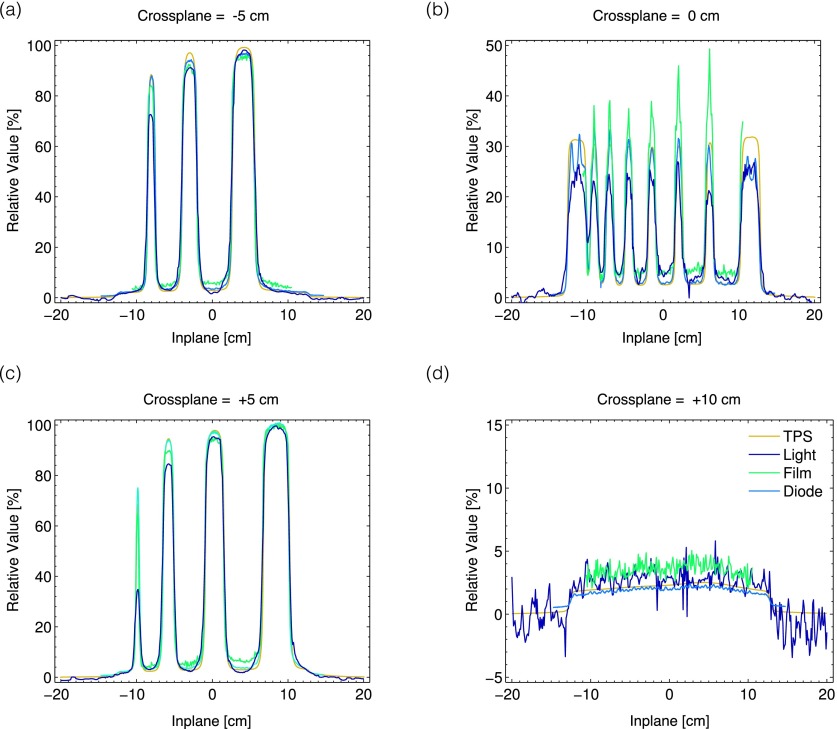
The 1D percent depth dose (PDD) curve was measured by vertically scanning the diode at a crossplane position of +5 cm and inplane position of +8.5 cm, corresponding to the center of the largest 3.5 cm MLC square field shape. In addition, lateral profiles were measured at a depth of +1.5 cm and crossplane positions of −5, 0, +5, and +10 cm, respectively, corresponding to scans through the centers of the left column of squares, center of the jaws where the ends of the closed MLC leaves meet, center of the right column of squares, and through a closed MLC position as shown in Fig. 1(b).
For the phosphor film measurement, the film was placed horizontally between two pieces of solid water (Gammex 457, Middleton, WI), where 1.5 cm of buildup was placed above the film, and 5.0 cm was placed below the film, and exposed for just 1 MU of dose to avoid saturation.
For spatial registration, the film measurement was registered to the TPS system using rigid 2D registration in matlab. In the case of the diode measurements, the results were already spatial registered due to the setup and calibration of the water relative to isocenter.
Additional metrics were calculated from the results to evaluate the proposed technique with respect to the other methods by calculating the following:
-
(1)
The peak value at a depth of +1.5 cm for all seven MLC field sizes for all methods.
-
(2)
The 1D integrated area under the curve at a depth of 1.5 cm for all seven MLC field sizes for all methods at relative values greater than 5%.
-
(3)
The penumbra width (lateral distance over which the field edge goes from 20% to 80%) at a depth of +1.5 cm for all seven MLC field sizes for all methods.
-
(4)
The standard deviation in each measurement between inplane positions of −10 and +10 cm for the +10 cm crossplane 1D scans for the diode, film, and Cherenkov light measurements.
3. RESULTS
3.A. Tomographic image acquisition and processing
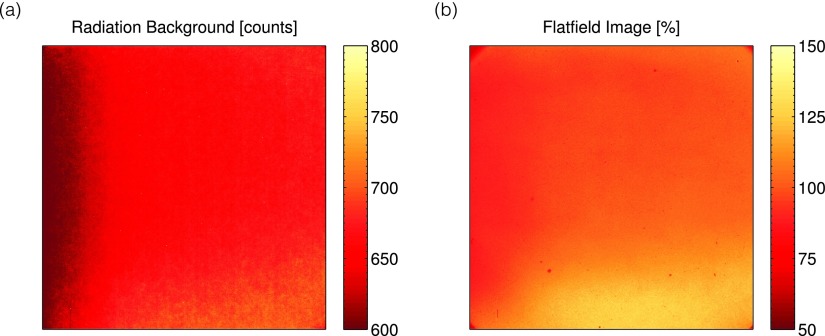
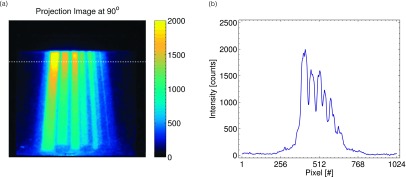
The results for the radiation background image and flat field calibration are shown in Figs. 3(a) and 3(b), respectively. As can be seen, the radiation background is on the order of 0–200 counts (the additional initial 600 count offset is built into the camera readout). In addition, due to variations in the intensifier and camera sensor sensitivity, as well as lens vignetting, the sensitivity of the imaging system showed variations as high as 50%. The similarity between the radiation background image and flat field image suggests that the nonuniformity is due to the sensitivity of the intensifier or sensor itself, rather than the optics due to use of the lens cap in acquiring the radiation background image. After calibration and image processing, the final projections were obtained; a representative projection image and horizontal line profile at a rotation of 90° are shown in Fig. 4 (enhanced online) from the entire projection image stack. The images clearly show changes in the beam projection as a function of angle, as well as the diverging profiles of the seven square field shapes created by the MLC.
FIG. 3.
In (a) and (b), the stray radiation background subtracted image, as well as the flat field calibration image for the imaging system used, is shown.
FIG. 4.
3.B. Beam hardening correction
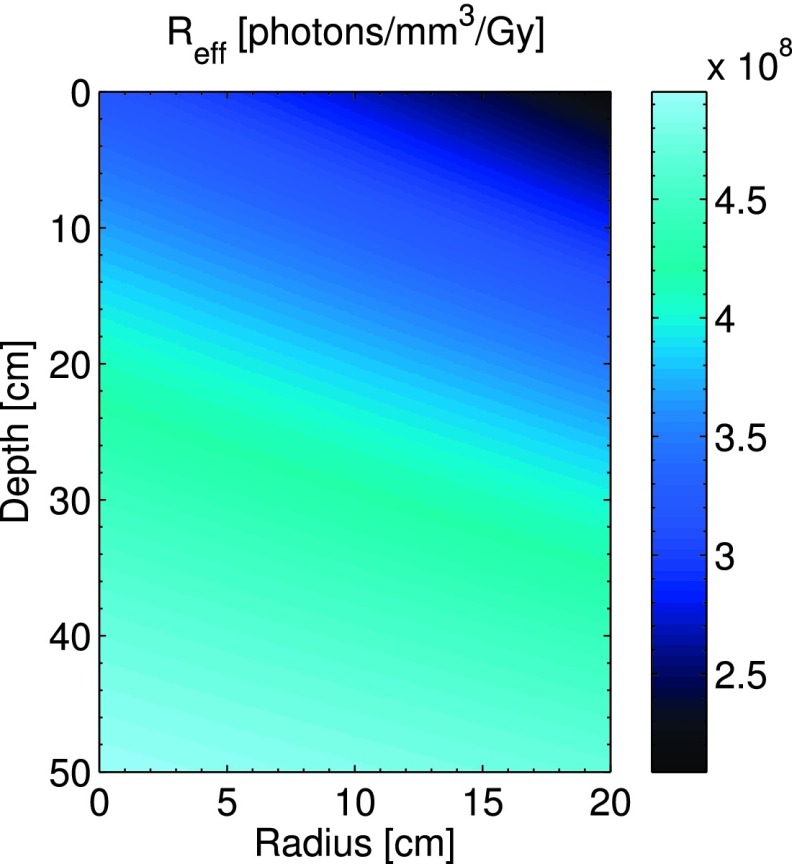
The resulting calibration factor given by Eq. (3) is shown in Fig. 5. This calibration factor relates the local number of Cherenkov photons generated in any given voxel to the dose deposited in that voxel and has units of [(photons/mm3)/Gy]. The results show that due to beam hardening, this ratio increases with depth and also increases at smaller off axis distances due to increased attenuation through the flattening filter.
FIG. 5.
The beam hardening correction factor is displayed as a function of depth, z, and radial position, r, within the water tank.
3.C. FDK reconstruction
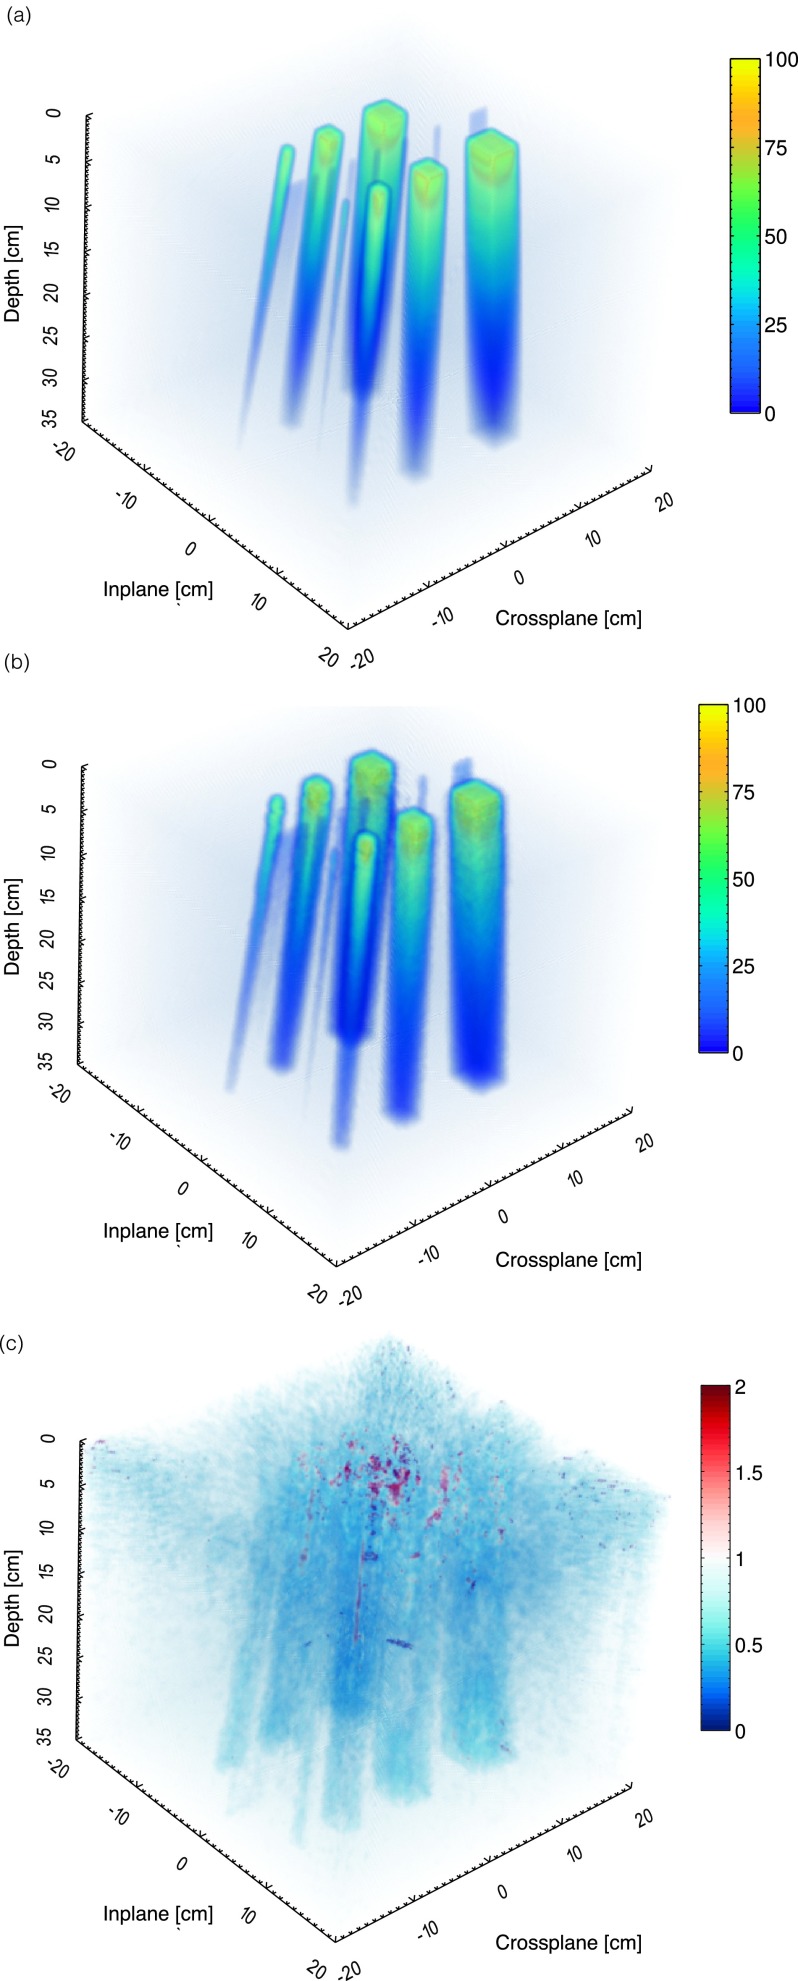
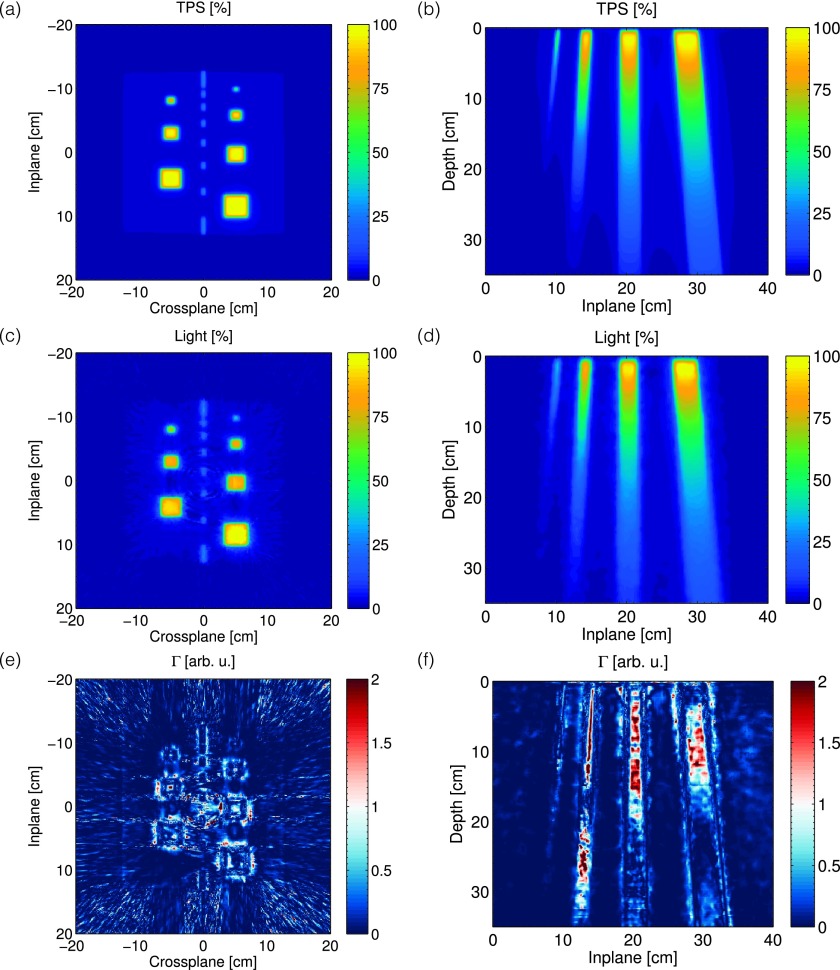
The exported 3D dose volume and 3D FDK cone beam reconstruction of the Cherenkov light volume are shown in Fig. 6, after applying the 3D beam hardening correction factor shown in Fig. 5. The volume is reconstructed at a 1 mm3 resolution over 40 × 40 × 35 cm3. Representative horizontal and vertical cross sections taken at a depth of +1.5 cm and crossplane position of +5 cm for the TPS and Cherenkov light reconstruction are also shown in Fig. 7.
FIG. 6.
In (a)–(c), the 3D dose volume from the TPS, Cherenkov light reconstruction, and gamma index map for a 3%/3 mm criterion is shown.
FIG. 7.
In [(a) and (b)] and [(c) and (d)], the 2D horizontal and vertical cross sections of the expected dose from the TPS, and the Cherenkov light reconstruction at a depth of z = 1.5 cm and off axis position of x = + 5 cm, are shown. The corresponding gamma index maps for a 3%/3 mm criterion are shown in (e) and (f).
3.D. Gamma index maps
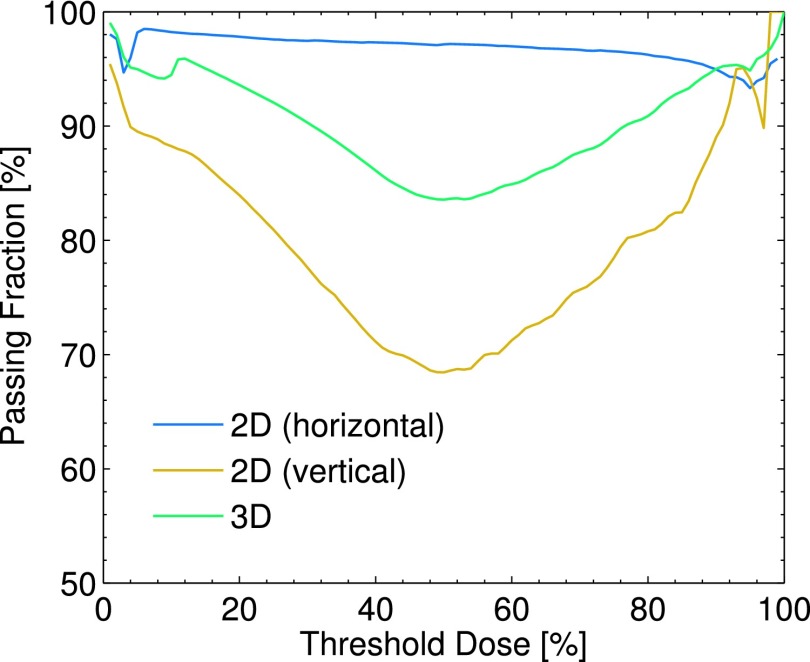
The resulting gamma index maps for the entire 3D volume, as well as both 2D cross sections, are shown in Fig. 6(c) and [Figs. 7(e) and 7(f)], respectively. The passing fraction as a function of threshold dose is also plotted in Fig. 8. Based on a given threshold dose, only those voxels in the TPS corresponding to a dose higher than the threshold dose were used in computing the passing fraction.
FIG. 8.
The passing fraction as a function of threshold dose is plotted for the 2D horizontal and vertical gamma index maps shown in [Figs. 7(e) and 7(f)], as well as the entire 3D volume shown in Fig. 6(c).
The 3D results show agreement, with the pass fraction of 94.5% for a threshold dose value of 10%. The horizontal 2D Cherenkov light reconstruction shows great agreement with the TPS, with the largest gamma values being concentrated at the high dose gradients at the field edges, and a passing fraction of 98.2% for a threshold dose of 10%. However, for the vertical cross section, the passing fraction varies from 70% to 95% depending on the selected threshold dose, with a passing fraction of 88.2% for a threshold dose of 10%.
3.E. 1D analysis
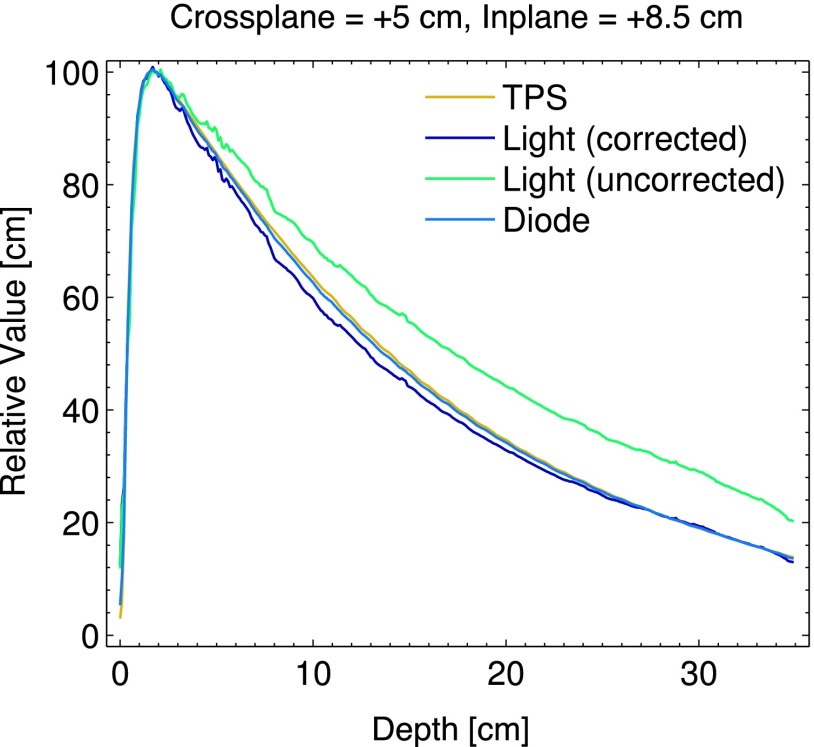
The PDD curves measured by the diode and Cherenkov light reconstruction (with and without beam hardening correction), with respect to the TPS are shown in Fig. 9. The diode and TPS agree to within 1% at all depths, and after beam hardening correction, the Cherenkov light reconstruction agrees with the TPS to within 4%.
FIG. 9.
The PDD for the largest field size at off axis positions of x = + 5 cm, y = + 8.5 cm is plotted for the TPS, beam hardening corrected and uncorrected Cherenkov light reconstructions, and diode.
The results of the 1D profiles measured by the diode, film, and Cherenkov light with respect to the TPS are also shown in Fig. 10. In general, the diode shows the most agreement with the TPS, the Cherenkov light reconstructions underestimate the peak dose for the smaller square fields, and the film overestimates the dose for both the intra- and inter-MLC leaf leakage.
FIG. 10.
In (a)–(d), the results of the 1D measurements from the TPS, Cherenkov light, film, and diode are plotted at off axis positions of x = − 5, 0, +5, and +10 cm. All measurements are for a depth of z = 1.5 cm in the water tank.
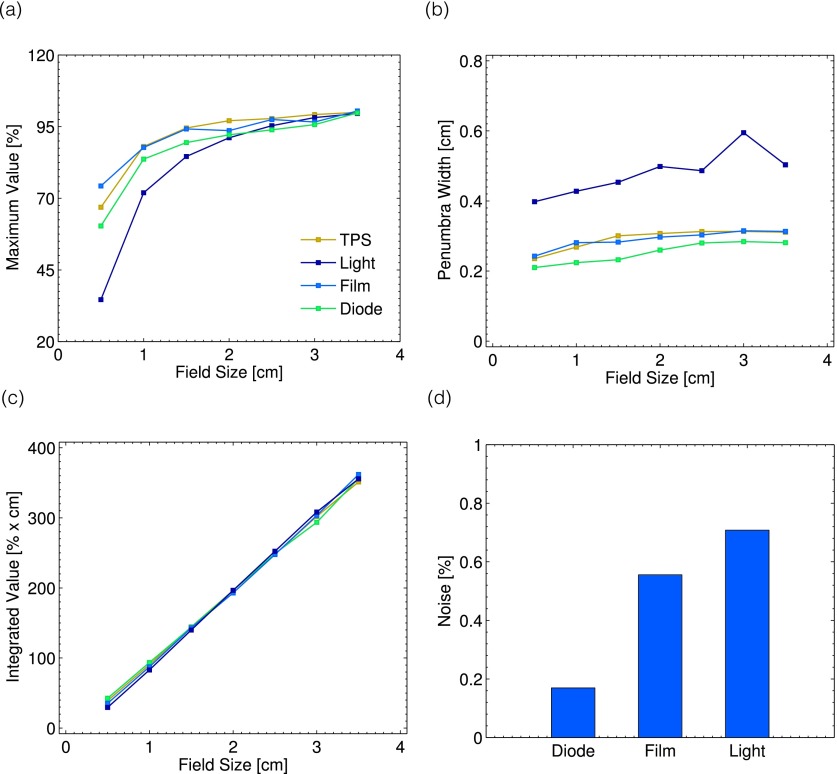
These findings are confirmed by metrics (1)–(4) described in Sec. 2.F. As can be seen in Fig. 11(a), with decreasing field size, the Cherenkov light reconstructions underestimate the maximum dose value. In addition, the penumbra width as a function of field size is larger for the Cherenkov light reconstructions, on the order of 4–6 mm, as opposed to the 2–3 mm measured by the other techniques, see Fig. 11(b). However, as a function of field size, the integrated area under the curve for all methods at square field size is equivalent, see Fig. 11(c). The standard deviation of the signal across a mostly uniform dose region, meant to serve as an analog for the noise of the technique, is shown in Fig. 11(d). The Cherenkov light reconstructions show the highest degree of noise, although for all three techniques this is under a value of 1% relative to the normalized value of 100% at a depth of +1.5 cm for the largest field size.
FIG. 11.
The metrics obtained from the 1D profiles are shown. In (a), the maximum value for each of the seven field sizes is plotted for all measurement techniques. The corresponding penumbra for each method as a function of field size is plotted in (b). In (c) and (d), the integrated area under the curve for each field size and measurement noise are shown.
4. DISCUSSION
The preliminary results in this study serve as an initial proof of concept exploration into optical cone beam computed tomography of Cherenkov-excited fluorescence for dosimetry of x-ray photon beams in water. Unlike a previous study, which had a limited field of view due to the use of a telecentric lens, the extension of the technique to the use of a regular commercial camera lens and cone beam reconstruction algorithm allows for the imaging of larger field sizes, as demonstrated here.14 In this study, a first order Monte Carlo derived correction factor for a beam hardening artifact was successfully applied for the first time. The accuracy of this approach could be further improved by calculating the x-ray fluence spectra at the phantom surface not only for a fully open field but also for any arbitrary field aperture as is currently done in dose-convolution algorithms.27
In addition, the results in this study demonstrate that the technique is capable of reconstructing complex, arbitrarily shaped field sizes with dimensions below 1 cm. The technique is also able to accurately capture the intra- and interleaf leakage, the latter of which is on the order of only 2%. However, as is seen in the metrics shown in Sec. 3.E, the Cherenkov light reconstructions show higher noise fluctuations (on the order of ∼0.7% for the beam measured in this study, compared to ∼0.5% for the film measurements and 0.2% for the diode) and underestimation of the peak dose with decreasing field size for field sizes less than 2 cm. The latter is likely due to blurring, as the calculated penumbra for each field size in the Cherenkov light reconstruction was larger than that of the TPS, diode, and film. As was also calculated, the integrated area under the curve for each field size and technique was equivalent, suggesting that in the Cherenkov light reconstruction, the same total intensity is simply distributed in a broader manner. The blurring could be attributed to several factors, including improper focusing of the camera lens, light transport governing the absorption and subsequent remission of the Cherenkov light to isotropic fluorescent light, refraction at the air, glass, water interface, light scattering within the water tank, and the breakdown of the validity of the optical cone beam analogy to x-ray cone beam tomography for the lens aperture used in this study. The latter two have been previously investigated, and deconvolution of a point-spread function due to all of these factors may be explored in subsequent studies.15,17,32
Despite these discrepancies, the proposed technique shows overall promise as a 2D and 3D relative dosimetry technique, with a calculated 3D gamma index pass rate for a 3%/3 mm criterion of 94.5% for a 10% threshold dose value. The results can be obtained in a rapid manner, as the total beam time required to obtain the projection information in this study was approximately 15 min (although this does not account for the time necessary to change the collimator rotation for each beam), and the resolution can be easily tailored to the desired beam size (i.e., a wide-angle lens such as that used on this study can profile large beams, whereas a higher focal length could provide high resolution for smaller beams such as those used in stereotactic radiotherapy and surgery). Furthermore, extension to absolute dosimetry may be possible by converting the recorded intensity counts to a dosimetric quantity (i.e., MU or Gy), and although only a 6 MV beam was explored in this study, it is expected that any photon beam energy may be profiled by applying the proper beam-energy specific calibration factor. Therefore, the proposed technique may be an important dosimetry tool for future research in the field of quality assurance and 3D dosimetry in water. While the results in this paper demonstrate the accuracy of the proposed technique in water, it should be noted that the technique is not suitable for in vivo dosimetry in a turbid medium, where the FDK reconstruction method is not applicable due to the optical scattering of the induced CEF signal.
5. CONCLUSIONS
We present optical cone beam computed tomography of photon beams using Cherenkov-excited fluorescence in water for the first time and evaluate its accuracy for field sizes ranging from 0.5 to 3.5 cm against more traditional techniques such as diode and phosphor film dosimetry. By capturing 180 projection images at 50 MU each between 0° and 360° rotations and applying a Monte Carlo derived correction factor for beam hardening, the proposed system was able to provide a 94.5% passing rate based upon a 3%/3 mm gamma index criterion with respect to the TPS over a large 40 × 40 × 40 cm3 dosimetric volume at a 1 mm resolution in approximately 15 min of beam time. The measurement noise was found to be <1%, and the system was able to capture dosimetric information of interleaf leakage below 5%. Future improvements will include improvement of the correction factor calculation, as well as point-spread function determination and deconvolution for improved accuracy for subcentimeter field sizes.
ACKNOWLEDGMENT
This work has been funded by NIH Grant Nos. RO1CA120368 and R21EB017559.
REFERENCES
- 1.Guillot M., Gingras L., Archambault L., Beddar S., and Beaulieu L., “Toward 3D dosimetry of intensity modulated radiation therapy treatments with plastic scintillation detectors,” J. Phys.: Conf. Ser. 250, 012006 (2010). 10.1088/1742-6596/250/1/012006 [DOI] [Google Scholar]
- 2.Kirov A. S., Piao J. Z., Mathur N., Miller T. R., Devic S., Trichter S., Zaider M., LoSasso T., and Soares C., “A test of the 3D scintillation dosimetry method for a Ru-106 eye plaque applicator,” Med. Phys. 32, 2002 (2005). 10.1118/1.1997957 [DOI] [PubMed] [Google Scholar]
- 3.Kirov A. S., Piao J. Z., Mathur N. K., Miller T. R., Devic S., Trichter S., Zaider M., Soares C. G., and LoSasso T., “The three-dimensional scintillation dosimetry method: Test for a 106Ru eye plaque applicator,” Phys. Med. Biol. 50, 3063–3081 (2005). 10.1088/0031-9155/50/13/007 [DOI] [PubMed] [Google Scholar]
- 4.Kirov A. S., Shrinivas S., Hurlbut C., Dempsey J. F., Binns W. R., and Poblete J. L., “New water equivalent liquid scintillation solutions for 3D dosimetry,” Med. Phys. 27, 1156–1164 (2000). 10.1118/1.598993 [DOI] [PubMed] [Google Scholar]
- 5.Kroll F., Pawelke J., and Karsch L., “Preliminary investigations on the determination of three-dimensional dose distributions using scintillator blocks and optical tomography,” Med. Phys. 40, 082104 (12pp.) (2013). 10.1118/1.4813898 [DOI] [PubMed] [Google Scholar]
- 6.Sakhalkar H. S. and Oldham M., “Fast, high-resolution 3D dosimetry utilizing a novel optical-CT scanner incorporating tertiary telecentric collimation,” Med. Phys. 35, 101–111 (2008). 10.1118/1.2804616 [DOI] [PMC free article] [PubMed] [Google Scholar]
- 7.McJury M., Oldham M., Cosgrove V. P., Murphy P. S., Doran S., Leach M. O., and Webb S., “Radiation dosimetry using polymer gels: Methods and applications,” Br. J. Radiol. 73, 919–929 (2000). 10.1259/bjr.73.873.11064643 [DOI] [PubMed] [Google Scholar]
- 8.Kelly R. G., Jordan K. J., and Battista J. J., “Optical CT reconstruction of 3D dose distributions using the ferrous-benzoic-xylenol (FBX) gel dosimeter,” Med. Phys. 25, 1741–1750 (1998). 10.1118/1.598356 [DOI] [PubMed] [Google Scholar]
- 9.Beddar S., Archambault L., Sahoo N., Poenisch F., Chen G. T., Gillin M. T., and Mohan R., “Exploration of the potential of liquid scintillators for real-time 3D dosimetry of intensity modulated proton beams,” Med. Phys. 36, 1736–1743 (2009). 10.1118/1.3117583 [DOI] [PMC free article] [PubMed] [Google Scholar]
- 10.Maryanski M. J., Ibbott G. S., Eastman P., Schulz R. J., and Gore J. C., “Radiation therapy dosimetry using magnetic resonance imaging of polymer gels,” Med. Phys. 23, 699–705 (1996). 10.1118/1.597717 [DOI] [PubMed] [Google Scholar]
- 11.Maryanski M. J., Schulz R. J., Ibbott G. S., Gatenby J. C., Xie J., Horton D., and Gore J. C., “Magnetic-resonance-imaging of radiation-dose distributions using a polymer-gel dosimeter,” Phys. Med. Biol. 39, 1437–1455 (1994). 10.1088/0031-9155/39/9/010 [DOI] [PubMed] [Google Scholar]
- 12.Glaser A. K., Davis S. C., McClatchy D. M., Zhang R., Pogue B. W., and Gladstone D. J., “Projection imaging of photon beams by the Cerenkov effect,” Med. Phys. 40, 012101 (14pp.) (2013). 10.1118/1.4770286 [DOI] [PMC free article] [PubMed] [Google Scholar]
- 13.Glaser A. K., Davis S. C., Voigt W. H., Zhang R., Pogue B. W., and Gladstone D. J., “Projection imaging of photon beams using Cerenkov-excited fluorescence,” Phys. Med. Biol. 58, 601–619 (2013). 10.1088/0031-9155/58/3/601 [DOI] [PMC free article] [PubMed] [Google Scholar]
- 14.Glaser A. K., Voigt W. H., Davis S. C., Zhang R., Gladstone D. J., and Pogue B. W., “Three-dimensional Cerenkov tomography of energy deposition from ionizing radiation beams,” Opt. Lett. 38, 634–636 (2013). 10.1364/OL.38.000634 [DOI] [PMC free article] [PubMed] [Google Scholar]
- 15.Olding T., Holmes O., and Schreiner L. J., “Cone beam optical computed tomography for gel dosimetry I: Scanner characterization,” Phys. Med. Biol. 55, 2819–2840 (2010). 10.1088/0031-9155/55/10/003 [DOI] [PubMed] [Google Scholar]
- 16.Olding T., Holmes O., Dejean P., McAuley K. B., Nkongchu K., Santyr G., and Schreiner L. J., “Small field dose delivery evaluations using cone beam optical computed tomography-based polymer gel dosimetry,” J. Med. Phys. 36, 3–14 (2011). 10.4103/0971-6203.75466 [DOI] [PMC free article] [PubMed] [Google Scholar]
- 17.Olding T. and Schreiner L. J., “Cone-beam optical computed tomography for gel dosimetry II: Imaging protocols,” Phys. Med. Biol. 56, 1259–1279 (2011). 10.1088/0031-9155/56/5/003 [DOI] [PubMed] [Google Scholar]
- 18.Sakhalkar H. S., Adamovics J., Ibbott G., and Oldham M., “A comprehensive evaluation of the PRESAGE/optical-CT 3D dosimetry system,” Med. Phys. 36, 71–82 (2009). 10.1118/1.3005609 [DOI] [PMC free article] [PubMed] [Google Scholar]
- 19.Thomas A., Newton J., Adamovics J., and Oldham M., “Commissioning and benchmarking a 3D dosimetry system for clinical use,” Med. Phys. 38, 4846–4857 (2011). 10.1118/1.3611042 [DOI] [PMC free article] [PubMed] [Google Scholar]
- 20.Glaser A. K., Zhang R., Davis S. C., Gladstone D. J., and Pogue B. W., “Time-gated Cherenkov emission spectroscopy from linear accelerator irradiation of tissue phantoms,” Opt. Lett. 37, 1193–1195 (2012). 10.1364/OL.37.001193 [DOI] [PMC free article] [PubMed] [Google Scholar]
- 21.Archambault L., Briere T. M., and Beddar S., “Transient noise characterization and filtration in CCD cameras exposed to stray radiation from a medical linear accelerator,” Med. Phys. 35, 4342–4351 (2008). 10.1118/1.2975147 [DOI] [PMC free article] [PubMed] [Google Scholar]
- 22.Tomasi C. and Manduchi R., “Bilateral filtering for gray and color images,” in IEEE International Conference on Computer Vision (IEEE, Bombay, India, 1988). [Google Scholar]
- 23.Glaser A. K., Zhang R., Gladstone D. J., and Pogue B. W., “Optical dosimetry of radiotherapy beams using Cherenkov radiation: The relationship between light emission and dose,” Phys. Med. Biol. 59, 3789–3811 (2014). 10.1088/0031-9155/59/14/3789 [DOI] [PubMed] [Google Scholar]
- 24.Siebers J. V., Keall P. J., Libby B., and Mohan R., “Comparison of EGS4 and MCNP4b Monte Carlo codes for generation of photon phase space distributions for a Varian 2100C,” Phys. Med. Biol. 44, 3009–3026 (1999). 10.1088/0031-9155/44/12/311 [DOI] [PubMed] [Google Scholar]
- 25.Arce P., Rato P., Canadas M., and Lagares J. I., “GAMOS: a GEANT4-based Easy and Flexible Framework for Nuclear Geant4 Simulations,” Presented at the IEEE Nuclear Science Symposium Conference Record, NSS ’08 (2008). [Google Scholar]
- 26.Agostinelli S., Allison J., Amako K., Apostolakis J., Araujo H., Arce P., Asai M., Axen D., Banerjee S., Barrand G., Behner F., Bellagamba L., Boudreau J., Broglia L., Brunengo A., Burkhardt H., Chauvie S., Chuma J., Chytracek R., Cooperman G., Cosmo G., Degtyarenko P., Dell’Acqua A., Depaola G., Dietrich D., Enami R., Feliciello A., Ferguson C., Fesefeldt H., Folger G., Foppiano F., Forti A., Garelli S., Giani S., Giannitrapani R., Gibin D., Gómez Cadenas J. J., González I., Gracia Abril G., Greeniaus G., Greiner W., Grichine V., Grossheim A., Guatelli S., Gumplinger P., Hamatsu R., Hashimoto K., Hasui H., Heikkinen A., Howard A., Ivanchenko V., Johnson A., Jones F. W., Kallenbach J., Kanaya N., Kawabata M., Kawabata Y., Kawaguti M., Kelner S., Kent P., Kimura A., Kodama T., Kokoulin R., Kossov M., Kurashige H., Lamanna E., Lampén T., Lara V., Lefebure V., Lei F., Liendl M., Lockman W., Longo F., Magni S., Maire M., Medernach E., Minamimoto K., de Mora Freitas P., Morita Y., Murakami K., Nagamatu M., Nartallo R., Nieminen P., Nishimura T., Ohtsubo K., Okamura M., O’Neale S., Oohata Y., Paech K., Perl J., Pfeiffer A., Pia M. G., Ranjard F., Rybin A., Sadilov S., Salvo E. Di, Santin G., Sasaki T., Savvas N., Sawada Y., Scherer S., Sei S., Sirotenko V., Smith D., Starkov N., Stoecker H., Sulkimo J., Takahata M., Tanaka S., Tcherniaev E., Safai tehrani E., Tropeano M., Truscott P., Uno H., Urban L., Urban P., Verderi M., Walkden A., Wander W., Weber H., Wellisch J. P., Wenaus T., Williams D. C., Wright D., Yamada T., Yoshida H., and Zschiesche D., “ geant4—A simulation toolkit,” Nucl. Instrum. Methods Phys. Res., Sect. A 506, 250–303 (2003). 10.1016/S0168-9002(03)01368-8 [DOI] [Google Scholar]
- 27.Liu H. H., Mackie T. R., and McCullough E. C., “A dual source photon beam model used in convolution/superposition dose calculations for clinical megavoltage x-ray beams,” Med. Phys. 24, 1960–1974 (1997). 10.1118/1.598110 [DOI] [PubMed] [Google Scholar]
- 28.Hubbel J. H. and Seltzer S. M., “Tables of x-ray mass attenuation coefficients and mass energy-absorption coefficients from 1 keV to 20 MeV for elements z = 1 to 92 and 48 additional substances of dosimetric interest (version 1.4)” (National Institute of Standards and Technology, Gaithersburg, MD, 2004), http://www.nist.gov/pml/data/xraycoef/. [Google Scholar]
- 29.Feldkamp L. A., Davis L. C., and Kress J. W., “Practical cone-beam algorithm,” J. Opt. Soc. Am. A 1, 612–619 (1984). 10.1364/JOSAA.1.000612 [DOI] [Google Scholar]
- 30.Rezvani N., Aruliah D., Jackson K., Moseley D., and Siewerdsen J., “OSCaR: An open-source cone-beam CT reconstruction tool for imaging research,” Med. Phys. 34, 2341 (2007), http://adsabs.harvard.edu/abs/2007MedPh..34.2341R. 10.1118/1.2760393 [DOI] [Google Scholar]
- 31.Persoon L. C., Podesta M., van Elmpt W. J., Nijsten S. M., and Verhaegen F., “A fast three-dimensional gamma evaluation using a GPU utilizing texture memory for on-the-fly interpolations,” Med. Phys. 38, 4032–4035 (2011). 10.1118/1.3595114 [DOI] [PubMed] [Google Scholar]
- 32.Ponisch F., Archambault L., Briere T. M., Sahoo N., Mohan R., Beddar S., and Gillin M. T., “Liquid scintillator for 2D dosimetry for high-energy photon beams,” Med. Phys. 36, 1478–1485 (2009). 10.1118/1.310639033 [DOI] [PMC free article] [PubMed] [Google Scholar]


