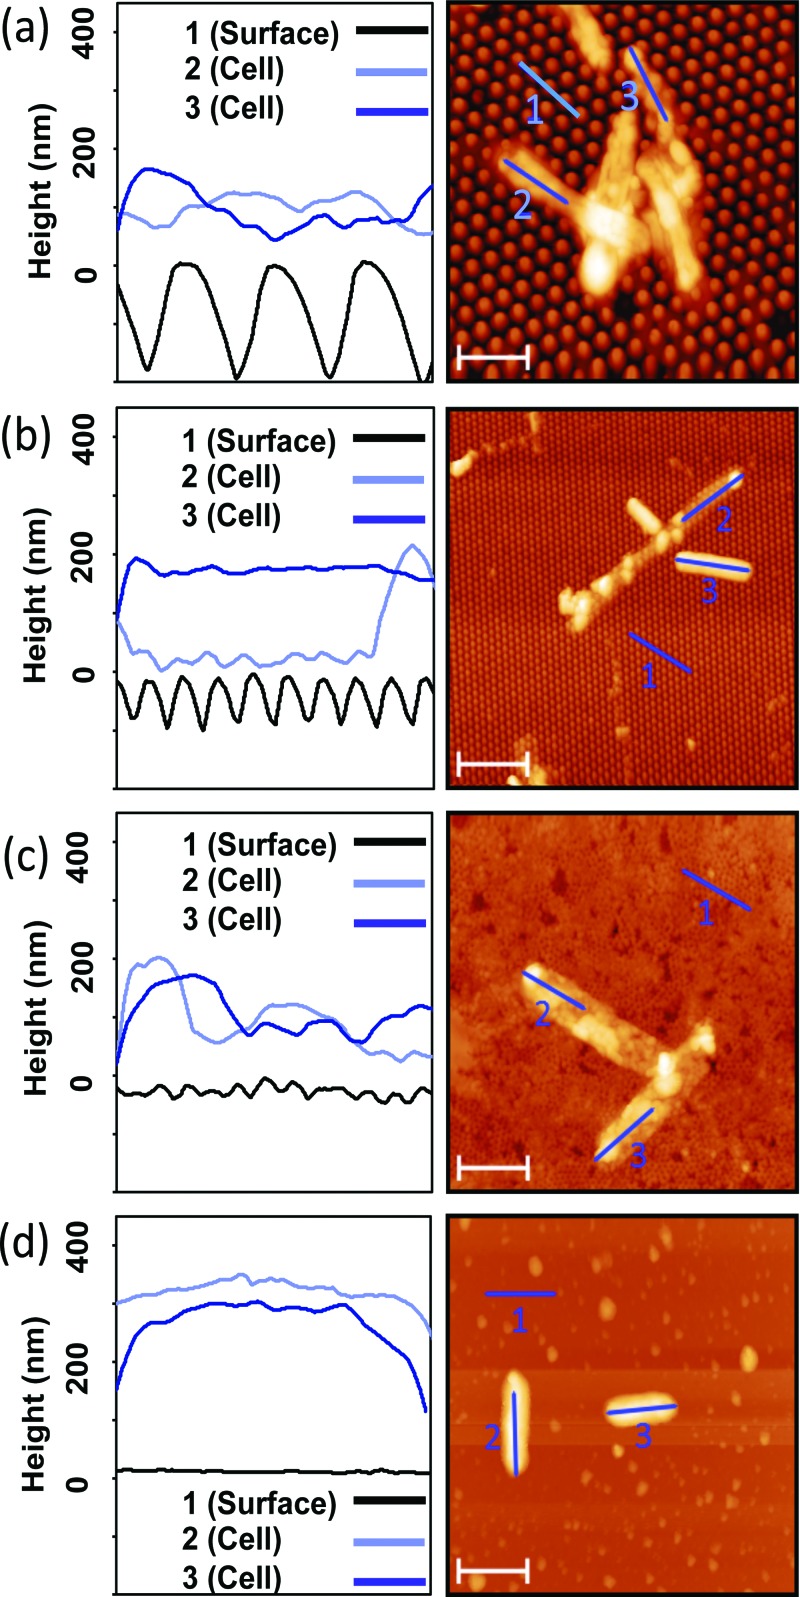
Fig. 5.
Representative AFM micrographs and height profiles of bacteria on (a) P600, (b) P300, (c) P200, and (d) flat film. Left column: x axes widths =2 μm. Right column: Scale bars = 2 μm. Deflated bacteria can be seen on the P600, P300, and P200 surfaces. The tallest observed bacteria, measured on the flat samples, were 300 nm. Nonuniform deflation is observed in cell 2 on the P600 surface. Variance in the P600 bacteria height is caused by cell clumping.

