Abstract
Purpose:
Pulmonary positron emission tomography (PET) imaging is confounded by blurring artifacts caused by respiratory motion. These artifacts degrade both image quality and quantitative accuracy. In this paper, the authors present a complete data acquisition and processing framework for respiratory motion compensated image reconstruction (MCIR) using simultaneous whole body PET/magnetic resonance (MR) and validate it through simulation and clinical patient studies.
Methods:
The authors have developed an MCIR framework based on maximum a posteriori or MAP estimation. For fast acquisition of high quality 4D MR images, the authors developed a novel Golden-angle RAdial Navigated Gradient Echo (GRANGE) pulse sequence and used it in conjunction with sparsity-enforcing k-t FOCUSS reconstruction. The authors use a 1D slice-projection navigator signal encapsulated within this pulse sequence along with a histogram-based gate assignment technique to retrospectively sort the MR and PET data into individual gates. The authors compute deformation fields for each gate via nonrigid registration. The deformation fields are incorporated into the PET data model as well as utilized for generating dynamic attenuation maps. The framework was validated using simulation studies on the 4D XCAT phantom and three clinical patient studies that were performed on the Biograph mMR, a simultaneous whole body PET/MR scanner.
Results:
The authors compared MCIR (MC) results with ungated (UG) and one-gate (OG) reconstruction results. The XCAT study revealed contrast-to-noise ratio (CNR) improvements for MC relative to UG in the range of 21%–107% for 14 mm diameter lung lesions and 39%–120% for 10 mm diameter lung lesions. A strategy for regularization parameter selection was proposed, validated using XCAT simulations, and applied to the clinical studies. The authors’ results show that the MC image yields 19%–190% increase in the CNR of high-intensity features of interest affected by respiratory motion relative to UG and a 6%–51% increase relative to OG.
Conclusions:
Standalone MR is not the traditional choice for lung scans due to the low proton density, high magnetic susceptibility, and low relaxation time in the lungs. By developing and validating this PET/MR pulmonary imaging framework, the authors show that simultaneous PET/MR, unique in its capability of combining structural information from MR with functional information from PET, shows promise in pulmonary imaging.
Keywords: PET/MR, motion compensation, multimodal imaging, pulmonary, gating, MAP reconstruction
1. INTRODUCTION
Respiratory motion poses a significant challenge to pulmonary positron emission tomography (PET) imaging by causing blurring artifacts, which degrade both image quality and quantitation. Motion-induced blurring, which may lead to underestimation of tumor activity and overestimation of tumor volume,1 is a major deterrent for therapeutic monitoring, which relies on the consistency of quantitative information across scans. Additionally, motion artifacts may have a tremendous impact on lesion detectability and often result in small lesions remaining undetected,2,3 thereby jeopardizing diagnosis and staging. As PET plays an important clinical role in the staging and treatment evaluation of thoracic lesions,4,5 such inaccuracies in quantitation hinder cancer management. A variety of motion tracking systems are available, which generate external chest motion trajectories (most commonly through visual markers monitored with cameras or through pressure sensors mounted on bellows) that can be used as surrogates for internal motion measures.6 The respiratory signals generated by these systems can be used to perform respiratory gating, a technique in which emission events detected during short time windows corresponding only to a specific respiratory phase or gate (within which motion effects can be assumed to be negligible) are used for reconstruction.7,8 This technique, however, sacrifices signal-to-noise ratio (SNR) as it only uses a small fraction of the emission events.
A more sophisticated solution to the motion problem is by means of determining volumetric deformation fields and using them to compensate for motion. Motion compensation via pre-reconstruction affine repositioning of the lines of response, which has been successfully applied to neuroimaging studies involving rigid motion of the head,9,10 is unsuitable for pulmonary applications as respiratory motion causes non-rigid deformations of the thorax and upper abdomen.11,12 Instead, accurate compensation of respiratory motion requires volumetric deformation fields computed through non-rigid registration typically of 4D anatomical images, gated in synchrony with the PET. The final PET image corresponding to a chosen reference gate is either computed via a reconstruct-transform-average (RTA) approach using individual gated PET images13–15 or by incorporating the deformation fields directly into a motion compensated image reconstruction (MCIR) framework that outputs a single PET image at the reference gate.16–20 Some works have taken these approaches one step further by performing joint estimation of images and deformation fields.21–24 Studies comparing the RTA approach with MCIR generally concur that the latter approach yields higher quantitative accuracy.25–29 While in principle it is possible to perform MCIR using motion information derived directly from 4D PET images, either without attenuation correction30 or with attenuation correction using a respiratory-averaged computed tomography (CT) image,31,32 the accuracy of these methods is limited by the poor anatomical detail in the PET images.33 Hence, despite the added radiation dose imposed by 4D CT, the majority of MCIR studies reported are based on motion information derived from 4D CT images.18,19,25,34 Due to the sequential nature of the PET and CT scans in PET/CT systems, accurate synchronization of PET and CT gates can be challenging and is further complicated by the inherent variability in the breathing patterns of patients over time.35–37
Simultaneous whole body PET/MR in an emerging technology that unifies PET (a physiological imaging technique) with magnetic resonance (MR, primarily used for imaging the anatomy), thereby enabling synchronized capture of both structure and function. PET/MR successfully addresses several of the limitations of PET/CT in MCIR. Unlike CT, MR yields superb soft-tissue contrast and high spatial resolution without any radiation burden. Additionally, the simultaneity of the PET and MR components eliminates the problems due to mismatch between the PET and the CT in terms of position and respiratory phase frequently encountered with PET/CT. Despite the initial success of PET/MR in MCIR,38–42 high quality pulmonary imaging with this new technology is still an open problem since the low proton density, large susceptibility, and very short in the lungs make pulmonary MR imaging challenging. While tagged MR studies have been successfully used in phantoms, rabbits, and primates,39–41 tags fade too quickly to capture the longer breathing cycle in humans. A variety of methods have been proposed to generate 4D MR image sequences in the presence of breathing motion. A slice-stacking technique based on a 2D navigator was described in Ref. 43. 2D and 3D MR protocols were compared in Ref. 44. A navigator-based MR sequence with radial phase encoding was presented in Ref. 45 and was used in PET/MR simulation studies for nonrigid bulk motion correction. PET/MR phantom imaging results based on a real-time MR sequence with 1D navigators were presented in Ref. 46. These studies highlight the merits of MCIR in simulation and phantom studies.
In this paper, we present an MCIR framework for pulmonary PET/MR imaging and validate it using clinical datasets. This is an extension of our prior reports,47,48 which, to our knowledge, present the first clinical results using PET/MR pulmonary imaging with MCIR. Two subsequent studies have shown preliminary clinical results demonstrating the utility of PET/MR in capturing and correcting for respiratory motion in the lungs.49,50 4D MR images were assembled from 2D slices using a 1D pencil beam navigator and used to generate thoracic PET images using the RTA method in Ref. 49. In contrast with this work, which uses Cartesian sampling, we have designed a radial MR sequence, which is more well-suited for 4D imaging applications. A self-gated 3D radial stack-of-stars MR sequence was presented in Ref. 50 and was used for RTA-based motion correction of PET images. One key difference between this method and our approach is that we use a navigator, which, compared to self-gating, is less prone to corrupting factors such as noise, scanner gradient delay, field changes etc.
The main contributions of this work are as follows: We have designed a navigator-encapsulated golden-angle radial MR pulse sequence and combined it with sparsity-enforcing iterative reconstruction to generate high-quality 4D MR images of the lungs under free-breathing conditions. We have developed an optimized histogram-based data binning scheme for retrospective gating that leads to roughly equal amounts of PET and MR data per gate. We have also developed an MCIR framework for PET based on maximum a posteriori (MAP) estimation with gradient-based optimization. The advantages of regularization in MCIR have been demonstrated in Ref. 51 using the one-step-late expectation maximization or OSL-EM approach. Unlike OSL-EM, which has been shown to converge only for certain forms of the regularizer,52 our MAP technique with gradient ascent guarantees convergence of the inverse problem for a wide range of priors.
Section 2 provides details on all the data processing steps, the key components of the MCIR framework, the simulation setup, the details of the clinical experiments, and the figures of merit used for evaluation. In Sec. 3, we present results from a simulation study and three clinical patient studies. A discussion of our results is presented in Sec. 4.
2. MATERIALS AND METHODS
2.A. Overall framework
The data acquisition and processing framework shown in Fig. 1 was developed for a Biograph mMR whole body simultaneous PET/MR scanner (Siemens Medical Systems, Erlangen, Germany). The PET detector assembly in this scanner, consisting of arrays of MR-compatible avalanche photodiodes (APDs) and detector blocks with 4 × 4 × 20 mm3 lutetium oxyorthosilicate (LSO) crystals, is housed in the bore of a 3 T superconducting magnet. The PET field of view (FOV) is 59.4 cm in the transaxial direction and 25.8 cm in the axial direction. For MCIR, PET data are acquired in list mode. MR k-space data are collected simultaneously with the PET. Both the PET and the MR raw data are binned to gates retrospectively. The gated MR images are used to compute deformation fields and gated attenuation maps, which serve as inputs to the PET reconstruction module. The MAP reconstruction module then outputs the final PET image.
FIG. 1.
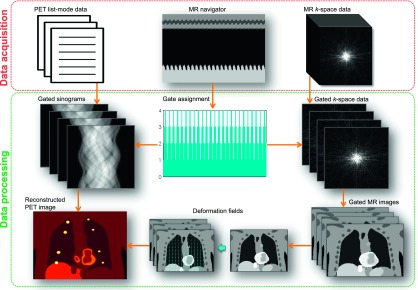
Data acquisition and processing framework for MCIR using simultaneous PET/MR.
2.B. PET data model and MAP reconstruction
The PET data model for MCIR can be obtained by concatenating the models for the individual gates and incorporating deformation information. The unknown activity image is assumed to correspond to a reference gate, a discrete phase of motion selected as the reference. Deformation fields map this reference gate to all other gates. The mean of the data vector corresponding to the kth gate, , can be modeled as53
| (1) |
Here, x ∈ ℝn is the reference gate image, Psens ∈ ℝm×n is a diagonal matrix representing the detector sensitivity, Pblur ∈ ℝm×n accounts for detector blurring due to scattering, random coincidences, and crystal penetration, is a diagonal matrix consisting of attenuation coefficients for the kth gate, Pgeom ∈ ℝm×n is the geometric projector, the (i, j)th element of which represents the probability that a photon pair produced in voxel j reaches the front faces of the detector pair i, Tk is a trilinear interpolation matrix generated from voxelwise deformation fields, which transforms x to the kth gate, and and represent the mean of the random and scattered events for the kth gate. This model assumes motion effects to be negligible within each gate.
MAP estimation involves maximization of the posterior probability density function, p(x|y) = p(y|x) p(x)/p(y).53 For PET imaging, p(y|x) is the Poisson likelihood with mean (mean data vector concatenated over all gates). The prior probability is usually assumed to follow a Gibbs distribution of the form p(x) = (1/Z) e−βU(x), where U(x) is a Gibbs energy function and β is the regularization parameter. Taking logarithms of both sides and dropping the term which is constant with respect to the unknown image, the MAP objective function can be represented as
| (2) |
where L(y|x) is the Poisson log likelihood and U(x) is the uniform quadratic penalty, which represents a uniform Gaussian distribution on the nearest-neighbor intensity differences within the local neighborhood, , of a voxel j. In this paper, we compare three different image generation approaches:
-
•OG: Conventional sinogram-based MAP reconstruction using counts for one gate—the reference gate (k = 1) with
(3) -
•UG: Conventional sinogram-based MAP reconstruction using all (ungated) counts with
(4) -
•MC: MAP MCIR using gated sinograms with
(5)
In each case, we minimize the objective function in (2) using the preconditioned conjugate gradient algorithm with a bent Armijo line search to impose non-negativity.54
2.C. MR image acquisition and reconstruction
MR imaging of the lungs is challenging due to the following facts: (1) The lungs contain only about 800 g of tissue and blood, distributed over a volume of 4–6 l, leading to very low proton density and hence low MR signal intensity, and (2) the high magnetic susceptibility at the alveolar surfaces leads to a very short and hence causes rapid dephasing of the MR signal.55 Additionally, thoracic motion necessitates the use of fast MR pulse sequences to prevent motion artifacts, further contributing to the challenge. For real-time motion capture, we have developed a novel MR pulse sequence entitled Golden-angle RAdial Navigated Gradient Echo (GRANGE). This sequence uses radial sampling, which enables oversampling of the central part of k-space (where most of the useful image information is typically concentrated) with gradual azimuthal undersampling of the extremities. Each radial line in k-space captures both low and high frequency information. A reduction in the number of k-lines therefore does not directly translate to a loss of resolution or ghosting artifacts unlike some Cartesian trajectories. Instead undersampling for radial sequences, as we will demonstrate, typically translates to radial streaking artifacts. Three key enabling characteristics of our approach described below, including two features of the GRANGE sequence and the use of sparsity-enforcing iterative reconstruction, make our approach ideal for pulmonary imaging with free breathing and retrospective data binning and processing.
2.C.1. Slice-projection navigator
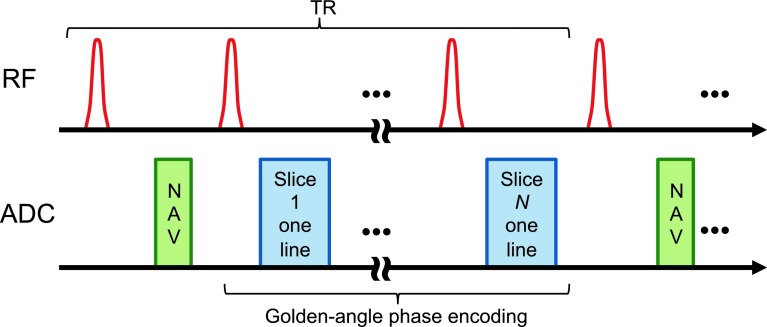
For each repetition time (TR), our sequence first acquires a fast 1D slice-projection navigation signal to track the diaphragm position.56 It then acquires radial k-space lines in a slice-interleaved fashion as illustrated in Fig. 2. The same sequence of k-lines is acquired from all the prescribed coronal slices in each TR. Each radial line is assigned to a respiratory bin based on its nearest navigator signal. If required, the spatial resolution can be further improved by interpolation. It is also possible to use an intrinsic signal from the DC point of the k-space lines for respiratory gating purposes.57 However, a navigator is used in this work because it is less prone to corrupting factors such as noise, scanner gradient delay, field changes etc.
FIG. 2.
GRANGE: A slice-interleaved golden-angle radial gradient echo pulse sequence with slice-projection navigator encapsulation.
2.C.2. Golden-angle phase encoding
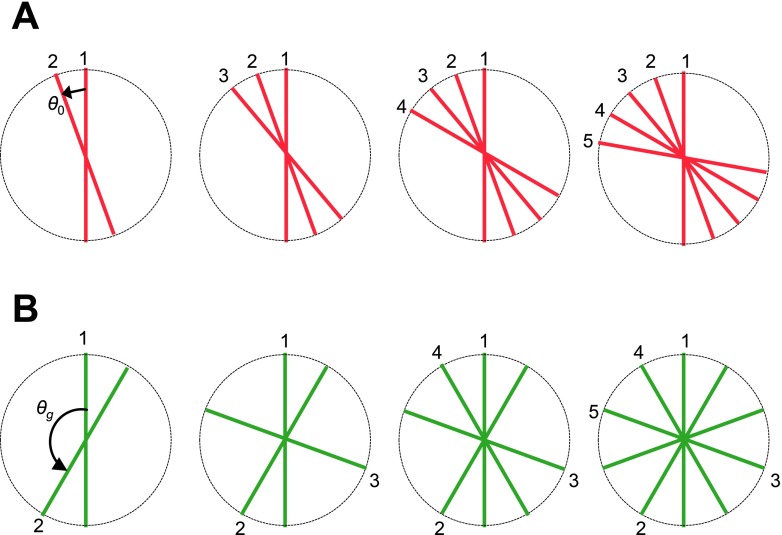
From one TR to the next, the radial k-lines are prescribed according to the golden angle formula: θk = mod(2.399 96k, 2π).58 As shown in Fig. 3, with phase encoding based on a fixed angular increment, a free breathing setting may lead to nonuniform and partial coverage of k-space. With golden-angle phase encoding, the coverage of k-space is more uniform even for an arbitrary number of k-lines, thereby imparting binning flexibility for gate assignment. We note that, while continuous golden-angle radial lines yield a more uniform distribution, the coverage might not be optimal when combining multiple respiratory cycles together.59,60 However, this approach is still superior to sequential acquisition.
FIG. 3.
Golden-angle coverage of k-space: (A) Phase encoding based on a fixed angular increment, θ0. The coverage of k-space is less uniform. A free breathing setting may lead to partial coverage of k-space. (B) Phase encoding based on the golden angle, θg. The coverage of k-space is more uniform for an arbitrary number of k-lines.
2.C.3. Iterative reconstruction
Binning of the k-lines into a larger number of gates causes progressive undersampling of k-space data per gate. Reconstruction using conventional filtered backprojection (FBP) leads to increasing levels of streaking artifacts as the number of gates is increased. Gridding reconstruction, another reconstruction algorithm widely used in radial MR reconstruction, suffers from a similar problem due to insufficient sampling. We adopted k-t space FOCal Underdetermined System Solver (k-t FOCUSS), a compressive sensing based reconstruction technique.61,62 This iterative method commences by finding a low-resolution estimate and then prunes this solution to a sparse signal representation. This method takes advantage of the spatiotemporal sparsity of the images to reconstruct cine MR images from undersampled data. Figure 4 shows reconstructed images for 6, 8, and 12 gates, which correspond to undersampling factors of 0.59, 0.79, and 1.18, respectively. As demonstrated in Fig. 4, this enables robust reconstruction even in the presence of undersampling (12 gates), thus preventing image degradation and suppressing artifacts when the number of gates increases.
FIG. 4.
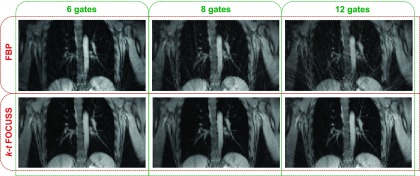
Comparison of reconstruction methods. Top row: Conventional FBP leads to increasing levels of streaking artifacts (from left to right) as the number of gates is increased (and the data per gate consequently reduced). Bottom row: k-t FOCUSS reconstruction prevents image degradation and suppresses artifacts when the number of gates increases. The undersampling factors for 6, 8, and 12 gates are 0.59, 0.79, and 1.18, respectively.
2.D. Gate assignment
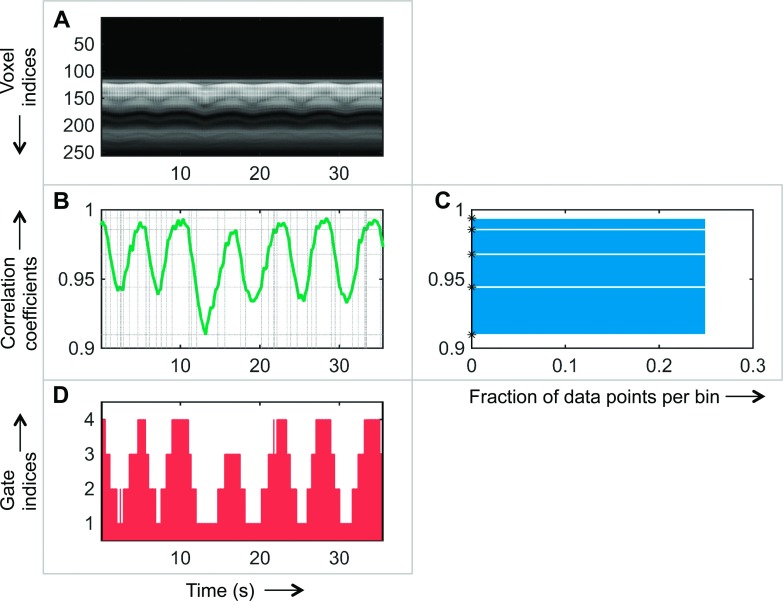
The binning of PET data into gates is usually either time-based or amplitude-based.7 Time-based methods define gate indices by dividing the respiratory signal into equal-sized temporal bins. In contrast, amplitude-based methods define equal-sized bins along the amplitude axis. Time-based gating techniques fail when the breathing patterns are not perfectly regular. Several studies have shown that amplitude-based methods are more robust against inter- and intracycle variability of respiratory signals than time-based approaches.7,63 However, traditional amplitude-based gating leads to varying numbers of event counts per gate. We have implemented a histogram-guided, amplitude-based gating strategy that incorporates information from MR navigator projections and assigns gate indices while ensuring that each gate has roughly the same amount of data. In comparison with traditional amplitude-based gating, where the gate assignment relies on equal-width amplitude bins, we use varying-width amplitude bins determined from histogram equalization. Figure 5 illustrates our gate assignment strategy. The navigator projections yield a set of 1D MR images along the superior–inferior direction, perpendicular to the diaphragm. Figure 5(A) shows a typical MR navigator image time series from a human. We extract a 1D correlation trace from this image as shown in Fig. 5(B) by computing Pearson’s correlation coefficients with respect to a reference time point. This 1D trace is treated as our respiratory signal. The points on this trace are then sorted according to the correlation magnitude and divided into a chosen number of bins, such that each bin contains the same number of discrete data points. Figure 5(C) shows the corresponding equalized histogram, where the x-axis represents the fraction of data points in each bin and the y-axis indicates the corresponding unequal bin widths for the correlation values. The upper and lower limits for each bin [indicated using asterisks on the y-axis of Fig. 5(C) and using horizontal dotted lines in Fig. 5(B)] are used to quantize the correlation values [y-axis of Fig. 5(B)] to discrete gate indices. The dotted vertical lines (corresponding to the time points where the correlation trace intersects the horizontal lines) segment the time axis into separate gates. The result is shown in Fig. 5(D), which shows the division of the data acquisition time scale into a set of discrete gates. Since the PET and MR scans are synchronous, time stamps derived from the raw data can be used to align the time scales for the two modalities. The gate indices in Fig. 5(D) can, therefore, be directly used to bin the PET events into individual gates.
FIG. 5.
Retrospective gate assignment. The x-axis for the first column represents time in seconds. The y-axis for the middle row represents the Pearson’s correlation coefficient. (A) Time series of 1D navigator images from a human subject. (B) Correlation trace derived from the navigator image series. The dotted horizontal lines represent the upper and lower bounds on the correlation that lead to an equalized histogram. The dotted vertical lines (corresponding to the time points where the correlation trace intersects the horizontal lines) segment the time axis into separate gates. (C) Equalized histogram of data points resulting from nonuniform binning of the correlation coefficients. The computed bounds for each bin are marked using asterisks on the y-axis. (D) Gate indices derived from the correlation trace assigned to each time segment.
2.E. Deformation field computation and attenuation correction
Non-rigid registration based on diffeomorphic demons is used to compute the deformation fields mapping the reference gate MR image to the other gates.64 In addition to being directly used by the MAP reconstruction module for PET image warping, the deformation fields are required for accurate attenuation correction of the PET images. Compton interactions with tissue scatter photons and diminish their energy leading to an attenuation effect which is accounted for in the data model in (1) as , a diagonal matrix containing survival probabilities representing the attenuation map. The attenuation correction factors for each gate are dependent on the phase of respiratory motion associated with that gate.65,66 It was been shown that the use of either an average or a static attenuation map leads to prominent attenuation artifacts.32,67,68 We therefore use dynamic attenuation maps. The Biograph mMR generates separate attenuation maps for the scanner hardware dependent component and the patient or object dependent component. For our experiments, the latter is generated by the scanner using an MR Dixon scan acquired in breath-hold mode at the end of exhalation followed by segmentation into four tissue classes (air, lung, fat, and nonfat soft tissue) and assignment of constant attenuation values to each class. This static attenuation map was first registered to the MR reference gate image. The deformation fields were then applied to this image to generate attenuation maps for the remaining gates.
2.F. Simulation and patient studies
The PET/MR MCIR framework was evaluated using a simulation study and three patient studies. For each study, we compared the performance of the OG, UG, and MC cases. The study designs and figures of merits used for quantitative assessment are described below.
2.F.1. Simulation study
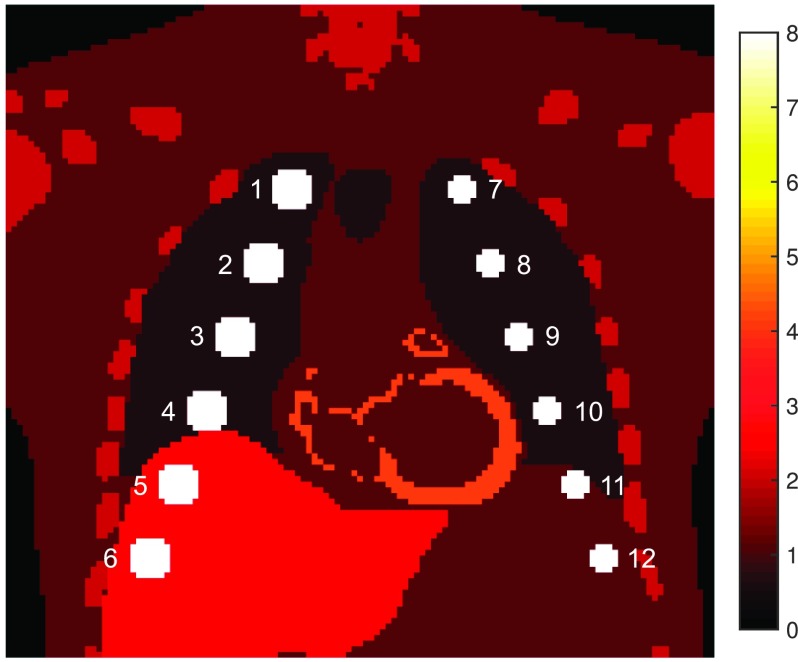
To validate the MAP MCIR framework for PET, we performed a simulation experiment using the 4D XCAT phantom, a spatiotemporal human torso phantom derived from CT datasets with cardiac and respiratory motion models obtained using 4D tagged MRI data and 4D high-resolution respiratory-gated CT data, respectively.69 12 spherical pulmonary lesions were added, with six lesions each of diameter 14 mm in the right lung and liver and six of diameter 10 mm in the left lung and upper left abdomen. Standardized uptake values (SUVs) were assigned to emulate typical [18F]FDG distributions: lungs 0.5, muscle 1, bones 2, liver 2.5, myocardium 4, and lesions 8 (all in units of g/ml). The resultant phantom is shown in Fig. 6. We simulated a 5 s breathing cycle divided into eight gates. Poisson deviates of the gated images were projected using the system model in (1) to generate 100 noisy sinograms mimicking realistic clinical count rates. Since the goal of the simulation study is to test the MAP reconstruction framework, we assumed an accurate system model. Intragate motion was therefore ignored in this setup.
FIG. 6.
Coronal slice from the XCAT phantom showing the assigned SUVs in g/ml and simulated lesions labeled 1–12 in the thorax and upper abdomen.
For smoothing regularizers such as the uniform quadratic penalty, regularization-imposed bias leads to loss of spatial resolution. In setting the MAP regularization parameter, we seek to ensure fair comparison of the OG, UG, and MC cases (both in terms of image quality and quantitation) by ensuring similar regularization-imposed bias and hence similar image resolution in corresponding voxels. This is achieved by setting consistent relative weights between the data-fit and regularization terms for the three cases. Any differences in the observed bias (e.g., bias due to motion artifacts) would be attributable to inaccuracies in the data model alone. For MC, we set the regularization parameter βMC to 103, 3 × 10³, 104, 3 × 10⁴, 105, 3 × 10⁵, and 106. For fair comparison of OG and UG with MC, we select the regularization parameters βOG and βUG to ensure similar relative weighting between the data-fit term and the prior relative to MC. The log likelihood for MC in (5) is based on counts from all the gates, while the prior corresponds to only the reference gate. In comparison, for OG, the counts in the log likelihood in (3) are reduced roughly by a factor of p, the number of gates, while the prior remains unchanged since the reconstructed image xOG has roughly the same number of counts as xMC. The regularization parameter for this case was set to βOG = βMC/p. For UG, the log likelihood is based on the same number of detected events as MC and is therefore comparable. But the counts in the unknown image xUG are greater by a factor of p. The regularization parameter for this case was also set to βUG = βMC/p.
2.F.2. Patient studies
To validate the overall data acquisition and processing framework, we conducted PET/MR clinical experiments on three patients. The subjects scanned were a 24 yr old male (P1), a 65 yr old female (P2), and a 62 yr old female (P3). PET list-mode data and GRANGE MR k-space data were simultaneously acquired on the Biograph mMR scanner. All procedures were performed following protocol and institutional standards with prior approval from the institutional review boards at Massachusetts General Hospital, Boston, MA, and SDN, Naples, Italy, the two data acquisition sites. The MR acquisition parameters in the studies were as follows: TR 3.3 ms/slice, bandwidth 1 kHz/pixel, readout oversampling factor of 2, and 256 samples per radial line. For P1, 24 coronal slices with a slice thickness 5 mm were used to cover the lung volume, and 4096 radial lines were acquired per slice. For P2 and P3, 24 and 26 coronal slices, respectively, with a slice thickness of 8 mm were used to cover the lung volume with 4000 radial lines per slice. The excitation angle was set to 30∘ based on the Ernst angle to provide higher SNR. A short-duration (∼3 ms) slice-projection navigator was inserted for every TR. The patients were injected with between 5 and 12.5 mCi [18F]FDG radiotracer. For P1, P2, and P3, PET list-mode data were acquired for 6, 7, and 7 min, respectively, simultaneously with the MR acquisition. The PET and MR data were processed following the steps described in Fig. 1. Gates were assigned by means of histogram equalization on correlation coefficients derived from the navigator projections. The PET list-mode events and MR k-lines were grouped into six amplitude-based gates per respiratory cycle. As our gating strategy does not distinguish between “wax” and “wane” phases of the respiratory cycle, these six gates therefore effectively represent 12 phases of motion per cycle. The binned k-space data were used to reconstruct gated MR images, from which the deformation fields were computed. The geometric component of the system matrix, Pgeom, for the Biograph mMR was computed by incorporating the block structure of the scanner and the gaps between the detector blocks. The point spread function of the scanner (in Pblur) was modeled using Monte Carlo simulations that accounted for blurring phenomena such as photon pair nonlinearity, intercrystal scatter, and crystal penetration as well as the block structure.70 The gated list-mode data were binned into span 11 sinograms of size 344 × 252 × 837. The gated sinograms and the deformation fields were used to perform MAP MCIR. The reconstructed image dimensions were 256 × 256 × 129 and the voxel size was 2.025 × 2.025 × 2.025 mm3. A set of 30 MAP iterations was used in each case.
2.F.3. Evaluation metrics
For the simulation study, in which the ground truth is known, we rely on the bias-variance trade-off for validating the MAP reconstruction framework and for testing the proposed strategy for regularization parameter tuning. Accordingly, we plot absolute bias vs standard deviation curves for the overall volume.71
As a figure of merit for both the simulation and clinical studies, we compute the contrast-to-noise ratio (CNR)72,73 of high-intensity features in the lungs as
| (6) |
Here, and σ represent the mean and standard deviation, respectively, of intensities in the region of interest (ROI) and the background muscle tissue (a region with relatively uniform tracer uptake).
We also compute the mutual information (MI) between the features of interest in the UG, OG, and MC PET images with the corresponding feature in the MR image for the reference gate. This metric is a measure of the similarity between the intensity distributions of the MR and PET images. Both noise-induced variations (as anticipated in the OG case) and motion-induced blurring (as anticipated in the UG case) tend to reduce this metric.
Overestimation of the volume of high-intensity features such as lesions is a well-known consequence of motion-induced blurring. We therefore compute the volume in ml for each feature of interest as another figure of merit for the clinical images. The volumetric mask is determined by using 50% of the peak intensity of the feature as a threshold.
3. RESULTS
3.A. Simulation results
The absolute bias and standard deviation images based on 100 noise realizations for each of the three cases with βMC = 3 × 10⁴, 105, and 3 × 10⁵ are shown in Fig. 7. The spatial averages of the bias and standard deviation for the three cases are tabulated in Table I. For each value of βMC, OG and MC show comparable bias (0%–10% difference) while OG exhibits increased standard deviation (658%–726% difference). The difference in standard deviation is as expected since the OG result is based on 1/8th the total counts. The UG and MC results exhibit similar variance behavior for each value of βMC (2%–5% difference). But the UG result shows a much stronger bias effect (16%–71% difference) manifesting as smearing artifacts caused by respiratory motion. This increase in bias is the result of the systematic error arising from not modeling the motion effects. The plot of the overall standard deviation against the overall absolute bias (computed as spatial averages) for all values of βMC is shown in Fig. 8(A).
FIG. 7.
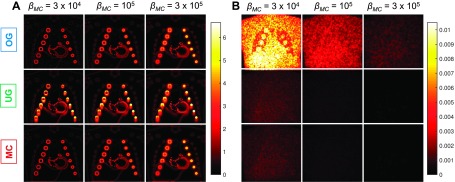
(A) Absolute bias and (B) standard deviation images for three different values of the MC regularization parameter, βMC = 3 × 10⁴, 105, and 3 × 10⁵. For the OG case, we set βOG = βMC/p and for the UG case, we set βUG = βMC/p to ensure similar relative weighting of the data-fit and regularization terms and hence similar levels of regularization-induced bias. For each value of βMC, the OG and MC cases have similar bias and the UG and MC cases have similar standard deviation. The OG standard deviation is much higher due to fewer emission events. The UG bias is high due to the inaccuracy in the data model, which does not account for motion effects.
TABLE I.
Bias and standard deviation comparison.
| βMC = 3 × 10⁴ | βMC = 105 | βMC = 106 | |||||
|---|---|---|---|---|---|---|---|
| Bias | Standard deviation | Bias | Standard deviation | Bias | Standard deviation | ||
| OG | Mean value, μOG | 2.41 × 10⁻¹ | 4.89 × 10⁻³ | 3.14 × 10⁻¹ | 1.81 × 10⁻³ | 3.97 × 10⁻¹ | 6.34 × 10⁻⁴ |
| (μOG − μMC)/μMC | 0.10 | 6.58 | 0.03 | 7.13 | 0.00 | 7.26 | |
| UG | Mean value, μUG | 3.75 × 10⁻¹ | 6.79 × 10⁻⁴ | 4.11 × 10⁻¹ | 2.30 × 10⁻⁴ | 4.59 × 10⁻¹ | 7.83 × 10⁻⁵ |
| (μUG − μMC)/μMC | 0.71 | 0.05 | 0.34 | 0.03 | 0.16 | 0.02 | |
| MC | Mean value, μMC | 2.19 × 10⁻¹ | 6.46 × 10⁻⁴ | 3.06 × 10⁻¹ | 2.23 × 10⁻⁴ | 3.96 × 10⁻¹ | 7.67 × 10⁻⁵ |
FIG. 8.
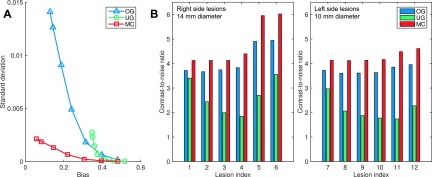
(A) Overall standard deviation vs overall absolute bias (computed as spatial averages) for different values of βMC. (B) CNR for the 14 mm diameter lesions 1 through 6 and the 10 mm diameters lesions 7 through 12 as illustrated in Fig. 6.
We treated the 12 lesions as the ROIs and muscle tissue as the background. The CNR comparison for βMC = 3 × 10⁴ is shown in Fig. 8(B). For the pulmonary lesions 1 through 4 and 7 through 10, the CNR improvement for MC relative to OG was in the range of 10%–15% without any clear pattern of dependence on location (and hence degree of deformation). In comparison, relative to UG, MC led to a consistent increase in CNR gain from the apex toward the base of the lungs. For the lesion pairs (1,7), (2,10), and (3,11), which undergo similar degrees of displacement and have similar background activity levels, the CNR gains for MC relative to UG were (21%,39%), (69%,100%), and (107%,120%), respectively. Thus the smaller lesions (7, 10, and 11) showed a larger margin of CNR gain than the larger lesions (1, 2, and 3). For the abdominal lesions (and also for lesion 4, located near the dome of the liver), the CNR values were influenced by the spill-in from the liver and abdominal tissue, which were assigned higher activity levels than the lungs.
3.B. Experimental results
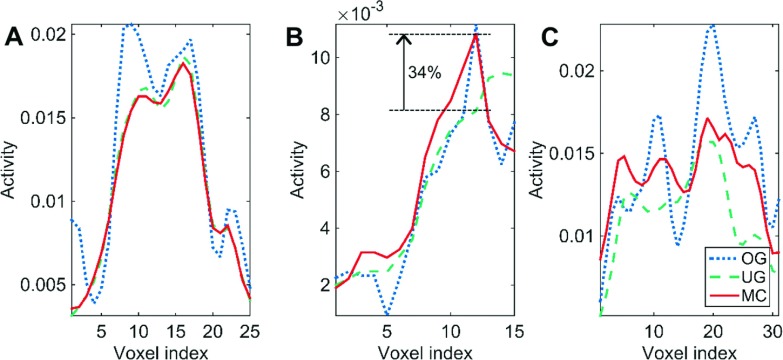
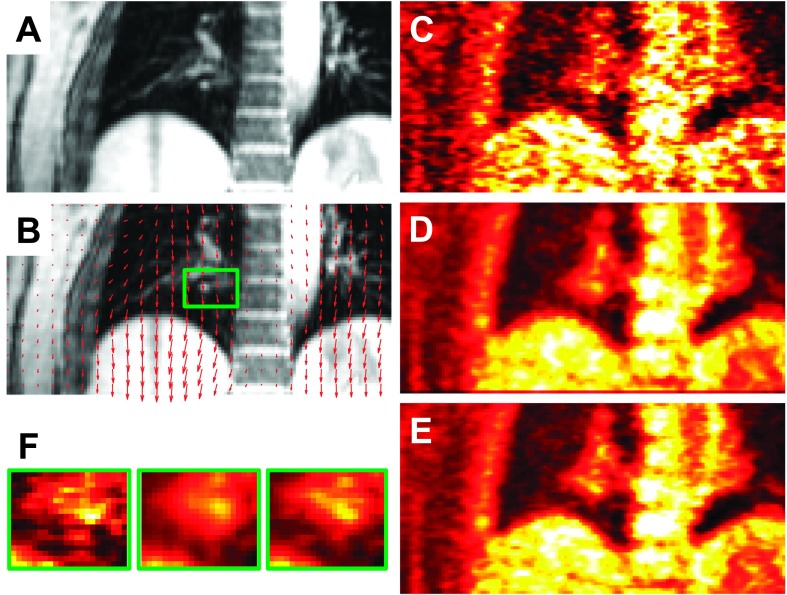
For MAP reconstruction of the patient data, the MC regularization parameter was set to βMC = 6. Since the data were binned into six gates, the regularization parameters for both the OG and UG cases were set to βOG = 1 and βUG = 1, respectively. Coronal slices from the MR and PET images of patient P1 are shown in Fig. 9. Figure 9(A) shows the GRANGE MR image corresponding to the reference gate while Fig. 9(B) shows an overlay of the deformation field mapping the reference gate (end-exhalation) to the end-inhalation gate on the MR image. Figs. 9(C)–9(E), show the OG, UG, and MC PET images, respectively. As expected, the OG image is noisier than the UG and MC images, because it uses only about 1/6th the total photon count. Magnification of a blood vessel located near the diaphragm, marked using a green box in Fig. 9(F), indicates motion-induced blurring in the UG image, an artifact that is significantly reduced in the MC image. Profiles along the blue lines in Fig. 9(B) marked a, b, and c are shown in Figs. 10(A)–10(C), respectively. The profile in Fig. 10(A) corresponds to a region with less movement. We observe good matching between the UG and MC profiles, while the OG profile shows sharper noise-induced variations. Figure 10(B) shows a profile across the blood vessel that exhibits clear motion effects. We observe roughly a 34% improvement in peak recovered activity in the MC image relative to UG. Figure 10(C) shows a profile across the dome of the liver, another key region affected by respiratory motion. Compared to the MC image profile, the UG profile here shows consistent underestimation of activity in all voxels, while the OG result shows more pronounced noise effects. Coronal slices from the MR and PET images of patients P2 and P3 are shown in Figs. 11 and 12, respectively. High-intensity features near the diaphragm (including a lung lesion in the case of P2) exhibiting distinctive motion blur patterns are magnified in Figs. 11(F) and 12(F).
FIG. 9.
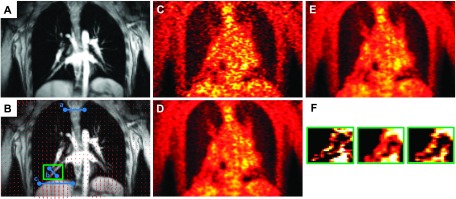
Coronal slices from reference (end-exhalation) gate images of patient P1: (A) GRANGE MR, (B) red arrows representing the deformation field overlaid on the MR and a feature of interest enclosed in a green box, (C) OG PET, (D) UG PET, (E) MC PET, and (F) magnified views of the feature of interest.
FIG. 10.
Comparison of line profiles for the OG, UG, and MC cases. (A) Profile along blue line a in Fig. 9(B). Profile (A) is across a region exhibiting negligible motion. (B) Profile along blue line b in Fig. 9(B) showing the intensity distribution across a moving blood vessel. MC leads to a 34% improvement in peak recovered activity in this high-intensity feature relative to UG. (C) Profile along blue line c in Fig. 9(B) across the dome of the liver. Profiles (B) and (C) are from regions close to the diaphragm undergoing noticeable movement caused by respiration.
FIG. 11.

Coronal slices from reference (end-exhalation) gate images of patient P2: (A) GRANGE MR, (B) red arrows representing the deformation field overlaid on the MR and a feature of interest enclosed in a green box, (C) OG PET, (D) UG PET, (E) MC PET, and (F) magnified views of the feature of interest.
FIG. 12.
Coronal slices from reference (end-exhalation) gate images of patient P3: (A) GRANGE MR, (B) red arrows representing the deformation field overlaid on the MR and a feature of interest enclosed in a green box, (C) OG PET, (D) UG PET, (E) MC PET, and (F) magnified views of the feature of interest.
We computed the volume, MI, and CNR for the features in Figs. 9(F), 11(F), and 12(F) to compare the OG, UG, and MC cases. These figures of merit are shown in Table II. Relative to OG, UG leads to an overestimation of feature volume by 11%–38%. In comparison, the overestimation for MC is 2%–19%. The overestimation of feature volume in the MC case is mainly attributable to inaccuracies in deformation fields, intragate motion, and interpolation errors. The OG and UG cases exhibit consistently lower MI with the reference gate MR image feature compared to the MC image. Although the OG image is morphologically the most similar to the reference gate MR image, it exhibits more fluctuations in intensity values due to noise effects, which very likely lead to a lower MI than the MC case. In the UG case, the lower MI can be attributed by the motion artifacts which impact the intensity distribution. For CNR computation, a uniform activity area of muscle tissue near the shoulder was treated as the background. Our results indicate that MC leads to a CNR improvement of 19%–196% relative to OG and 6%–51% relative to UG.
TABLE II.
Feature evaluation.
| Volume (ml) | MI | CNR | |||||||
|---|---|---|---|---|---|---|---|---|---|
| OG | UG | MC | OG | UG | MC | OG | UG | MC | |
| P1 | 0.66 | 0.91 | 0.79 | 5.58 | 5.57 | 5.74 | 1.70 | 3.33 | 5.04 |
| P2 | 0.44 | 0.49 | 0.45 | 5.50 | 5.52 | 5.55 | 1.88 | 1.91 | 2.24 |
| P3 | 1.45 | 1.90 | 1.73 | 5.27 | 5.41 | 5.43 | 2.47 | 4.07 | 4.34 |
4. DISCUSSION
We have presented a complete data acquisition and processing framework for pulmonary PET imaging. Standalone MR is not the traditionally preferred choice for pulmonary applications. However, given the unique capabilities of simultaneous PET/MR in correcting for voluntary or involuntary patient motion, MR-based motion correction is advantageous for pulmonary PET imaging, which is greatly affected by breathing motion. We presented GRANGE, a dedicated golden-angle radial gradient echo MR pulse sequence that can be used in conjunction with k-t FOCUSS reconstruction to generate high-quality 4D MR images under free-breathing condition. While 3D encoding is also implementable,74 the GRANGE sequence currently uses 2D encoding. Although we have not used parallel imaging in this work, the GRANGE technique can also be combined with parallel imaging.
Our PET reconstruction approach is based on MAP estimation with gradient ascent type optimization. Unlike unregularized reconstruction methods based on expectation maximization, our approach guarantees convergence. Additionally, it is feasible to derive closed form estimates of the resolution and variance of the MAP estimate for further statistical analysis.75–78 We have also proposed and validated a strategy for regularization parameter selection based on consistent relative weighting of the data-fit and regularizer terms for the OG, UG, and MC cases. In the absence of consistent weighting, corresponding voxels could have arbitrary resolution and variance properties, making both quantitative and qualitative comparison of the three cases less meaningful.
We presented a retrospective gating strategy that is guided by a slice-projection navigator encapsulated in the GRANGE sequence. This method ensures roughly equal distribution of PET and MR data across the gates. Patient breathing may vary substantially in course of an imaging scan. Our gate assignment technique does not rely on perfect periodicity of the respiratory signal and is therefore well-adapted to handle intercycle variability in breathing. While this gating method is capable of distinguishing between the “wax” and “wane” phases of each breathing cycle, we avoided it in this work for simplicity. Separating these phases in the gate assignment for future studies would ensure more robust performance in the presence of intracycle variability.
In our studies, we used the end-exhalation gate as the reference gate. Previous studies have shown that, in a typical breathing cycle, patients spend the longest amount of time in an end-expiration quiescent phase.36,79 Additionally, the scanner generated attenuation maps typically correspond to this phase. While our framework allows any gate to be used as the reference, the choice of end-exhalation as the reference reduces the overall susceptibility of the reconstruction result to errors in deformation field estimation and interpolation. During patient data acquisition, a spinal coil and a flexible surface coil were used on the mMR scanner. In our current reconstruction framework, the attenuation due to the spinal coil and the scanner bed is taken into account, while the attenuation of the surface coil is ignored. The errors caused by this coil are expected to be small as the coil is specially designed for this application. However, to reduce these errors and further improve accuracy, the attenuation of the flexible coil can be taken into account in the reconstruction by using markers to measure its location and shape.80
In the clinical experiment, the PET and the MR data were simultaneously acquired for 5.5 min. For future studies, it may be feasible to exploit the robustness of k-t FOCUSS reconstruction to further reduce the MR acquisition time to <3 min. The saved time can, for instance, be used to run different diagnostic MR sequences while the PET data are collected in the background. As long as the slice-projection navigator is embedded in the other MR sequences, it would be feasible to use the simultaneously acquired PET events for MCIR. Compared to higher dimensional navigator signals,81 the 1D slice-projection navigator is less accurate but faster. The latter characteristic makes it easily embeddable in MR sequences and hence a more practical choice for this application.
ACKNOWLEDGMENTS
This work was supported by the American Lung Association Senior Research Training Fellowship, the Society of Nuclear Medicine and Molecular Imaging Mitzi and William Blahd, MD, Pilot Research Grant, and NIH Grant Nos. 1R01EB013293, 1R01CA165221, and 1R01HL110241. The authors would like to thank clinicians at SDN, Naples, Italy for assistance with data acquisition.
REFERENCES
- 1.Nehmeh S.A., Erdi Y. E., Pan T., Pevsner A., Rosenzweig K. E., Yorke E., Mageras G. S., Schoder H., Vernon P., Squire O., Mostafavi H., Larson S. M., and Humm J. L., “Four-dimensional (4D) PET/CT imaging of the thorax,” Med. Phys. 31, 3179–3186 (2004). 10.1118/1.1809778 [DOI] [PubMed] [Google Scholar]
- 2.Nehmeh S. A., Erdi Y. E., Ling C. C., Rosenzweig K. E., Schoder H., Larson S. M., Macapinlac H. A., Squire O. D., and Humm J. L., “Effect of respiratory gating on quantifying PET images of lung cancer,” J. Nucl. Med. 43, 876–881 (2002). [PubMed] [Google Scholar]
- 3.Polycarpou I., Tsoumpas C., King A. P., and Marsden P. K., “Impact of respiratory motion correction and spatial resolution on lesion detection in PET: A simulation study based on real MR dynamic data,” Phys. Med. Biol. 59, 697–713 (2014). 10.1088/0031-9155/59/3/697 [DOI] [PubMed] [Google Scholar]
- 4.Lardinois D., Weder W., Hany T. F., Kamel E. M., Korom S., Seifert B., von Schulthess G. K., and Steinert H. C., “Staging of non–small-cell lung cancer with integrated positron-emission tomography and computed tomography,” N. Engl. J. Med. 348, 2500–2507 (2003). 10.1056/NEJMoa022136 [DOI] [PubMed] [Google Scholar]
- 5.Vansteenkiste J., Fischer B. M., Dooms C., and Mortensen J., “Positron-emission tomography in prognostic and therapeutic assessment of lung cancer: Systematic review,” Lancet Oncol. 5, 531–540 (2004). 10.1016/S1470-2045(04)01564-5 [DOI] [PubMed] [Google Scholar]
- 6.Otani Y., Fukuda I., Tsukamoto N., Kumazaki Y., Sekine H., Imabayashi E., Kawaguchi O., Nose T., Teshima T., and Dokiya T., “A comparison of the respiratory signals acquired by different respiratory monitoring systems used in respiratory gated radiotherapy,” Med. Phys. 37, 6178–6186 (2010). 10.1118/1.3512798 [DOI] [PubMed] [Google Scholar]
- 7.Dawood M., Büther F., Lang N., Schober O., and Schäfers K. P., “Respiratory gating in positron emission tomography: A quantitative comparison of different gating schemes,” Med. Phys. 34, 3067–3076 (2007). 10.1118/1.2748104 [DOI] [PubMed] [Google Scholar]
- 8.Nehmeh S. A. et al. , “Effect of respiratory gating on reducing lung motion artifacts in PET imaging of lung cancer,” Med. Phys. 29, 366–371 (2002). 10.1118/1.1448824 [DOI] [PubMed] [Google Scholar]
- 9.Fulton R., Nickel I., Tellmann L., Meikle S., Pietrzyk U., and Herzog H., “Event-by-event motion compensation in 3D PET,” in IEEE Nuclear Science Symposium Conference Record (IEEE, 2003), pp. 3286–3289. [Google Scholar]
- 10.Thielemans K., Mustafovic S., and Schnorr L., “Image reconstruction of motion corrected sinograms,” in IEEE Nuclear Science Symposium Conference Record (IEEE, 2003), pp. 2401–2406. [Google Scholar]
- 11.Livieratos L., Stegger L., Bloomfield P. M., Schafers K., Bailey D. L., and Camici P. G., “Rigid-body transformation of list-mode projection data for respiratory motion correction in cardiac PET,” Phys. Med. Biol. 50, 3313–3322 (2005). 10.1088/0031-9155/50/14/008 [DOI] [PubMed] [Google Scholar]
- 12.Lamare F., Cresson T., Savean J., Le Rest C. C., Reader A. J., and Visvikis D., “Respiratory motion correction for PET oncology applications using affine transformation of list mode data,” Phys. Med. Biol. 52, 121–140 (2007). 10.1088/0031-9155/52/1/009 [DOI] [PubMed] [Google Scholar]
- 13.Klein G. J., Reutter B. W., and Huesman R. H., “Non-rigid summing of gated PET via optical flow,” IEEE Trans. Nucl. Sci. 44, 1509–1512 (1997). 10.1109/23.632704 [DOI] [Google Scholar]
- 14.Dawood M., Buther F., Jiang X., and Schafers K. P., “Respiratory motion correction in 3-d PET data with advanced optical flow algorithms,” IEEE Trans. Med. Imaging 27, 1164–1175 (2008). 10.1109/TMI.2008.918321 [DOI] [PubMed] [Google Scholar]
- 15.Bai W. and Brady M., “Regularized B-spline deformable registration for respiratory motion correction in PET images,” Phys. Med. Biol. 54, 2719–4619 (2009). 10.1088/0031-9155/54/9/008 [DOI] [PubMed] [Google Scholar]
- 16.Qi J. and Huesman R. H., “List mode reconstruction for pet with motion compensation: A simulation study,” in Proceedings of IEEE International Symposium on Biomedical Imaging (IEEE, 2002), pp. 413–416. [Google Scholar]
- 17.Rahmim A., Bloomfield P., Houle S., Lenox M., Michel C., Buckley K. R., Ruth T. J., and Sossi V., “Motion compensation in histogram-mode and list-mode em reconstructions: Beyond the event-driven approach,” IEEE Trans. Nucl. Sci. 51, 2588–2596 (2004). 10.1109/TNS.2004.835763 [DOI] [Google Scholar]
- 18.Qiao F., Pan T., J. W. Clark, Jr., and Mawlawi O. R., “A motion-incorporated reconstruction method for gated PET studies,” Phys. Med. Biol. 51, 3769–3783 (2006). 10.1088/0031-9155/51/15/012 [DOI] [PubMed] [Google Scholar]
- 19.Li T., Thorndyke B., Schreibmann E., Yang Y., and Xing L., “Model-based image reconstruction for four-dimensional PET,” Med. Phys. 33, 1288–1298 (2006). 10.1118/1.2192581 [DOI] [PubMed] [Google Scholar]
- 20.Lamare F., Ledesma Carbayo M. J., Cresson T., Kontaxakis G., Santos A., Le Rest C. C., Reader A. J., and Visvikis D., “List-mode-based reconstruction for respiratory motion correction in PET using non-rigid body transformations,” Phys. Med. Biol. 52, 5187–5204 (2007). 10.1088/0031-9155/52/17/006 [DOI] [PubMed] [Google Scholar]
- 21.Gilland D. R., Mair B. A., Bowsher J. E., and Jaszczak R. J., “Simultaneous reconstruction and motion estimation for gated cardiac ECT,” IEEE Trans. Nucl. Sci. 49, 2344–2349 (2002). 10.1109/TNS.2002.803820 [DOI] [Google Scholar]
- 22.Jacobson M. W. and Fessier J. A., “Joint estimation of respiratory motion and activity in 4D PET using CT side information,” in Proceedings of IEEE International Symposium on Biomedical Imaging (IEEE, 2006), pp. 275–278. [Google Scholar]
- 23.Qiao F., Pan T., J. W. Clark, Jr., and Mawlawi O., “Joint model of motion and anatomy for PET image reconstruction,” Med. Phys. 34, 4626–4639 (2007). 10.1118/1.2804721 [DOI] [PubMed] [Google Scholar]
- 24.Fessler J. A., “Optimization transfer approach to joint registration/reconstruction for motion-compensated image reconstruction,” in Proceedings of IEEE International Symposium on Biomedical Imaging (IEEE, 2010), pp. 596–599. [Google Scholar]
- 25.Manjeshwar R., Tao X., Asma E., and Thielemans K., “Motion compensated image reconstruction of respiratory gated PET/CT,” in Proceedings of IEEE International Symposium on Biomedical Imaging (IEEE, 2006), pp. 674–677. [Google Scholar]
- 26.Thielemans K., Manjeshwar R. M., Tao X., and Asma E., “Lesion detectability in motion compensated image reconstruction of respiratory gated PET/CT,” in IEEE Nuclear Science Symposium Conference Record (IEEE, 2006), pp. 3278–3282. [Google Scholar]
- 27.Asma E., Manjeshwar R., and Thielemans K., “Theoretical comparison of motion correction techniques for PET image reconstruction,” in IEEE Nuclear Science Symposium Conference Record (IEEE, 2006), pp. 1762–1767. [Google Scholar]
- 28.Polycarpou I., Tsoumpas C., and Marsden P. K., “Analysis and comparison of two methods for motion correction in PET imaging,” Med. Phys. 39, 6474–6483 (2012). 10.1118/1.4754586 [DOI] [PubMed] [Google Scholar]
- 29.Tsoumpas C., Agarwal S., Marsden P. K., and King A. P., “Evaluation of two PET motion correction techniques for simultaneous real-time PET-MR acquisitions using an MR-derived motion model,” in IEEE Nuclear Science Symposium Conference Record (IEEE, 2012), pp. 2519–2522. [Google Scholar]
- 30.Fayad H. J., Lamare F., Le Rest C. C., Bettinardi V., and Visvikis D., “Generation of 4-dimensional CT images based on 4-dimensional PET–derived motion fields,” J. Nucl. Med. 54, 631–638 (2013). 10.2967/jnumed.112.110809 [DOI] [PubMed] [Google Scholar]
- 31.Erdi Y. E. et al. , “The CT motion quantitation of lung lesions and its impact on PET-measured SUVs,” J. Nucl. Med. 45, 1287–1292 (2004). [PubMed] [Google Scholar]
- 32.Pan T., Mawlawi O., Nehmeh S. A., Erdi Y. E., Luo D., Liu H. H., Castillo R., Mohan R., Liao Z., and Macapinlac H. A., “Attenuation correction of PET images with respiration-averaged CT images in PET/CT,” J. Nucl. Med. 46, 1481–1487 (2005). [PubMed] [Google Scholar]
- 33.Dutta J., El Fakhri G., Shao X., Lorsakul A., Guo N., and Li Q., “Feasibility of respiratory motion compensated reconstruction using 4D PET-derived deformation fields,” J. Nucl. Med. 55, 2106 (2014). [Google Scholar]
- 34.Mair B. A., Gilland D. R., and Sun J., “Estimation of images and nonrigid deformations in gated emission CT,” IEEE Trans. Med. Imaging 25, 1130–1144 (2006). 10.1109/TMI.2006.879323 [DOI] [PubMed] [Google Scholar]
- 35.Blackall J. M., Ahmad S., Miquel M. E., McClelland J. R., Landau D. B., and Hawkes D. J., “Mri-based measurements of respiratory motion variability and assessment of imaging strategies for radiotherapy planning,” Phys. Med. Biol. 51, 4147–4169 (2006). 10.1088/0031-9155/51/17/003 [DOI] [PubMed] [Google Scholar]
- 36.Liu C., Pierce II L. A., Alessio A. M., and Kinahan P. E., “The impact of respiratory motion on tumor quantification and delineation in static PET/CT imaging,” Phys. Med. Biol. 54, 7345–7362 (2009). 10.1088/0031-9155/54/24/007 [DOI] [PMC free article] [PubMed] [Google Scholar]
- 37.McClelland J. R., Hughes S., Modat M., Qureshi A., Ahmad S., Landau D. B., Ourselin S., and Hawkes D. J., “Inter-fraction variations in respiratory motion models,” Phys. Med. Biol. 56, 251–272 (2011). 10.1088/0031-9155/56/1/015 [DOI] [PubMed] [Google Scholar]
- 38.Tsoumpas C., Mackewn J. E., Halsted P., King A. P., Buerger C., Totman J. J., Schaeffter T., and Marsden P. K., “Simultaneous PET–MR acquisition and MR-derived motion fields for correction of non-rigid motion in PET,” Ann. Nucl. Med. 24, 745–750 (2010). 10.1007/s12149-010-0418-2 [DOI] [PubMed] [Google Scholar]
- 39.Guérin B., Cho S., Chun S. Y., Zhu X., Alpert N. M., Fakhri G. El, Reese T. G., and Catana C., “Nonrigid PET motion compensation in the lower abdomen using simultaneous tagged-MRI and PET imaging,” Med. Phys. 38, 3025–3038 (2011). 10.1118/1.3589136 [DOI] [PMC free article] [PubMed] [Google Scholar]
- 40.Chun S. Y., Reese T. G., Ouyang J., Guérin B., Zhu X., Catana C., Alpert N. M., and Fakhri G. El, “MRI-based nonrigid motion correction in simultaneous PET/MRI,” J. Nucl. Med. 53, 1284–1291 (2012). 10.2967/jnumed.111.092353 [DOI] [PMC free article] [PubMed] [Google Scholar]
- 41.Petibon Y., Ouyang J., Zhu X., Huang C., Reese T. G., Chun S. Y., Li Q., and El Fakhri G., “Cardiac motion compensation and resolution modeling in simultaneous PET-MR: A cardiac lesion detection study,” Phys. Med. Biol. 58, 2085–2102 (2013). 10.1088/0031-9155/58/7/2085 [DOI] [PMC free article] [PubMed] [Google Scholar]
- 42.Huang C., Ackerman J. L., Petibon Y., Normandin M. D., Brady T. J., El Fakhri G., and Ouyang J., “Motion compensation for brain PET imaging using wireless MR active markers in simultaneous PET–MR: Phantom and non-human primate studies,” NeuroImage 91, 129–137 (2014). 10.1016/j.neuroimage.2013.12.061 [DOI] [PMC free article] [PubMed] [Google Scholar]
- 43.Von Siebenthal M., Székely G., Gamper U., Boesiger P., Lomax A., and Cattin P., “4D MR imaging of respiratory organ motion and its variability,” Phys. Med. Biol. 52, 1547–1564 (2007). 10.1088/0031-9155/52/6/001 [DOI] [PubMed] [Google Scholar]
- 44.Dikaios N., Izquierdo-Garcia D., Graves M. J., Mani V., Fayad Z. A., and Fryer T. D., “MRI-based motion correction of thoracic PET: Initial comparison of acquisition protocols and correction strategies suitable for simultaneous PET/MRI systems,” Eur. Radiol. 22, 439–446 (2012). 10.1007/s00330-011-2274-4 [DOI] [PMC free article] [PubMed] [Google Scholar]
- 45.Kolbitsch C., Prieto C., Tsoumpas C., and Schaeffter T., “A 3D MR-acquisition scheme for nonrigid bulk motion correction in simultaneous PET-MR,” Med. Phys. 41, 082304 (14pp.) (2014). 10.1118/1.4890095 [DOI] [PubMed] [Google Scholar]
- 46.Feng T., Ahlman M., Tsui B. M. W., Guo L., Guttman M., McVeigh E., and Bluemke D., “Hybrid MR-guided and PET-guided motion correction of PET images in simultaneous PET/MR,” J. Nucl. Med. 55, 646 (2014). [Google Scholar]
- 47.Dutta J., El Fakhri G., Huang C., Petibon Y., Reese T. G., and Li Q., “Respiratory motion compensation in simultaneous PET/MR using a maximum a posteriori approach,” in Proceedings of IEEE International Symposium on Biomedical Imaging (IEEE, 2013), pp. 800–803. [Google Scholar]
- 48.Huang C., Dutta J., Petibon Y., Reese T. G., Li Q., and Fakhri G. El, “A novel golden-angle radial FLASH motion-estimation sequence for simultaneous thoracic PET-MR,” in Proceedings of the International Society for Magnetic Resonance in Medicine (2012), Vol. 21, p. 2462. [Google Scholar]
- 49.Würslin C., Schmidt H., Martirosian P., Brendle C., Boss A., Schwenzer N. F., and Stegger L., “Respiratory motion correction in oncologic PET using T1-weighted MR imaging on a simultaneous whole-body PET/MR system,” J. Nucl. Med. 54, 464–471 (2013). 10.2967/jnumed.112.105296 [DOI] [PubMed] [Google Scholar]
- 50.Grimm R., Fürst S., Dregely I., Forman C., Hutter J. M., Ziegler S. I., Nekolla S., Kiefer B., Schwaiger M., and Hornegger J., “Self-gated radial MRI for respiratory motion compensation on hybrid PET/MR systems,” inMedical Image Computing and Computer-Assisted Intervention–MICCAI, Lecture Notes in Computer Science Vol. 8151 (Springer, 2013), pp. 17–24. [DOI] [PubMed] [Google Scholar]
- 51.Tsoumpas C., Polycarpou I., Thielemans K., Buerger C., King A. P., Schaeffter T., and Marsden P. K., “The effect of regularization in motion compensated PET image reconstruction: A realistic numerical 4D simulation study,” Phys. Med. Biol. 58, 1759–1773 (2013). 10.1088/0031-9155/58/6/1759 [DOI] [PubMed] [Google Scholar]
- 52.Lange K., “Convergence of EM image reconstruction algorithms with Gibbs smoothing,” IEEE Trans. Med. Imaging 9, 439–446 (1990). 10.1109/42.61759 [DOI] [PubMed] [Google Scholar]
- 53.Leahy R. M. and Qi J., “Statistical approaches in quantitative positron emission tomography,” Stat. Comput. 10, 147–165 (2000). 10.1023/A:1008946426658 [DOI] [Google Scholar]
- 54.Qi J. and Leahy R. M., “A theoretical study of the contrast recovery and variance of MAP reconstructions from PET data,” IEEE Trans. Med. Imaging 18, 293–305 (1999). 10.1109/42.768839 [DOI] [PubMed] [Google Scholar]
- 55.Kauczor H., MRI of the Lung (Springer-Verlag, Berlin, Heidelberg, 2009). [Google Scholar]
- 56.Ehman R. L. and Felmlee J. P., “Adaptive technique for high-definition MR imaging of moving structures,” Radiology 173, 255–263 (1989). 10.1148/radiology.173.1.2781017 [DOI] [PubMed] [Google Scholar]
- 57.Feng L., Grimm R., Block K. T., Chandarana H., Kim S., Xu J., Axel L., Sodickson D. K., and Otazo R., “Golden-angle radial sparse parallel MRI: Combination of compressed sensing, parallel imaging, and golden-angle radial sampling for fast and flexible dynamic volumetric MRI,” Magn. Reson. Med. 72, 707–717 (2014). 10.1002/mrm.24980 [DOI] [PMC free article] [PubMed] [Google Scholar]
- 58.Winkelmann S., Schaeffter T., Koehler T., Eggers H., and Doessel O., “An optimal radial profile order based on the golden ratio for time-resolved MRI,” IEEE Trans. Med. Imaging 26, 68–76 (2007). 10.1109/TMI.2006.885337 [DOI] [PubMed] [Google Scholar]
- 59.Hansen M. S., Sørensen T. S., Arai A. E., and Kellman P., “Retrospective reconstruction of high temporal resolution cine images from real-time MRI using iterative motion correction,” Magn. Reson. Med. 68, 741–750 (2012). 10.1002/mrm.23284 [DOI] [PMC free article] [PubMed] [Google Scholar]
- 60.Usman M., Atkinson D., Odille F., Kolbitsch C., Vaillant G., Schaeffter T., Batchelor P. G., and Prieto C., “Motion corrected compressed sensing for free-breathing dynamic cardiac MRI,” Magn. Reson. Med. 70, 504–516 (2013). 10.1002/mrm.24463 [DOI] [PubMed] [Google Scholar]
- 61.Jung H., Ye J. C., and Kim E. Y., “Improved k-t BLAST and k-t SENSE using FOCUSS,” Phys. Med. Biol. 52, 3201–3226 (2007). 10.1088/0031-9155/52/11/018 [DOI] [PubMed] [Google Scholar]
- 62.Jung H., Sung K., Nayak K. S., Kim E. Y., and Ye J. C., “k-t FOCUSS: A general compressed sensing framework for high resolution dynamic MRI,” Magn. Reson. Med. 61, 103–116 (2009). 10.1002/mrm.21757 [DOI] [PubMed] [Google Scholar]
- 63.Wink N. M., Panknin C., and Solberg T. D., “Phase versus amplitude sorting of 4D-CT data,” J. Appl. Clin. Med. Phys. 7, 77–85 (2006). 10.1120/jacmp.2027.25373 [DOI] [PMC free article] [PubMed] [Google Scholar]
- 64.Kroon D. J. and Slump C. H., “MRI modalitiy transformation in demons registration,” inProceedings of IEEE International Symposium on Biomedical Imaging (IEEE, 2009), pp. 963–966. [Google Scholar]
- 65.Ouyang J., Chun S. Y., Petibon Y., Bonab A. A., Alpert N., and El Fakhri G., “Bias atlases for segmentation-based PET attenuation correction using PET-CT and MR,” IEEE Trans. Nucl. Sci. 60, 3373–3382 (2013). 10.1109/tns.2013.2278624 [DOI] [PMC free article] [PubMed] [Google Scholar]
- 66.Buerger C., Aitken A., Tsoumpas C., King A. P., Schulz V., Marsden P., and Schaeffter T., “Investigation of 4D PET attenuation correction using ultra-short echo time MR,” in IEEE Nuclear Science Symposium Conference Record (IEEE, 2011), pp. 3558–3561. [Google Scholar]
- 67.Osman M. M., Cohade C., Nakamoto Y., Marshall L. T., Leal J. P., and Wahl R. L., “Clinically significant inaccurate localization of lesions with PET/CT: Frequency in 300 patients,” J. Nucl. Med. 44, 240–243 (2003). [PubMed] [Google Scholar]
- 68.Alessio A. M., Kohlmyer S., Branch K., Chen G., Caldwell J., and Kinahan P., “Cine CT for attenuation correction in cardiac PET/CT,” J. Nucl. Med. 48, 794–801 (2007). 10.2967/jnumed.106.035717 [DOI] [PMC free article] [PubMed] [Google Scholar]
- 69.Segars W. P., Lalush D. S., and Tsui B. M. W., “Modeling respiratory mechanics in the MCAT and spline-based MCAT phantoms,” IEEE Trans. Nucl. Sci. 48, 89–97 (2001). 10.1109/23.910837 [DOI] [Google Scholar]
- 70.Li Q., Ouyang J., Petibon Y., Zhu X., Bai B., Leahy R. M., and El Fakhri G., “Maximum a posteriori reconstruction of biograph mMR scanner using point spread function,” J. Nucl. Med. 53, 2339 (2012). [Google Scholar]
- 71.Qi J. and Huesman R. H., “Theoretical study of penalized-likelihood image reconstruction for region of interest quantification,” IEEE Trans. Med. Imaging 25, 640–648 (2006). 10.1109/TMI.2006.873223 [DOI] [PubMed] [Google Scholar]
- 72.Foley W. D., Kneeland J. B., Cates J. D., Kellman G. M., Lawson T. L., Middleton W. D., and Hendrick R. E., “Contrast optimization for the detection of focal hepatic lesions by MR imaging at 1.5 T,” AJR, Am. J. Roentgenol. 149, 1155–1160 (1987). 10.2214/ajr.149.6.1155 [DOI] [PubMed] [Google Scholar]
- 73.Lartizien C., Kinahan P. E., and Comtat C., “A lesion detection observer study comparing 2-dimensional versus fully 3-dimensional whole-body PET imaging protocols,” J. Nucl. Med. 45, 714–723 (2004). [PubMed] [Google Scholar]
- 74.Mani V., Briley-Saebo K. C., Itskovich V. V., Samber D. D., and Fayad Z. A., “Gradient echo acquisition for superparamagnetic particles with positive contrast (GRASP): Sequence characterization in membrane and glass superparamagnetic iron oxide phantoms at 1.5T and 3T,” Magn. Reson. Med. 55, 126–135 (2006). 10.1002/mrm.20739 [DOI] [PubMed] [Google Scholar]
- 75.Qi J. and Leahy R. M., “Resolution and noise properties of MAP reconstruction for fully 3-D PET,” IEEE Trans. Med. Imaging 19, 493–506 (2000). 10.1109/42.870259 [DOI] [PubMed] [Google Scholar]
- 76.Chun S. Y. and Fessler J. A., “Spatial resolution properties of motion-compensated tomographic image reconstruction methods,” IEEE Trans. Med. Imaging 31, 1413–1425 (2012). 10.1109/TMI.2012.2192133 [DOI] [PMC free article] [PubMed] [Google Scholar]
- 77.Chun S. Y. and Fessler J. A., “Noise properties of motion-compensated tomographic image reconstruction methods,” IEEE Trans. Med. Imaging 32, 141–152 (2013). 10.1109/TMI.2012.2206604 [DOI] [PMC free article] [PubMed] [Google Scholar]
- 78.Dutta J., Ahn S., and Li Q., “Quantitative statistical methods for image quality assessment,” Theranostics 3, 741–756 (2013). 10.7150/thno.6815 [DOI] [PMC free article] [PubMed] [Google Scholar]
- 79.Liu C., Alessio A., Pierce L., Thielemans K., Wollenweber S., Ganin A., and Kinahan P., “Quiescent period respiratory gating for PET/CT,” Med. Phys. 37, 5037–5043 (2010). 10.1118/1.3480508 [DOI] [PMC free article] [PubMed] [Google Scholar]
- 80.Paulus D. H., Braun H., Aklan B., and Quick H. H., “Simultaneous PET/MR imaging: MR-based attenuation correction of local radiofrequency surface coils,” Med. Phys. 39, 4306–4315 (2012). 10.1118/1.4729716 [DOI] [PubMed] [Google Scholar]
- 81.King A. P., Buerger C., Tsoumpas C., Marsden P. K., and Schaeffter T., “Thoracic respiratory motion estimation from MRI using a statistical model and a 2-D image navigator,” Med. Image Anal. 16, 252–264 (2012). 10.1016/j.media.2011.08.003 [DOI] [PubMed] [Google Scholar]


