

Abstract
Fungi exhibit substantial morphological and genetic diversity, often associated with cryptic species differing in ecological niches. Penicillium roqueforti is used as a starter culture for blue-veined cheeses, being responsible for their flavor and color, but is also a common spoilage organism in various foods. Different types of blue-veined cheeses are manufactured and consumed worldwide, displaying specific organoleptic properties. These features may be due to the different manufacturing methods and/or to the specific P. roqueforti strains used. Substantial morphological diversity exists within P. roqueforti and, although not taxonomically valid, several technological names have been used for strains on different cheeses (e.g., P. gorgonzolae, P. stilton). A worldwide P. roqueforti collection from 120 individual blue-veined cheeses and 21 other substrates was analyzed here to determine (i) whether P. roqueforti is a complex of cryptic species, by applying the Genealogical Concordance Phylogenetic Species Recognition criterion (GC-PSR), (ii) whether the population structure assessed using microsatellite markers correspond to blue cheese types, and (iii) whether the genetic clusters display different morphologies. GC-PSR multi-locus sequence analyses showed no evidence of cryptic species. The population structure analysis using microsatellites revealed the existence of highly differentiated populations, corresponding to blue cheese types and with contrasted morphologies. This suggests that the population structure has been shaped by different cheese-making processes or that different populations were recruited for different cheese types. Cheese-making fungi thus constitute good models for studying fungal diversification under recent selection.
Introduction
Fungi display huge diversity with a widely accepted estimation of 1.62 M species [1]. However, as recognized by Hawksworth himself, this number is underestimated [2], mainly due to the inconspicuousness and simple morphologies of these organisms. Many unrecognized cryptic species exist, often differing in their ecological niches, and are therefore important to delimit [3]. Fungi used for cheese-making are particularly interesting to study under these aspects, as they may have recently diversified and specialized under human selection [4].
Cheese-making is an ancient process that has led to more than 1000 varieties of cheese known to date [5]. Earliest cheese-making evidence goes back to the sixth millennium BC, i.e., during the Neolithic era when organic residues preserved in pottery vessels were identified [6,7]. If, at that time, milk coagulation via lactic acid production was probably accidental, the use of rennet to coagulate milk was intentional. Cheese-making provided numerous advantages, including milk stabilization and storage, ease of transport, improvement of milk digestibility and was presumably a means to diversify the human diet [8]. Within the huge cheese diversity, blue-veined cheeses are manufactured from different milks and consumed in numerous countries. Each blue cheese type originates from a specific manufacturing process and exhibits distinctive characteristics. The best-known blue cheeses worldwide are, in the order of their first recorded date in the literature, Italian Gorgonzola (879), French Roquefort (1070), English Stilton (1785) [8] and Danish Danablu (1870s) [9], but their production is thought to be much older [10]. Specific cheese manufacturing recipes have often been secretly passed on to succeeding generations within limited geographical regions, hence explaining the localized production of certain varieties. Some blue cheeses have obtained a Protected Designation of Origin (PDO) or Protected Geographical Indication (PGI) status. For example, Roquefort cheese, the oldest cheese type with a Designation of Origin (1925), has the distinctive feature to be ripened at least 3 months, including 2 weeks in natural cellars located in Roquefort-sur-Soulzon. From an economic point of view, 18,812 tons of Roquefort cheese were produced in 2013 for a total of 56,847 tons of blue cheese, representing one third of France’s total blue cheese production [11].
Various manufacturing methods exist, but all of them involve the use of the well-known mold P. roqueforti, whose presence and growth largely contribute to the typical aspect and flavor of blue cheeses. During cheese-making, P. roqueforti conidia may be directly added to milk, sprayed on curd or naturally colonize cheese. P. roqueforti is not exclusively found in dairy environments but also occurs in natural environments (forest soil and wood), as well as in silage, and is a common spoilage agent in refrigerated stored foods, meats or wheat products [12,13]. This is due to its ability to grow under harsh conditions such as low temperatures, low oxygen levels, high carbon dioxide concentrations and/or its resistance to organic acids and weak acid preservatives [14]. Taxonomically, P. roqueforti, genus Penicillium Link, subgenus Penicillium and species roqueforti Thom [12], is currently recognized as a single species, although substantial morphological differences have been reported among strains. This diversity has led to numerous distinct “technological” species names such as P. glaucum, P. stilton, P. gorgonzolae or P. aromaticum. The valid species name is currently P. roqueforti [15], but the great diversity in morphology as well as in ecological niches raises the question of the existence of cryptic species. Indeed, a previous study using 11 microsatellite markers identified genetically differentiated populations [16], with reduced gene flow between genetic clusters despite recombination footprints within populations, thus possibly constituting distinct species. Noteworthy, one of the genetic clusters included all strains isolated from other environments than dairy as well as some cheese strains, while all other clusters only encompassed cheese strains [16].
In the present study, a large P. roqueforti collection containing 164 isolates from various cheeses worldwide, as well as from other substrates, was used in order to test whether cryptic species can be detected within P. roqueforti using the gold standard of species criterion in fungi, the Genealogical Concordance—Phylogenetic Species Recognition criterion (GC-PSR) [3,17–19]. Distinct species are recognized by the congruence between multiple gene genealogies, because recombination leads to their incongruence. The GC-PSR criterion thus only applies to sexual species. P. roqueforti has recently been shown to be able to undergo sex and recombination footprints and indirect evidence of recent sex in populations have been observed [16,20]. The GC-PSR criterion is however conservative: it will not distinguish recently derived species in which coalescence of alleles is not achieved yet [17,21–23]. Therefore, more rapidly evolving markers (microsatellites) were also developed, using the recently published genome sequence of P. roqueforti FM164 [4]. Furthermore, the morphological variability in our P. roqueforti collection was assessed. The goal of this study was to assess whether different cheese-making processes have used or generated different genotypes or cryptic species within P. roqueforti.
Materials and Methods
Penicillium roqueforti collection
A P. roqueforti collection was established by isolating strains from 120 individual blue-veined cheeses (of either artisanal or commercial origin), collected from 18 different countries worldwide (Argentina, Brazil, Canada, Czech Republic, Denmark, Finland, France, Germany, Ireland, Italy, Latvia, The Netherlands, New Zealand, Poland, Spain, Switzerland, United-Kingdom and the USA). Information about the cheeses sampled is given in S1 Table. For each cheese, six samples were plated in order to obtain six distinct isolates per cheese. The characterization of each isolate was performed using morphological and ß-tubulin partial gene sequence as described below. For each sampled cheese, a single isolate representative of each morphological type observed was eventually kept in the working collection. In total, 164 P. roqueforti isolates were available for this study including 27 P. roqueforti isolates from 21 different non-cheese substrates (silage, fruit, bread, meat, human sputum and cork) obtained from culture collections. In addition, 14 strains belonging to other terverticillate Penicillium species were used in order to assess relationships within the section Roquefortorum (S2 Table).
Morphological observations and statistical analyses
Macroscopic colony morphology (color obverse; texture; diameter and margin) of the 164 isolates were observed on PDA medium (Potato Dextrose Agar, Difco, Becton Dickinson and Company) after 7 days incubation at 25°C. Color obverses were assigned to each isolate using the Munsell Soil Color Charts [24]. Three sub-cultures on Potato Dextrose Agar (PDA) (25°C) and also on Czapek Yeast Extract Agar (CYA) (5°C, 25°C & 37°C), Glycerol Nitrate Agar (G25N) (25°C) and Malt Extract Agar (MEA) (25°C) media for 7 days as described by Pitt [25], were done for the most distinguishable morphological types. Regarding macroscopic morphology, reproducibility was checked using three sub-cultures of a subset of 36 isolates. Statistical tests on morphologies were performed using JMP version 7 [26]. Microscopic morphology was also investigated by observing specimens sampled from the subcultures on MEA medium.
DNA extraction, amplification and sequencing
Genomic DNA was extracted from fresh mycelium for each isolate after 5–7 days growth on M2Lev (20 g.L-1 malt extract, 3 g.L-1 yeast extract and 15 g.L-1 agar) using the FastDNA SPIN Kit (MP Biomedicals, Illkirch, France) according to the manufacturer’s instructions. Stock solutions (100 ng.μL-1) were prepared for PCR experiments and all DNA samples were conserved at -20°C.
Partial amplification of the β-tubulin gene, using the Bt2a and Bt2b primers [27], was performed on all 164 isolates to ensure that they belonged to the P. roqueforti species [28]. In addition to partial β-tubulin gene sequences, ten other DNA fragments were sequenced for 24 selected isolates based on multiple criteria (geographical origin, morphotype and random amplified polymorphism DNA (RAPD) analysis), in order to detect the most polymorphic loci. These regions corresponded to the rDNA ITS (including 5.8S rDNA gene) [29], partial 18S [30,31] and 28S [32,33] nuclear ribosomal DNA genes, partial rpb1 gene encoding the largest subunit of the RNA polymerase II (RPB1) [34], partial rpb2 gene encoding the second largest subunit of RNA polymerase II (RPB2) [35], partial translation elongation factor 1 alpha gene (EF-1α) [36], partial mcm7 gene encoding a mini-chromosome maintenance complex component 7 (MCM7) protein required for DNA replication, initiation and cell proliferation [37], partial tsr1 gene encoding for 20S pre-rRNA accumulation during ribosome biogenesis [38,39], partial cct8 gene encoding a subunit of the cytolosic chaperonin Cct ring complex, related to Tcp1p and required for the assembly of actin and tubulins in vivo [40,41] and partial calmodulin gene [42]. After this preliminary study, five fragments were chosen as the most polymorphic (ß-tub, cmd, cct8, tsr1 and mcm7) for further analyses. Information about the loci and primers used are summarized in (Table 1).
Table 1. Information about loci and primers used in the present study for Genealogical Concordance—Phylogenetic Species Recognition (GC-PSR) analysis.
| Locus | Primer | Sequence (5’– 3’) | Tm (°C) | Fragment size (bp) | Reference |
|---|---|---|---|---|---|
| β-tubulin | Bt2a | GGTAACCAAATCGGTGCTGCTTTC | 70.0 | 440–50 | [27] |
| Bt2b | ACCCTCAGTGTAGTGACCCTTGGC | 70.3 | |||
| cmd | Cmd5 | CCGAGTACAAGGAGGCCTTC | 64.9 | 510–520 | [42] |
| Cmd6 | CCGATAGAGGTCATAACGTGG | 63.2 | |||
| CF4 | TTTYTGCATCATRAGYTGGAC | 57.0 | 720–730 | [36] | |
| CF1D | CAGGTCTCCGAGTACAAG | 55.6 | |||
| mcm7 | Mcm7-709for | ACIMGIGTITCVGAYGTHAARCC | 70.2 | 610–620 | [43] |
| Mcm7-1348rev | GAYTTDGCIACICCIGGRTCWCCCAT | 69.1 | |||
| tsr1 | Tsr1-F1526 | GARTAYCCBCARTCNGAIATGT | 55.1 | 810–820 | [44] |
| Tsr1-R2434 | ASAGYTGVARDGCCTTRAACCA | 55.0 | |||
| cct8 | Cct8-F94 | CGCAACAAGATYGTBATYAACCA | 49.5 | 1300–1310 | [44] |
| Cct8-R1595 | RTCMACRCCNGTIGTCCAGTA | 54.2 | |||
| Proq845 | Proq845for | AACTTGCTTACCACTCGGCG | 66.3 | 980–990 | This study |
| Proq845rev | CTCGTTGGCAATACTGCTGG | 65.6 | |||
| Proq235 | Proq235for | CAACAACCTCGGGTGCTTTG | 67.7 | 940–950 | This study |
| Proq235rev | TTGTGTGTCAAGACCCGGAC | 66.2 | |||
| Proq631 | Proq631for | GGGGATGTCAGGTGGGTTTT | 67.0 | 1060–1070 | This study |
| Proq631rev | GGGCTCAAAGATGCGAAACG | 68.9 |
The five chosen fragments were amplified by PCR from total DNA extracts of 145 P. roqueforti isolates (the remaining 19 P. roqueforti isolates were obtained too late to be used for GC-PSR) as well as 14 strains belonging to other Penicillium species in order to assess relationships within the section Roquefortorum. Penicillium paneum isolate CBS 303.97 was used to root the trees. The PCR mixture included molecular biology grade water, PCR buffer (1X), 200 mM dNTPs, 2 mM MgCl2, 0.2 mM of each primer, 0.5 U of GoTaq DNA polymerase (Promega, Madison, USA), and 100 ng of genomic DNA template. Amplifications were performed using a peqSTAR 2X Gradient Thermocycler (PEQLAB Biotechnologie GMBH, Erlangen, Germany) using the programs detailed in S3 Table.
Further genomic regions with high levels of DNA polymorphism were searched for by comparing the genome sequences of four P. roqueforti strains (unpublished data, courtesy of the ANR FoodMicrobiome Project), as well as the FM164 genome sequence [4]. Three genomic regions (ca. 1000 bp, Proq845, Proq235, Proq631) located on three different scaffolds were selected using DnaSP version 5.10.01 [45]. Proq845 included a putative partial gene sequence region encoding a hypothetical protein. Proq235 was composed of two putative gene regions including conserved domains for a peptidase M24 enzyme and an endonuclease/exonuclease/phosphatase. Proq631 was found within a putative gene encoding a cytochrome P450 conserved domain. For each genomic region, primers were designed using Primer3web version 4.0.0 [46,47] (http://primer3.ut.ee/). Information about the primers used is shown in Table 1. Thirty isolates were used to amplify by PCR the Proq845, Proq235 and Proq631 loci using the same PCR mixture as described above. These 30 isolates included: (i) isolates representative of the diversity according to five gene sequences (ß-tub, cmd, cct8, tsr1 and mcm7) and microsatellite markers, as well as (ii) isolates belonging to each of the six observed clusters in the previous study [16]. The PCR program used is detailed in S3 Table.
PCR products were sequenced using both their forward and reverse primers at the ‘Plateforme Biogenouest’ (Roscoff, France) using the dye-terminator technology. Sequence assembly was carried out with Bionumerics version 6.6 (Applied Maths, Belgium) and contigs were manually edited using Mesquite version 2.75 [48]. Sequences corresponding to the eight loci chosen for multilocus analysis (ß-tub, cmd, cct8, tsr1, mcm7, Proq845, Proq235 and Proq631) were deposited in GenBank (see accession numbers in S4 Table. Sequence alignments were deposited in TreeBase (http://purl.org/phylo/treebase/phylows/study/TB2:S16359).
Phylogenetic analysis
The nucleotide sequences for the eight selected loci (ß-tub, cmd, cct8, tsr1 and mcm7, Proq845, Proq235 and Proq631) were aligned using MAFFT online version 7 (G-INS-I strategy) [49] (http://mafft.cbrc.jp/alignment/server/).
For both Maximum Likelihood (ML) and Bayesian analyses, Jmodeltest version 2.1.4 [50,51] was used to determine the best-fit model of evolution for each dataset, namely: TIM2ef model for β-tub, TrN+G model for cct8, TIM1ef+G model for cmd the, K80 model for mcm7, TrN model for tsr1, TrN model for Proq235 locus, TPM3+I model for Proq631 locus and TIM1 model for Proq845 locus.
Maximum parsimony (MP), ML and Bayesian analyses were performed excluding redundant sequences shared by several isolates, using PAUP version 4.0b10 [52] for MP and ML and MrBayes version 3.2.2 [53,54] for Bayesian analyses. Branch supports for all MP analyses were estimated by performing 1000 bootstrap replicates with a heuristic search consisting of 100 stepwise random addition replicates and tree bisection-reconnection (TBR) branch-swapping for each bootstrap replicate. Because P. paneum has been previously shown to form a phylogenetically close, well-supported clade, distinct from P. roqueforti [28], sequences obtained from P. paneum CBS 303.97 were used to root the ß-tub, cmd, cct8, tsr1 and mcm7 phylogenies.
ML analyses were performed with 100 stepwise random addition replicates and TBR branch-swapping using the best-fit model. Constant characters were included and ambiguously aligned characters were excluded from all analyses. Bayesian analyses employing a Markov Chain Monte Carlo (MCMC) method were performed using MrBayes version 3.2.2 [53,54] on constant characters. Four MCMC chains were run simultaneously for 10,000,000 generations with trees saved every 100th generation resulting in 100,000 total trees. The first 25,000 trees, which extended well beyond the burn-in phase of each analysis, were discarded. Posterior probabilities were determined from a consensus tree generated with the remaining 75,000 trees. MCMC convergence of our analyses was checked by using the Cumulative, Slide, and Compare analyses as implemented in AWTY [55].
Incongruence Length Difference tests were performed (ILD, [56] as implemented in PAUP version 4.0b10 (hompart option)).
Phylogenetic trees were visualized and edited with FigTree version 1.4.1 (http://tree.bio.ed.ac.uk/software/figtree/). A cluster network consensus tree was obtained using Dendroscope version 3.2.10 [57,58] from the three Bayesian trees generated for Proq845, Proq235 and Proq631 loci in order to visualize incongruences among these trees.
Microsatellite markers development and analyses
Microsatellite motifs were searched within the P. roqueforti FM164 strain genome sequence [4] using SciRoKo version 3.4 [59] using the “Perfect (Total length)” search mode. Based on recommendations by Sweet et al. [60], search parameters included a minimum repeat number of microsatellite motifs of 3 (trinucleotide) and a minimum total length of 24 per microsatellite. For each detected microsatellite region (n = 24), flanking sequences were extracted with SciRoKo version 3.4, primers were designed with QDD 2.1 [61] from PIPE3 (Table 2) and tested on 8 isolates (F15-3, F20-1, F33-1, F41-4, F51, F53, F61-6 and CBS 221.30T) selected on the basis of their morphotypes and/or geographical origin. Microsatellite regions were amplified by PCR on the 164 isolates of the working collection using the same PCR mixture as described above. The PCR program used is detailed in S3 Table. Each PCR product was sequenced as previously described. For population analyses, four markers were selected (Proq16, Proq17, Proq01_3, Proq02_2). The microsatellite markers were designed independently and concomitantly from those used in the study by Ropars et al. [16] which explains why they do not overlap and why they were not used here.
Table 2. Primers used in the present study for microsatellite markers amplification and sequencing.
| Locus | Primer | Sequence (5’– 3’) | Tm(°C) |
|---|---|---|---|
| Proq01 | Proq01_Fwd | AAGCGTCGCAGATCTAATGC | 64.3 |
| Proq01_Rev | GACAGACCCTCGATGTTTGC | 64.7 | |
| Proq01_2 | Proq01_2_Fwd | ACTGTGAAACGAGCCTCCTG | 64.4 |
| Proq01_2_Rev | ACACCATTGCCATCCATACC | 64.4 | |
| Proq01_3 | Proq01_3_Fwd | TGTGTACTCCACAGCGGCTA | 64.5 |
| Proq01_3_Rev | TTGTCTTTCGGGTGTCCAAT | 64.3 | |
| Proq02 | Proq02_Fwd | GCCGAAGAAGGAGCTGATCT | 64.8 |
| Proq02_Rev | GAGGACGGAACGATTCTCAA | 64.1 | |
| Proq02_2 | Proq02_2_Fwd | CCACTGTTAGAATCGCTGGG | 64.5 |
| Proq02_2_Rev | CGTGAACGTGGAGTTGACTG | 64.5 | |
| Proq03 | Proq03_Fwd | AACCAGTCGATCTGTTCCCA | 64.5 |
| Proq03_Rev | ATTTGCAATATGCTGGGTCG | 64.6 | |
| Proq03_2 | Proq03_2_Fwd | TAGAACACAAGGCATTGGCA | 64.2 |
| Proq03_2_Rev | TCCAAATGAAGCGGGAAGTA | 64.3 | |
| Proq03_3 | Proq03_3_Fwd | GGGACTTCCTTGGCGTATCT | 64.2 |
| Proq03_3_Rev | ATGGATGATTCTACGCCTCG | 63.9 | |
| Proq04 | Proq04_Fwd | TGAAGGTTATTGAAGAAAGACCG | 63.0 |
| Proq04_Rev | CAAATCTCGCCCACCAAAC | 65.4 | |
| Proq04_2 | Proq04_2_Fwd | CGTTGGATAACCACTACGCA | 63.5 |
| Proq04_2_Rev | CGATCGAATCCCATTTCACT | 63.7 | |
| Proq04_3 | Proq04_3_Fwd | ATGGTGGGTGCAGGGATT | 65.4 |
| Proq04_3_Rev | CACCGTCAGCACTACCATTG | 64.2 | |
| Proq05 | Proq05_Fwd | TCCCTGCCGTCTGATAGTTC | 64.2 |
| Proq05_Rev | AAGGTGCTGTGGACTGGTTC | 64.2 | |
| Proq07 | Proq07_Fwd | AAAGTCTGGATGTGAGGGCA | 64.7 |
| Proq07_Rev | GATCTCTTGGTTGGAATGCG | 64.5 | |
| Proq07_2 | Proq07_2_Fwd | CCATGAACTGCCTTACGCTT | 64.0 |
| Proq07_2_Rev | ATCGCGGTTGCTCTATTTGA | 64.5 | |
| Proq07_3 | Proq07_3_Fwd | CCATGAACTGCCTTACGCTT | 64.0 |
| Proq07_3_Rev | ATCGCGGTTGCTCTATTTGA | 64.5 | |
| Proq09 | Proq09_Fwd | TCCGTTCAGGAACTGTCGAT | 64.7 |
| Proq09_Rev | TCCATGGCAGTTGCTTCTTT | 64.6 | |
| Proq10 | Proq10_Fwd | GCCTTGAGTTGTAACCAATCCTTT | 65.1 |
| Proq10_Rev | TCCTAGATGTTCCCGATTGGT | 64.4 | |
| Proq10_2 | Proq10_2_Fwd | GCCTCCCAGTTCATGACAAC | 64.6 |
| Proq10_2_Rev | CTGCCGAAACTGCTTGCTAT | 64.3 | |
| Proq11 | Proq11_Fwd | ACACCCAATCACTACGACGG | 64.8 |
| Proq11_Rev | TGAAGTGAGGACCTTTGGGA | 64.6 | |
| Proq14 | Proq14_Fwd | TCTTCGCATAGGGAGTTGGA | 64.6 |
| Proq14_Rev | TGGTAGAATACCGTTCCCGA | 64.1 | |
| Proq16 | Proq16_Fwd | TTGAGGATTTCCGGAGACAA | 64.5 |
| Proq16_Rev | ATGCGCAATAAGACCCAAGA | 64.4 | |
| Proq17 | Proq17_Fwd | TATCGTCCGCACTAAGGGAA | 64.3 |
| Proq17_Rev | TGCTTCATTTCCGAAGGTGT | 64.5 | |
| Proq17_2 | Proq17_2_Fwd | GATCGGAAACCCAGGAATTT | 63.8 |
| Proq17_2_Rev | GGGCCATATCCCATTCTTGA | 65.7 | |
| Proq18 | Proq18_Fwd | TCAGCACAATCAGTTCACGC | 65.2 |
| Proq18_Rev | TCAGCATTTGCTGCTGTTGT | 64.7 |
Population analyses
Linkage disequilibria among the four markers were computed using Genepop on the Web version 4.2 [62,63] (http://genepop.curtin.edu.au/). For inferring population structure, individual-based Bayesian clustering methods implemented in STRUCTURE version 2.3.4 were used [64]. Ten independent analyses were carried out for each number of clusters from K = 2 to K = 10, using admixture models, 500,000 MCMC iterations after a burn-in time of 50,000 steps. Outputs were processed using CLUMPP version 1.1.2 [65] to identify clustering solutions in replicated runs of each K. Graphical displays of population structure were performed using DISTRUCT version 1.1 [66]. The Evanno method [67] was implemented using STRUCTURE HARVESTER on the web ([68], http://taylor0.biology.ucla.edu/structureHarvester/) in order to detect the K value corresponding to the strongest structure. The extent of population subdivision was evaluated by calculating F ST indexes for all pairs of populations and by performing a hierarchical analysis of molecular variance (AMOVA) [69] using Genodive 2.0b25 [70]. A Principal Component Analysis (PCA) and Factorial Correspondence Analyses (FCA) were performed using R [71].
Results
Morphology
A high level of macroscopic morphological diversity was observed (Fig 1). On PDA (the most discriminative medium), colony color varied from light to dark greenish gray including grayish, pale, pale yellowish and olive green whereas colony texture varied from velvety to fasciculate including weakly floccose (S5 Table). While margins were mainly regular (S5 Table), their size varied considerably, with some isolates exhibiting a very thin margin whereas others had a thick margin representing up to one third of colony diameter (Fig 1). The recorded macroscopic morphological traits were reproducible: the correlations between the first diameter measure and the two replicate measures were indeed highly significant (S5 Table; r = 0.88, P < 0.001 for second replicate and r = 0.84, P < 0.001 for third replicate) and the same colors, texture and margins were recorded on the different subcultures of the same isolate. Microscopic morphological variations were also observed on MEA medium: conidiophore roughness was more or less pronounced and penicilli were more or less appressed depending on the specimen observed. However, these differences were subtle and were therefore not recorded. No substantial spore size variation was noticed among isolates. Noteworthy, only rudimentary penicilli were observed for isolate MUCL 18048.
Fig 1. Penicillium roqueforti.

(Column A to I respectively correspond to PTX.PR.26.1 (A), F75-6 (B), UBOCC-A-109090 (C), UBOCC-A-111170 (D), MUCL 18048 (E), FM164 (F), F61-6 (G), UBOCC-A-110052 (H), F84 (I) isolates grown respectively for 7 days at 25°C on Czapek Yeast Extract Agar (CYA) (lines 1 & 2: obverse & reverse), Glycerol Nitrate Agar (G25N) (lines 3 & 4: obverse & reverse), Malt Extract Agar (MEA) (lines 5 & 6: obverse & reverse), Potato Dextrose Agar (PDA) (line 7), Yeast Extract Sucrose agar (YES) (lines 8 & 9: obverse & reverse) and Creatine sucrose agar (CREA) (line 10) media.
Phylogenetic reconstruction
Out of the eleven tested DNA fragments, six were not kept for further analyses (18S, 28S, ITS, EF-1α, rpb1, rpb2) due to their lack of genetic variability on the 24 selected isolates. The five fragments chosen for further sequencing (β-tub, cmd, cct8, tsr1 and mcm7) were successfully amplified by PCR from total DNA extracts of 143 to 145 P. roqueforti isolates, depending on the fragments, as well as of 14 strains belonging to other Penicillium species. Overall, the partial β-tub locus (443 bp), cct8 locus (1224 bp), cmd locus (465 bp), mcm7 locus (565 bp) and tsr1 locus (809 bp) were used to construct five gene genealogies (Fig 2; Table 3).
Fig 2. Rooted Bayesian trees based on analysis of the separated sequence data (β-tub, cmd, cct8, mcm7, tsr1).

Posterior probabilities followed by bootstrap values of Maximum Likelihood and Maximum Parsimony analyses are indicated next to nodes. The tree was rooted with Penicillium paneum isolate CBS 303.97.
Table 3. Information regarding individual Maximum Parsimony trees (β-tub, cct8, cmd, mcm7, tsr1, Proq235, Proq845 and Proq631 loci).
| β-tub | cct8 | cmd | mcm7 | tsr1 | Proq235 | Proq845 | Proq631 | |
|---|---|---|---|---|---|---|---|---|
| No of isolates analyzed | 158 | 157 | 159 | 157 | 159 | 30 | 30 | 30 |
| Alignable characters | 443 | 1224 | 465 | 565 | 809 | 930 | 988 | 1029 |
| Variable characters | 45 | 52 | 42 | 36 | 49 | 50 | 16 | 15 |
| Informative characters a | 27 | 30 | 22 | 21 | 31 | 50 | 16 | 14 |
| Tree length | 47 | 55 | 49 | 36 | 50 | 50 | 19 | 16 |
| Consistency index (CI) b | 0.979 | 0.945 | 0.898 | 1 | 0.980 | 1 | 0.789 | 1 |
| Retention index (RI) c | 0.979 | 0.932 | 0.918 | 1 | 0.983 | 1 | 0.867 | 1 |
a An informative character is a character for which there are at least two different states in the set of sequences, and each of these states occurs in at least two of the sequences.
b The CI is the sum over all characters of the per-character CI defined as ms-1, where m is the minimum possible number of character changes (steps) on any tree, and s is the actual number of steps on the current tree. This index varies from one (no homoplasy) and down towards zero (a lot of homoplasy).
c The RI is the sum over all characters of the per-character RI defined as (g-s)/(g-m), where m and s are as for the per-character CI, while g is the maximal number of steps for the character on any cladogram. The RI measures the amount of synapomorphy on the tree, and varies from 0 to 1.
Due to the weak phylogenetic signal of the first five genes (Table 4), three more polymorphic DNA fragments (Proq235, 930 bp; Proq631, 1029 bp; Proq845, 988 bp) were identified by comparing five P. roqueforti strains genome sequences and sequenced on the 30 isolates chosen for further phylogenetic reconstructions (S1 Fig; Table 3).
Table 4. Genetic information regarding β-tub, cct8, cmd, mcm7 and tsr1 sequence alignments of Penicillium roqueforti isolates.
| β-tub | cct8 | cmd | mcm7 | tsr1 | |
|---|---|---|---|---|---|
| No of isolates analyzed | 144 | 143 | 145 | 143 | 145 |
| Alignable characters | 443 | 1224 | 465 | 565 | 809 |
| Variable characters | 3 | 6 | 4 | 4 | 10 |
| Informative characters a | 2 | 4 | 3 | 0 | 4 |
a An informative character is a character for which there are at least two different states in the set of sequences, and each of these states occurs in at least two of the sequences.
Because the ILD tests indicated significant incongruence between the studied gene trees in both datasets (β-tub, cmd, cct8, tsr1, mcm7 on the one hand and Proq235, Proq631, Proq845 on the other hand) (P < 0.05), no phylogenetic analyses were performed using concatenated datasets.
Species delimitation
Considering the five individual gene trees for ßtub, cct8, cmd, mcm7 and tsr1, isolates identified as P. paneum, P. carneum and P. roqueforti were systematically assigned to three distinct clades regardless of the method used (ML, MP or Bayesian inference). In contrast, P. psychrosexualis isolate CBS 128137HT appeared as a sister clade of P. roqueforti in the cct8 tree, as a sister clade of P. carneum in the ßtub tree and basal to P. carneum and P. roqueforti according to the cmd tree and even within the P. roqueforti clade in the case of the mcm7 and tsr1 trees. In each of the five gene genealogies, multiple subclades appeared within the P. roqueforti clade. Some of these subclades were well supported (e.g., in the ßtub and tsr1 trees) but not others (e.g., in the cmd tree). When considering the well-supported subclades, they did not consistently include the same isolates across the different gene trees. For example, the FM164 and CBS 498.73 isolates were nested in the same subclade in the ßtub genealogy while placed in two different subclades in the tsr1 genealogy.
Regarding the individual gene trees obtained for the Proq235, Proq631 and Proq845 variable regions using only P. roqueforti isolates (n = 30), all subclades were well supported but again conflicts were observed between the different gene genealogies with regards to P. roqueforti subclades relationships and content. Incongruences among the nodes between the different gene genealogies in P. roqueforti were observed, as illustrated on the cluster network consensus tree (Fig 3), indicating relatively recent recombination among these groups. No cryptic species could therefore be recognized according to the GC-PSR method.
Fig 3. Cluster network consensus of the three bayesian trees (Proq235, Proq845 and Proq631) using Dendroscope.

Hardwire network shows incongruences between clades.
Penicillium roqueforti genetic diversity and population structure
Preliminary tests were performed for the 24 identified microsatellite primer pairs on eight selected isolates. The number of alleles (n a) detected varied from 1 to 4 and Polymorphism Information Content (PIC) values ranged from 0 to 0.72. The four most polymorphic microsatellite markers (n a ≥ 3; PIC ≥ 0.56) were used to genotype the whole collection of P. roqueforti isolates (n = 164) and allowed to detect 28 haplotypes. Interestingly, only 13 haplotypes were detected among the 140 blue-cheese isolates whereas 15 haplotypes were identified among the other isolates (n = 24).
Significant linkage disequilibrium was detected between 5 locus pairs (out of 6) when the dataset was considered as a single population. This may result from a Wahlund effect if differentiated populations exist in the sample. The P. roqueforti population structure was further investigated with the STRUCTURE program. It yielded well-defined clusters at K values up to 3 (Fig 4), indicating the existence of three genetically differentiated populations. For K values ≥ 4, each new cluster included only admixed genotypes indicating a lack of further supported structure (S2 Fig). The deltaK value confirmed that this split (K = 3) was the strongest structure in the data set (Fig 5). Due to the lack of polymorphism in two clusters, linkage disequilibrium could only be assessed in one of the clusters (population 2), being non-significant. The existence of three genetically differentiated populations was further confirmed by fixation index F ST values, systematically greater than 0.633 (population 2 vs 3: 0.633; population 1 vs 2: 0.7240; population 1 vs 3: 0.8194). Moreover, the AMOVA analysis indicated that most of the genetic variance (> 72%) was located at the among-population level.
Fig 4. Population structure of Penicillium roqueforti.
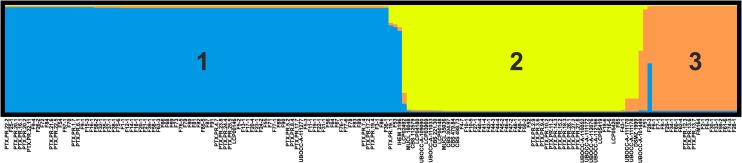
The structure has been inferred by STRUCTURE for K = 3 (see S2 Fig for the barplots corresponding to other K values).
Fig 5. Detection of the uppermost level of structure assuming nulls as missing data.

Delta K estimated following the Evanno method using Structure Harvester on the web.
PCA results were also in agreement with the existence of three genetic clusters; the analysis, including all 164 isolates genotyped with four microsatellites, confirmed the differentiation of the three populations, as they did not overlap (Fig 6, with 65.69% and 20.89% of the variance explained by axes 1 and 2, respectively) except for the UBOCC-A-101449 isolate belonging to population 3 and clustering within population 1. Interestingly, the FCA analysis indicated a strong contrast between the three populations in terms of cheese isolate origin (Fig 7). Indeed, strains isolated from a given Protected Designation of Origin (PDO) or Protected Geographical Indication (PGI) cheese type were systematically associated to the same population. For example, most isolates sampled from Roquefort (16 out of 17), from Bleu d’Auvergne (5 out of 7) and all isolates from Bleu des Causses (3 out of 3) were assigned to population 2, while most isolates from Gorgonzola (6 out of 7) and Bleu du Vercors-Sassenage (1 out of 1) were assigned to population 3 and all isolates from Blue Stilton (4 out of 4), Cabrales (2 out of 2), Fourme d’Ambert (5 out of 5) and Danish Blue (2 out of 2) were assigned to population 1 (Fig 7, with 53.13% and 46.87% of the variance explained by the 1 and 2 axes, respectively). Noteworthy, a large majority of the non-blue-cheese isolates (21 out of 24) were found in population 2.
Fig 6. Principal Correspondence Analysis performed using R from 164 isolates.

Blue, yellow and orange dots correspond respectively to isolates of populations 1, 2 and 3 as defined on Fig 4.
Fig 7. Factorial Correspondence Analysis individual factor map.

(Protected Designation of Origin/Protected Geographical Indication cheeses & populations as obtained by STRUCTURE). Red numbers (1, 2 & 3) refer to the corresponding populations as defined on Fig 4.
Colony diameters were significantly different between all pairs of populations (Student t-tests, P < 0.001 between populations 2 and 3 and 1 and 3, P = 0.01 between populations 1 and 2). Chi2 tests showed that the colony margin and color obverse were significantly different between populations (Chi2 = 5.4; d.f. = 1; P = 0.02 and Chi2 = 125.3; d.f. = 21; P < 0.0001, respectively), and the colony texture marginally significantly different (Chi2 = 7.3; d.f. = 3; P = 0.06).
In particular, population 3 was almost exclusively composed of isolates with both a velvety to weakly floccose texture and a light greenish gray (5GY—8/1) to pale green (5G_/2–6/2) color (20 out of 21). This texture/color combination was not observed in other populations. In addition, population 3 isolates grew much slower than other population isolates (mean diameter of 51.9 ± 4.8 mm vs 63.7 ± 9.7 mm in population 2 and 66.6 ± 3.6 mm in population 1; S3 Fig).
Discussion
In this study, we analyzed a large collection of P. roqueforti isolates, mainly sampled from different blue cheese types collected worldwide. Substantial morphological diversity was observed. In this context, in order to address whether P. roqueforti encompassed different species, eleven loci among the most commonly used for the GC-PSR species delimitation criterion [17,72–77] were tested for polymorphism. The five most polymorphic genes (ßtub, cct8, cmd, mcm7 and tsr1) were sequenced in most of the collection. The weak phylogenetic signal of these genes, however, prevented obtaining strong support for nodes within P. roqueforti, therefore limiting their utility for applying this method. Nevertheless, incongruence among the different supported nodes indicated that the GC-PSR criterion does not support the existence of cryptic species in P. roqueforti. Three additional, more polymorphic fragments were sequenced on a subset of the collection and the supported nodes again appeared incongruent between the gene genealogies. Overall, our results therefore did not show evidence in favor of the existence of different species within P. roqueforti. However, the GC-PSR criterion would not detect recently derived species, especially if differentiated at human time scales, as this method requires that DNA fragments had time to coalesce [17,21–23].
The use of four microsatellite markers revealed genetic diversity in the collection, with 28 haplotypes detected. Despite the low number of isolates sampled from other substrates than cheeses, they displayed higher genetic diversity than cheese isolates. This indicates that blue-cheese making does not exploit the entire P. roqueforti diversity but instead relies on a limited pool of strains.
Population structure analyses based on the four microsatellite markers confirmed the existence of highly differentiated populations. Using a higher number of microsatellite markers (n = 11), Ropars et al. [16] identified up to six highly differentiated populations within a collection of 114 P. roqueforti isolates. As the present work and the study by Ropars et al. [16] shared 53 isolates, a comparison can be performed between the clusters identified in the two studies. The population 2 of the present study corresponded to the cluster B described by Ropars et al. [16], that was further subdivided into three populations. Our populations 1 and 3 corresponded to the cluster A detected by Ropars et al. [16], that was also further subdivided into three populations. As in this previous study [16], we found that one cluster included almost all non-blue-cheese isolates.
Importantly, we revealed in this study that the clustering of cheese isolates mainly corresponded to different cheese types. This might suggest that the different cheese-making processes domesticated their own P. roqueforti population from a common pool, leading to their genetic differentiation. Noteworthy, a phenotypic differentiation could also be observed. In particular, population 3, which included mainly isolates from Gorgonzola-type cheeses, displayed colony morphologies which were absent from other populations and grew much slower. A strong selection for some desired phenotypic traits may indeed differentiate populations through selective sweeps [78,79], especially in organisms like fungi with infrequent sex events compared to cycles of asexual reproduction.
However, this interpretation seems difficult to reconcile with the high diversity within clusters and the strong divergence between populations, given the human time-scale for domestication. According to historians, blue-cheese was rarely mentioned before the fifteenth century and was thought to have already been made in France since the chalcolithic [10]. Different blue-cheese technologies may have coexisted for at least 1000 years (e.g., Gorgonzola was first described in the literature in 879 whereas Roquefort was first cited in 1070) [8]. These dates seem too recent to account for the observed genetic differentiation at neutral markers by mere genetic drift, and selective sweeps would have drastically reduced genetic diversity [80,81].
Alternatively, it may be that different cheese producers domesticated distinct, already differentiated, P. roqueforti populations, with contrasted metabolic features and morphological traits. The reason for the lack of non-cheese isolates in the cheese clusters may be that these have been domesticated from unsampled ecological niches. In fact, P. roqueforti is difficult to isolate from natural habitats (i.e., other than human-made environments); all the strains available in public collections have been found by chance, without searching specifically for them, and usually from human-associated habitats (fruits, wood for wine casks, silage). Like yeasts for a long time [82], the fact that the wild ecological reservoirs for P. roqueforti have not been identified probably leads to under-sampling. The genetic structure in P. roqueforti reminds that of the yeast Saccharomyces cerevisiae in which differentiation has been found according to different food processes (bread, beer, wine or sake) [83–85]. Two scenarios have been proposed, either the domestication of different genetic groups with further selection for improved fermentation properties, or differentiation arising from human activities. Again as in S. cerevisiae [86], domestication footprints have been found in P. roqueforti and P. camemberti cheese fungi genomes, in the form of horizontal gene transfers carrying genes putatively involved in competition against other micro-organisms in cheeses [4]. Multiple genome sequence comparisons of wild strains vs cheese strains originating from the different populations detected in the present study would allow addressing the question of whether cheese strain genomes display footprints of adaptation that have led to metabolic specialization. Such footprints have been found for instance in Aspergillus oryzae [87], where an atoxigenic lineage of the pathogen Aspergillus flavus gradually evolved into a “cell factory” for enzymes and metabolites involved in the saccharification process. Evidence of genomic adaptation have also been reported in several other domesticated fungi [88].
In conclusion, while morphological differences were observed in P. roqueforti, they are not linked with the existence of different species as suggested by the GC-PSR analysis, although this method has some limitations. Interestingly, at the intraspecific level, the use of microsatellites revealed the existence of highly differentiated populations, corresponding to blue cheese types. This suggests that different populations, either ecotypes or allopatric populations, were recruited for different cheese types. Further physiological and metabolic studies are also needed to test for a link between P. roqueforti diversity and structure described in the present study and putative functional diversity.
Supporting Information
Posterior probabilities followed by bootstrap values of Maximum Likelihood and Maximum Parsimony analyses are indicated next to nodes.
(TIFF)
Barplots corresponding to K values from 2 to 6.
(TIFF)
Each isolate associated to a population is indicated by a cross (x). Error bars show the standard deviation for mean diameters () of each population.
(TIFF)
(DOCX)
(DOCX)
(DOCX)
(DOCX)
(DOCX)
Acknowledgments
We thank all the people worldwide who kindly provided cheese samples and therefore allowed us to create the working collection: Tim Cogan, Raphaël Coton, Anne-Marie Coton, Andrew Dabrowski, Laurent Esclade, Maria Fernandez, Kévin Fontaine, Gareth Griffith, Alexis Guerin-Laguette, Frida Hassler, Jussi Heinonsalo, Ieva Jakobija, Annavera Laminolara, Vanesa Ludemann, Marie-Christine Montel, Marie-Pierre Murray, Jérôme Mounier, Patrice Nodet, Martina Peter and Hein Trip. We are grateful to Jos Houbraken for providing the P. psychrosexualis CBS 128137HT isolate, to J.I. Pitt for helpful discussions on P. roqueforti macromorphology, to Patrice Nodet for his expertise on P. roqueforti micromorphology and to Emese Meglecz for help with QDD. We also thank Florian Thomas for technical assistance and Nicolas Ollier and Julie Hutchinson for the photographs in Fig 1.
Data Availability
All relevant data are within the paper and its Supporting Information files.
Funding Statement
GG is funded by the Ministère de l'Education Nationale, de l'Enseignement Supérieur et de la Recherche (France) & the French Dairy Inter-branch Organization (CNIEL, France). The authors acknowledge an ERC starting grant, GenomeFun 309403, awarded to TG, an ANR Fromagen grant to AB and an ATM Microorganisms-MNHN 2013 grant to MLV. The funders had no role in study design, data collection and analysis, or preparation of the manuscript.
References
- 1. Hawksworth DL. The fungal dimension of biodiversity: magnitude, significance, and conservation. Mycol Res. 1991;95: 641–655. 10.1016/S0953-7562(09)80810-1 [DOI] [Google Scholar]
- 2. Bass D, Richards TA. Three reasons to re-evaluate fungal diversity “on Earth and in the ocean.” Fungal Biol Rev. 2011;25: 159–164. 10.1016/j.fbr.2011.10.003 [DOI] [Google Scholar]
- 3. Giraud T, Refrégier G, Le Gac M, de Vienne DM, Hood ME. Speciation in fungi. Fungal Genet Biol. 2008;45: 791–802. 10.1016/j.fgb.2008.02.001 [DOI] [PubMed] [Google Scholar]
- 4. Cheeseman K, Ropars J, Renault P, Dupont J, Gouzy J, Branca A, et al. Multiple recent horizontal transfers of a large genomic region in cheese making fungi. Nat Commun. 2014;5 10.1038/ncomms3876 [DOI] [PMC free article] [PubMed] [Google Scholar]
- 5. Sandine WE, Elliker PR. Microbially induced flavors and fermented foods. Flavor in fermented dairy products. J Agric Food Chem. 1970;18: 557–562. 10.1021/jf60170a023 [DOI] [Google Scholar]
- 6. Beresford TP, Fitzsimons NA, Brennan NL, Cogan TM. Recent advances in cheese microbiology. Int Dairy J. 2001;11: 259–274. 10.1016/S0958-6946(01)00056-5 [DOI] [Google Scholar]
- 7. Salque M, Bogucki PI, Pyzel J, Sobkowiak-Tabaka I, Grygiel R, Szmyt M, et al. Earliest evidence for cheese making in the sixth millennium bc in northern Europe. Nature. 2013;493: 522–525. 10.1038/nature11698 [DOI] [PubMed] [Google Scholar]
- 8. Fox PF, McSweeney PLH. Cheese: An Overview In: Fox PF, McSweeney PLH, Cogan TM, Guinee TP, editors. Cheese: Chemistry, Physics and Microbiology. 3rd ed. London: Elsevier Academic Press; 2004. pp. 1–18. [Google Scholar]
- 9. Cantor MD, van den Tempel T, Hansen TK, Ardö Y. Blue cheese In: Fox PF, McSweeney PLH, Cogan TM, Guinee TP, editors. Cheese: Chemistry, Physics and Microbiology. 3rd ed. London: Elsevier Academic Press; 2004. pp. 175–198. [Google Scholar]
- 10.Dumay R. Le Roquefort. Rodez/Paris: Perspectives Aveyronnaises/Montalba; 1982.
- 11. CNIEL, editor. L’économie laitière en chiffres, Edition 2014, CNIEL; 2014. [Google Scholar]
- 12. Pitt JI, Hocking AD. Fungi and Food Spoilage. 3rd ed. New-York: Springer; 2009. [Google Scholar]
- 13. Samson RA, Houbraken J, Thrane U, Frisvad JC, Andersen B. Food and Indoor Fungi. Utrecht: CBS-KNAW Fungal Biodiversity Centre; 2010. [Google Scholar]
- 14. Abbas A, Dobson ADW. Yeasts and Molds: Penicillium roqueforti In: Fuquay JW, editor. Encyclopedia of Dairy Sciences (Second Edition). San Diego: Academic Press; 2011. pp. 772–775. Available: http://www.sciencedirect.com/science/article/pii/B9780123744074003630 [Google Scholar]
- 15. Visagie CM, Houbraken J, Frisvad JC, Hong S-B, Klaassen CHW, Perrone G, et al. Identification and nomenclature of the genus Penicillium . Stud Mycol. 2014;78: 343–371. 10.1016/j.simyco.2014.09.001 [DOI] [PMC free article] [PubMed] [Google Scholar]
- 16. Ropars J, López-Villavicencio M, Dupont J, Snirc A, Gillot G, Coton M, et al. Induction of sexual reproduction and genetic diversity in the cheese fungus Penicillium roqueforti . Evol Appl. 2014;7: 433–441. 10.1111/eva.12140 [DOI] [PMC free article] [PubMed] [Google Scholar]
- 17. Taylor JW, Jacobson DJ, Kroken S, Kasuga T, Geiser DM, Hibbett DS, et al. Phylogenetic species recognition and species concepts in fungi. Fungal Genet Biol. 2000;31: 21–32. 10.1006/fgbi.2000.1228 [DOI] [PubMed] [Google Scholar]
- 18. Le Gac M, Hood ME, Fournier E, Giraud T. Phylogenetic evidence of host-specific cryptic species in the anther smut fungus. Evol Int J Org Evol. 2007;61: 15–26. 10.1111/j.1558-5646.2007.00002.x [DOI] [PubMed] [Google Scholar]
- 19. Dettman JR, Sirjusingh C, Kohn LM, Anderson JB. Incipient speciation by divergent adaptation and antagonistic epistasis in yeast. Nature. 2007;447: 585–588. 10.1038/nature05856 [DOI] [PubMed] [Google Scholar]
- 20. Ropars J, Dupont J, Fontanillas E, Rodríguez de la Vega RC, Malagnac F, Coton M, et al. Sex in cheese: evidence for sexuality in the fungus Penicillium roqueforti . PLoS ONE. 2012;7: e49665 10.1371/journal.pone.0049665 [DOI] [PMC free article] [PubMed] [Google Scholar]
- 21. Degnan JH, Rosenberg NA. Gene tree discordance, phylogenetic inference and the multispecies coalescent. Trends Ecol Evol. 2009;24: 332–340. 10.1016/j.tree.2009.01.009 [DOI] [PubMed] [Google Scholar]
- 22. Knowles LL. Estimating species trees: methods of phylogenetic analysis when there is incongruence across genes. Syst Biol. 2009;58: 463–467. 10.1093/sysbio/syp061 [DOI] [PubMed] [Google Scholar]
- 23.Chung Y. Inference of gene tree discordance and recombination [Internet]. M.Sc. Thesis, University of Wisconsin-Madison. 2012. Available: http://gradworks.umi.com/35/47/3547821.html
- 24. Munsell Color Company. Munsell Soil Color Charts 2009 Revised Edition Grand Rapids, Michigan: X-Rite America; 2009. [Google Scholar]
- 25.Pitt JI. A Laboratory Guide to Common Penicillium Species. 2nd ed. CSIRO Food Research Laboratory, P.O. Box 52, North Ryde, N.S.W. 2113, Australia: Commonwealth Scientific and Industrial Research Organization, Division of Food Processing; 1988.
- 26. Institute SAS. JMP. Version 7. SAS Institute Inc; Cary, North Carolina; 2007. [Google Scholar]
- 27. Glass NL, Donaldson GC. Development of primer sets designed for use with the PCR to amplify conserved genes from filamentous Ascomycetes. Appl Environ Microbiol. 1995;61: 1323–1330. [DOI] [PMC free article] [PubMed] [Google Scholar]
- 28. Samson RA, Seifert KA, Kuijpers AFA, Houbraken JAMP, Frisvad JC. Phylogenetic analysis of Penicillium subgenus Penicillium using partial β-tubulin sequences. Stud Mycol. 2004;49: 175–200. [Google Scholar]
- 29. White T, Bruns T, Lee S, Taylor J. Amplification and direct sequencing of fungal ribosomal RNA genes for phylogenetics In: Innis M, Gelfand D, Shinsky J, White T, editors. PCR Protocols: A Guide to Methods and Applications. New-York: Academic Press; 1990. pp. 315–322. [Google Scholar]
- 30. Gargas A, Taylor JW. Polymerase Chain Reaction (PCR) primers for amplifying and sequencing nuclear 18s rDNA from lichenized fungi. Mycologia. 1992;84: 589 10.2307/3760327 [DOI] [Google Scholar]
- 31. Kauff F, Lutzoni F. Phylogeny of the Gyalectales and Ostropales (Ascomycota, Fungi): among and within order relationships based on nuclear ribosomal RNA small and large subunits. Mol Phylogenet Evol. 2002;25: 138–156. 10.1016/S1055-7903(02)00214-2 [DOI] [PubMed] [Google Scholar]
- 32. Vilgalys R, Hester M. Rapid genetic identification and mapping of enzymatically amplified ribosomal DNA from several Cryptococcus species. J Bacteriol. 1990;172: 4238–4246. [DOI] [PMC free article] [PubMed] [Google Scholar]
- 33. Rehner SA, Samuels GJ. Taxonomy and phylogeny of Gliocladium analysed from nuclear large subunit ribosomal DNA sequences. Mycol Res. 1994;98: 625–634. 10.1016/S0953-7562(09)80409-7 [DOI] [Google Scholar]
- 34. Houbraken J, Samson RA. Phylogeny of Penicillium and the segregation of Trichocomaceae into three families. Stud Mycol. 2011;70: 1–51. 10.3114/sim.2011.70.01 [DOI] [PMC free article] [PubMed] [Google Scholar]
- 35. Liu YJ, Whelen S, Hall BD. Phylogenetic relationships among Ascomycetes: evidence from an RNA polymerase II subunit. Mol Biol Evol. 1999;16: 1799–1808. [DOI] [PubMed] [Google Scholar]
- 36. Peterson SW. Multilocus DNA sequence analysis shows that Penicillium biourgeianum is a distinct species closely related to P. brevicompactum and P. olsonii . Mycol Res. 2004;108: 434–440. 10.1017/S0953756204009761 [DOI] [PubMed] [Google Scholar]
- 37. Kearsey SE, Labib K. MCM proteins: evolution, properties, and role in DNA replication. Biochim Biophys Acta. 1998;1398: 113–136. [DOI] [PubMed] [Google Scholar]
- 38. Gelperin D, Horton L, Beckman J, Hensold J, Lemmon SK. Bms1p, a novel GTP-binding protein, and the related Tsr1p are required for distinct steps of 40S ribosome biogenesis in yeast. RNA. 2001;7: 1268–1283. [DOI] [PMC free article] [PubMed] [Google Scholar]
- 39. Léger-Silvestre I, Milkereit P, Ferreira-Cerca S, Saveanu C, Rousselle J-C, Choesmel V, et al. The ribosomal protein Rps15p is required for nuclear exit of the 40S subunit precursors in yeast. EMBO J. 2004;23: 2336–2347. 10.1038/sj.emboj.7600252 [DOI] [PMC free article] [PubMed] [Google Scholar]
- 40. Kim S, Willison KR, Horwich AL. Cystosolic chaperonin subunits have a conserved ATPase domain but diverged polypeptide-binding domains. Trends Biochem Sci. 1994;19: 543–548. 10.1016/0968-0004(94)90058-2 [DOI] [PubMed] [Google Scholar]
- 41. Stoldt V, Rademacher F, Kehren V, Ernst JF, Pearce DA, Sherman F. Review: The Cct eukaryotic chaperonin subunits of Saccharomyces cerevisiae and other yeasts. Yeast. 1996;12: 523–529. [DOI] [PubMed] [Google Scholar]
- 42. Hong S-B, Go S-J, Shin H-D, Frisvad JC, Samson RA. Polyphasic taxonomy of Aspergillus fumigatus and related species. Mycologia. 2005;97: 1316–1329. 10.3852/mycologia.97.6.1316 [DOI] [PubMed] [Google Scholar]
- 43. Schmitt I, Crespo A, Divakar PK, Fankhauser JD, Herman-Sackett E, Kalb K, et al. New primers for promising single-copy genes in fungal phylogenetics and systematics. Persoonia. 2009;23: 35–40. 10.3767/003158509X470602 [DOI] [PMC free article] [PubMed] [Google Scholar]
- 44. Houbraken J, Spierenburg H, Frisvad JC. Rasamsonia, a new genus comprising thermotolerant and thermophilic Talaromyces and Geosmithia species. Antonie Van Leeuwenhoek. 2012;101: 403–421. 10.1007/s10482-011-9647-1 [DOI] [PMC free article] [PubMed] [Google Scholar]
- 45. Librado P, Rozas J. DnaSP v5: a software for comprehensive analysis of DNA polymorphism data. Bioinformatics. 2009;25: 1451–1452. 10.1093/bioinformatics/btp187 [DOI] [PubMed] [Google Scholar]
- 46. Koressaar T, Remm M. Enhancements and modifications of primer design program Primer3. Bioinformatics. 2007;23: 1289–1291. 10.1093/bioinformatics/btm091 [DOI] [PubMed] [Google Scholar]
- 47. Untergasser A, Cutcutache I, Koressaar T, Ye J, Faircloth BC, Remm M, et al. Primer3—new capabilities and interfaces. Nucleic Acids Res. 2012;40: e115–e115. 10.1093/nar/gks596 [DOI] [PMC free article] [PubMed] [Google Scholar]
- 48.Maddison W, Maddison D. Mesquite: a modular system for evolutionary analysis. 2011; Available: http://mesquiteproject.org
- 49. Katoh K, Standley DM. MAFFT multiple sequence alignment software version 7: improvements in performance and usability. Mol Biol Evol. 2013;30: 772–780. 10.1093/molbev/mst010 [DOI] [PMC free article] [PubMed] [Google Scholar]
- 50. Guindon S, Gascuel O. A simple, fast, and accurate algorithm to estimate large phylogenies by maximum likelihood. Syst Biol. 2003;52: 696–704. 10.1080/10635150390235520 [DOI] [PubMed] [Google Scholar]
- 51. Darriba D, Taboada GL, Doallo R, Posada D. jModelTest 2: more models, new heuristics and parallel computing. Nat Methods. 2012;9: 772–772. 10.1038/nmeth.2109 [DOI] [PMC free article] [PubMed] [Google Scholar]
- 52. Swofford DL. PAUP*. Phylogenetic Analysis Using Parsimony (*and other methods). Sunderland, Massachusetts: Sinauer Associates; 2003. [Google Scholar]
- 53. Huelsenbeck JP, Ronquist F. MRBAYES: Bayesian inference of phylogenetic trees. Bioinformatics. 2001;17: 754–755. 10.1093/bioinformatics/17.8.754 [DOI] [PubMed] [Google Scholar]
- 54. Ronquist F, Huelsenbeck JP. MRBAYES 3: Bayesian phylogenetic inference under mixed models. Bioinformatics. 2003;19: 1572–1574. 10.1093/bioinformatics/btg180 [DOI] [PubMed] [Google Scholar]
- 55. Nylander JAA, Wilgenbusch JC, Warren DL, Swofford DL. AWTY (are we there yet?): a system for graphical exploration of MCMC convergence in Bayesian phylogenetics. Bioinformatics. 2008;24: 581–583. 10.1093/bioinformatics/btm388 [DOI] [PubMed] [Google Scholar]
- 56. Farris JS, Källersjö M, Kluge AG, Bult C. Testing significance of incongruence. Cladistics. 1994;10: 315–319. 10.1111/j.1096-0031.1994.tb00181.x [DOI] [Google Scholar]
- 57. Huson DH, Richter DC, Rausch C, Dezulian T, Franz M, Rupp R. Dendroscope: an interactive viewer for large phylogenetic trees. BMC Bioinformatics. 2007;8: 460 10.1186/1471-2105-8-460 [DOI] [PMC free article] [PubMed] [Google Scholar]
- 58.Huson DH, Scornavacca C. Dendroscope 3: an interactive tool for rooted phylogenetic trees and networks. Syst Biol. 2012;0: 1–7. 10.1093/sysbio/sys062 [DOI] [PubMed]
- 59. Kofler R, Schlötterer C, Lelley T. SciRoKo: a new tool for whole genome microsatellite search and investigation. Bioinformatics. 2007;23: 1683–1685. 10.1093/bioinformatics/btm157 [DOI] [PubMed] [Google Scholar]
- 60. Sweet MJ, Scriven LA, Singleton I. Microsatellites for microbiologists. Adv Appl Microbiol. 2012;81: 169–207. 10.1016/B978-0-12-394382-8.00005-8 [DOI] [PubMed] [Google Scholar]
- 61. Meglécz E, Costedoat C, Dubut V, Gilles A, Malausa T, Pech N, et al. QDD: a user-friendly program to select microsatellite markers and design primers from large sequencing projects. Bioinforma Oxf Engl. 2010;26: 403–404. 10.1093/bioinformatics/btp670 [DOI] [PubMed] [Google Scholar]
- 62. Raymond M, Rousset F. GENEPOP (version 1.2): population genetics software for exact tests and ecumenicism. J Hered. 1995;86: 248–249. [Google Scholar]
- 63. Rousset F. GENEPOP’007: a complete re-implementation of the GENEPOP software for Windows and Linux. Mol Ecol Resour. 2008;8: 103–106. 10.1111/j.1471-8286.2007.01931.x [DOI] [PubMed] [Google Scholar]
- 64. Pritchard JK, Stephens M, Donnelly P. Inference of population structure using multilocus genotype data. Genetics. 2000;155: 945–959. [DOI] [PMC free article] [PubMed] [Google Scholar]
- 65. Jakobsson M, Rosenberg NA. CLUMPP: a cluster matching and permutation program for dealing with label switching and multimodality in analysis of population structure. Bioinformatics. 2007;23: 1801–1806. 10.1093/bioinformatics/btm233 [DOI] [PubMed] [Google Scholar]
- 66. Rosenberg NA. DISTRUCT: a program for the graphical display of population structure. Mol Ecol Notes. 2004;4: 137–138. 10.1046/j.1471-8286.2003.00566.x [DOI] [Google Scholar]
- 67. Evanno G, Regnaut S, Goudet J. Detecting the number of clusters of individuals using the software STRUCTURE: a simulation study. Mol Ecol. 2005;14: 2611–2620. 10.1111/j.1365-294X.2005.02553.x [DOI] [PubMed] [Google Scholar]
- 68. Earl DA, vonHoldt BM. STRUCTURE HARVESTER: a website and program for visualizing STRUCTURE output and implementing the Evanno method. Conserv Genet Resour. 2012;4: 359–361. 10.1007/s12686-011-9548-7 [DOI] [Google Scholar]
- 69. Excoffier L, Smouse PE, Quattro JM. Analysis of molecular variance inferred from metric distances among DNA haplotypes: application to human mitochondrial DNA restriction data. Genetics. 1992;131: 479–491. [DOI] [PMC free article] [PubMed] [Google Scholar]
- 70. Meirmans PG, Van Tienderen PH. GENOTYPE and GENODIVE: two programs for the analysis of genetic diversity of asexual organisms. Mol Ecol Notes. 2004;4: 792–794. 10.1111/j.1471-8286.2004.00770.x [DOI] [Google Scholar]
- 71. R Core Team. R: a language and environment for statistical computing [Internet]. Vienna, Austria: R Foundation for Statistical Computing; 2014. Available: http://www.R-project.org [Google Scholar]
- 72. Miller AN, Huhndorf SM. Using phylogenetic species recognition to delimit species boundaries within Lasiosphaeria . Mycologia. 2004;96: 1106–1127. [PubMed] [Google Scholar]
- 73. Grünig CR, Brunner PC, Duò A, Sieber TN. Suitability of methods for species recognition in the Phialocephala fortinii–Acephala applanata species complex using DNA analysis. Fungal Genet Biol. 2007;44: 773–788. 10.1016/j.fgb.2006.12.008 [DOI] [PubMed] [Google Scholar]
- 74. Pavlic D, Slippers B, Coutinho TA, Wingfield MJ. Multiple gene genealogies and phenotypic data reveal cryptic species of the Botryosphaeriaceae: a case study on the Neofusicoccum parvum/N. ribis complex. Mol Phylogenet Evol. 2009;51: 259–268. 10.1016/j.ympev.2008.12.017 [DOI] [PubMed] [Google Scholar]
- 75. Peterson SW, Orchard SS, Menon S. Penicillium menonorum, a new species related to P. pimiteouiense . IMA Fungus. 2011;2: 121–125. 10.5598/imafungus.2011.02.02.02 [DOI] [PMC free article] [PubMed] [Google Scholar]
- 76. Hermet A, Méheust D, Mounier J, Barbier G, Jany J-L. Molecular systematics in the genus Mucor with special regards to species encountered in cheese. Fungal Biol. 2012;116: 692–705. 10.1016/j.funbio.2012.04.002 [DOI] [PubMed] [Google Scholar]
- 77. Vialle A, Feau N, Frey P, Bernier L, Hamelin RC. Phylogenetic species recognition reveals host-specific lineages among poplar rust fungi. Mol Phylogenet Evol. 2013;66: 628–644. 10.1016/j.ympev.2012.10.021 [DOI] [PubMed] [Google Scholar]
- 78. Smith JM, Haigh J. The hitch-hiking effect of a favourable gene. Genet Res. 1974;23: 23–35. 10.1017/S0016672300014634 [DOI] [PubMed] [Google Scholar]
- 79. Chen H, Patterson N, Reich D. Population differentiation as a test for selective sweeps. Genome Res. 2010;20: 393–402. 10.1101/gr.100545.109 [DOI] [PMC free article] [PubMed] [Google Scholar]
- 80. Kaplan NL, Hudson RR, Langley CH. The “hitchhiking effect” revisited. Genetics. 1989;123: 887–899. [DOI] [PMC free article] [PubMed] [Google Scholar]
- 81. Sabeti PC, Schaffner SF, Fry B, Lohmueller J, Varilly P, Shamovsky O, et al. Positive natural selection in the human lineage. Science. 2006;312: 1614–1620. 10.1126/science.1124309 [DOI] [PubMed] [Google Scholar]
- 82. Liti G, Carter DM, Moses AM, Warringer J, Parts L, James SA, et al. Population genomics of domestic and wild yeasts. Nature. 2009;458: 337–341. 10.1038/nature07743 [DOI] [PMC free article] [PubMed] [Google Scholar]
- 83. Fay JC, Benavides JA. Evidence for Domesticated and Wild Populations of Saccharomyces cerevisiae . PLoS Genet. 2005;1: e5 10.1371/journal.pgen.0010005 [DOI] [PMC free article] [PubMed] [Google Scholar]
- 84. Legras J-L, Merdinoglu D, Cornuet J-M, Karst F. Bread, beer and wine: Saccharomyces cerevisiae diversity reflects human history. Mol Ecol. 2007;16: 2091–2102. 10.1111/j.1365-294X.2007.03266.x [DOI] [PubMed] [Google Scholar]
- 85. Sicard D, Legras J-L. Bread, beer and wine: yeast domestication in the Saccharomyces sensu stricto complex. C R Biol. 2011;334: 229–236. 10.1016/j.crvi.2010.12.016 [DOI] [PubMed] [Google Scholar]
- 86. Novo M, Bigey F, Beyne E, Galeote V, Gavory F, Mallet S, et al. Eukaryote-to-eukaryote gene transfer events revealed by the genome sequence of the wine yeast Saccharomyces cerevisiae EC1118. Proc Natl Acad Sci. 2009;106: 16333–16338. 10.1073/pnas.0904673106 [DOI] [PMC free article] [PubMed] [Google Scholar]
- 87. Gibbons JG, Salichos L, Slot JC, Rinker DC, McGary KL, King JG, et al. The evolutionary imprint of domestication on genome variation and function of the filamentous fungus Aspergillus oryzae . Curr Biol. 2012;22: 1403–1409. 10.1016/j.cub.2012.05.033 [DOI] [PMC free article] [PubMed] [Google Scholar]
- 88. Gladieux P, Ropars J, Badouin H, Branca A, Aguileta G, de Vienne DM, et al. Fungal evolutionary genomics provides insight into the mechanisms of adaptive divergence in eukaryotes. Mol Ecol. 2014;23: 753–773. 10.1111/mec.12631 [DOI] [PubMed] [Google Scholar]
Associated Data
This section collects any data citations, data availability statements, or supplementary materials included in this article.
Supplementary Materials
Posterior probabilities followed by bootstrap values of Maximum Likelihood and Maximum Parsimony analyses are indicated next to nodes.
(TIFF)
Barplots corresponding to K values from 2 to 6.
(TIFF)
Each isolate associated to a population is indicated by a cross (x). Error bars show the standard deviation for mean diameters () of each population.
(TIFF)
(DOCX)
(DOCX)
(DOCX)
(DOCX)
(DOCX)
Data Availability Statement
All relevant data are within the paper and its Supporting Information files.