Abstract
Background
Metabolomics is a well-established rapidly developing research field involving quantitative and qualitative metabolite assessment within biological systems. Recent improvements in metabolomics technologies reveal the unequivocal value of metabolomics tools in natural products discovery, gene-function analysis, systems biology and diagnostic platforms.
Scope of review
We review of some of the prominent metabolomics methodologies employed in data acquisition and analysis of natural products and disease-related biomarkers.
Major conclusions
This review demonstrates that metabolomics represents a highly adaptable technology with diverse applications ranging from environmental toxicology to disease diagnosis. Metabolomic analysis is shown to provide a unique snapshot of the functional genetic status of an organism by examining its biochemical profile, with relevance toward resolving phylogenetic associations involving horizontal gene transfer and distinguishing subgroups of genera possessing high genetic homology, as well as an increasing role in both elucidating biosynthetic transformations of natural products and detecting preclinical biomarkers of numerous disease states.
General significance
This review expands the interest in multiplatform combinatorial metabolomic analysis. The applications reviewed range from phylogenetic assignment, biosynthetic transformations of natural products, and the detection of preclinical biomarkers.
Keywords: Integrated approaches, PCA, plant metabolomics, diagnostic biomarkers, NMR, targeted metabolomics
1. Introduction
Metabolomics, also referred to as metabolite profiling, is the assessment of metabolites within a biological system and has a well-established history [1-3]. Metabolomics platforms frequently combine NMR with MS [4] and when a set of defined metabolites are being analyzed a technique known as “targeted” metabolomics is performed. Typically, targeted metabolomics is utilized to detect the relative concentrations of no more than 200 predetermined analytes in a sample. Without a priori knowledge of metabolite targets, a much more comprehensive “untargeted” metabolomics approach is required. In untargeted metabolomics, biological samples are most often processed through an initial liquid chromatography (LC) or gas chromatography (GC) phase and subsequently subjected to MS analysis. Using this technique, thousands of metabolites can be detected in a single eluate, and it is this global approach that is leading the way to major revelations in our understanding of cell biology, physiology and medicine [5].
Novel MS and NMR imaging technologies and computational tools, have provided the means to obtain rapid accurate global assessment of metabolite conditions within an organism [6]. These advances have us to utilize metabolomics technology to discern phylogenetic associations between a few individuals or entire populations, with greater precision than genetic analysis alone, and made possible the discovery of numerous biomarkers that have improved prognosis by early detection of cancer, diabetes and cardiovascular disease [7]. Metabolomics methods have provided snapshots of cellular activity used to investigate the epigenetic effects of environmental variations [8] and plant metabolite analysis has been employed to elucidate the ecological effects of climate change [9].
While metabolite analysis has been conducted for decades, recent improvements in metabolomics technologies reveal the unequivocal value of metabolomics tools in gene-function analysis, systems biology and diagnostic platforms [10]. New biological challenges are continually presenting a greater need for rapid responses from the scientific community. With cases of new drug resistant microbial infections being reported on an increasingly regular basis, there is a constant demand for expeditious production of novel safe and effective medicines. A substantial concerted effort is paramount if we are to obtain the knowledge required to provide the best treatments and prognosis. With advanced NMR and MS tools and state-of-the-art data analysis, rapid accurate metabolite profiles will continue to enhance metabolomics data repositories and lead to new drug therapies, more effective diagnostics and improved disease prognosis.
2. Background
The seeds of metabolomic science were officially planted when Devaux and Horning published research on “metabolite profiles” they derived from Gas Chromatography/Mass Spectrometry (GC/MS) analysis of human urine and tissue extracts [11]. An almost immediate interest in utilizing metabolite profiles to diagnose disease followed [12]. During the 1970s metabolomics studies were expanded across a broad range of activities including: novel techniques for detection and elucidation of insect hormones [13], natural products exhibiting streptomycin-like functionality extracted from marine algae [14] and chemotherapeutic agents derived from plant extracts e.g., Hyptis tomentosa [15] were being characterized. In the early 1980s work on automating metabolite analysis began to appear [16] and in the mid-1980s metabolite profiling research using NMR and HPLC platforms were published [17-19]. In 1991, a global metabolite analysis approach was used to assess the mode of action (MOA) of herbicides in barley using GC/MS [20]. By the turn of the century, research and cooperation of the scientific community led to advances in metabolomics technologies and extraction methods promoting development of metabolite databases like METLIN [21], which are bringing us closer to a global assessment of the human metabolome [22].
3. Instrumentation and Tools
Metabolomics platforms primarily fall into five general categories; (GC x MS), (LC x MS), (MS), (NMR) and (Integrated Applications). Analytical tools have been developed providing fast, comprehensive data that is annotatable, quantitative and reproducible. A general overview of some of the more prominent metabolomics methodologies relating to sample preparation, data acquisition and analysis are presented.
3.1 GC-MS Approaches
The earliest research on “metabolite profiling” was published in the early 1970s by Horning and Devaux, describing their multi-component analysis of steroids and urinary drug metabolites using GC/MS techniques [11]. GC/MS technology continued to be developed from extensive research studies in the 1980s [23]. With GC/MS platforms, several hundred metabolites can be identified within a sample and some of the major advantages of GC/MS are reliable standard operating procedures (SOPs) for experimental design and sample and data analysis, which have been developed over its significant history in metabolite profiling [10].
Today, GC/MS is highly selective; relatively inexpensive and provides reproducible analysis with an added advantage of comprehensive structural databases [24] for GC/MS metabolite identification. A wide variety of GC instruments are available in a multitude of creative combinations, each providing specific analytical qualities. While standard GC/MS platforms have been used successfully to elucidate novel metabolites [25], utilizing two-dimensional chromatography techniques further enhance metabolite quantification [26] and give metabolomics platforms even greater analytic capability [27]. Metabolomics studies require accurate, global metabolite assessment with the highest throughput possible. This need to achieve rapid comprehensive analysis, has inspired the development of novel multi-dimensional metabolomics platforms.
GC platforms are designed according to the types of compounds being studied as well as the sensitivity required for analysis. Typical specifications for the most common types of GC detectors are provided in Table (A) below.
Table A.
Adapted from lecture information provided by James K. Hardy Ph.D., at the University of Akron, OH 44325.
| Detector | Type | Compound Applications | Sensitivity | Dynamic range |
|---|---|---|---|---|
| FID | D | Hydrocarbons | 5 pg/s | 107 |
| TCD | ND | Universal | 400 pg/mL | 106 |
| ECD | ND | Halogenated | 0.1 pg/s | 104 |
| NPD | D | Nitrogen Phosphorus |
0.4 pg N/s 0.2 pg P/s |
104 |
| FPD | D | Sulphur Phosphorus |
20 pg S/s 0.9 pg P/s |
S 103 P 104 |
| PID | ND | Ionizable by UV | 2 pg/s | 107 |
Flame Ionization Detector (FID), Thermal Conductivity Detector (TCD), Electron Capture Detector (ECD), Nitrogen Phosphorous Detector (NPD), Flame Photometric Detector (FPD), Photo Ionization Detector (FID), Hall Electro Conductivity Detector (HECD), Fourier Transform IR (FTIR), Destructive (D), Non Destructive (ND)
The most advanced GC metabolomics platforms include GC-Ion Trap/MS, GC-Time of Flight/MS (GC-TOF/MS), GC/tandem mass spectrometry (GC/MS/MS), and multi-dimensional GC/GC/MS. In a study of on the effects of celastrol treatment in human cervical cancer cells, Hu et al. [28] combined a GC-Ion Trap/MS based metabolomics platform with multivariate statistical analysis and devised a rapid, effective methodology to simultaneously screen multiple metabolic pathways for characteristic anti-cancer drug perturbations.
3.2 LC-MS Approaches
Liquid chromatography-mass spectrometry (LC-MS) is the most widely used technology in metabolomic analysis, due to its ability to separate and detect a diverse range of molecules with unparalleled sensitivity [23]. LC-MS platforms are also highly versatile, by coupling various liquid chromatography and mass spectrometry technologies, a myriad of component configurations with unique capabilities are possible [29-31].
Commonly employed liquid chromatographic methods used in metabolomic analysis include: normal-phase, reverse-phase, and hydrophilic interaction liquid chromatography. Normal-phase liquid chromatography (NPLC) readily separates highly non-polar metabolites (e.g. fatty acids, sterols, triacylglycerols, etc.), reverse-phase liquid chromatography liquid chromatography (RPLC) is better suited for the separation of metabolites of medium to low polarity (e.g. alkaloids, flavonoids, glycosylated steroids, phenolic acids, etc.), and hydrophilic interaction liquid chromatography (HILIC) can separate a broad range of metabolites depending upon the bonded-phase of chromatographic media used (e.g. amino bonded, cationic boned, zwitterionic bonded, etc.) [23, 30, 31]. Chromatographic versatility extends beyond the plethoric selection of column separation media available, when utilizing ultra-high performance, capillary or multidimensional liquid chromatography. Ultra-high performance liquid chromatography (UPLC) employs a short column with small diameter particle size (<2 μm) packing material and can operate at pressures of 5000 psi, for short elution times, but at the expense of separation resolving power [23, 31]. Capillary liquid chromatography incorporates much longer capillary columns, which significantly increase the resolution of chromatographic separation but necessitate increased analysis time [23]. Multidimensional liquid chromatography (MDLC) combines two or more of the preceding chromatographic modes to enhance metabolite separation [30, 31].
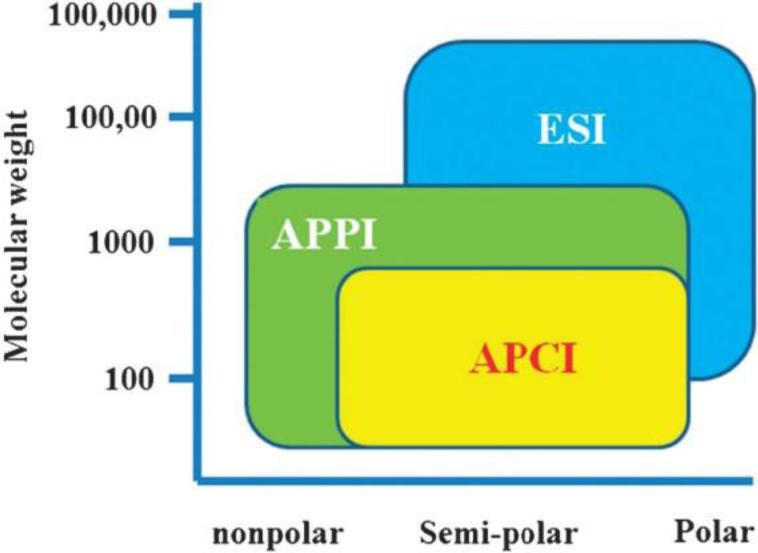
In an LC-MS metabolomics platform, the series of metabolites produced by chromatography are subsequently exposed to an ion source which dissociates them into ionic derivatives required for mass analysis. Common ionization sources include atmospheric pressure chemical ionization (APCI), atmospheric pressure photoionization (APPI), fast atom bombardment (FAB) and electrospray ionization (ESI). For metabolomics-based studies, ESI is by far the most common ionization source due to its ability to ionize both polar and semi-polar compounds of within a wide molecular weight range (Fig. 1) [31].
Fig. 1.
Relative ionization capabilities of APCI, APPI, and ESI sources. Figure obtained/modified from reference [31]. Permission pending.
Mass spectrometers are broadly categorized as Fourier transform ion cyclotron resonance (FTICR), ion trap (IT), orbitrap, quadrupole and time-of-flight (TOF). FTICR mass spectrometers determine the mass-to-charge ratio (m/z) of ions, with a mass accuracy in the parts per billion range, based on the cyclotron frequency they exhibit while in a fixed magnetic field [32]. Orbitrap mass spectrometers possess a thin inner electrode and a cylindrical outer electrode [33]. A static voltage is applied to the inner electrode and ion (m/z) is assessed by measuring the frequency of harmonic oscillations observed when electrostatic attraction to the inner electrode is balanced by centrifugal forces [33]. Orbitraps are relatively inexpensive analyzers and offer mass accuracy in the low parts per million range [33]. Quadrupole analyzers are linear ion traps which utilize both quadrupole rods to radially confine ions and on-end electrodes to confine ions axially [34]. Quadrupoles tend to be the least expensive ion traps and are often employed in tandem with other analyzers [35]. TOF spectrometers determine (m/z) by measuring the specific time ions accelerated through electric fields of preset strength require to reach a detector and are far less destructive to samples than other spectrometric methods [36].
Hybrid/tandem mass spectrometers are constructed by using two or more of the previous mass analyzers in the same LC-MS system. For metabolomics studies, IT, TOF, and quadrupole mass analyzers are most commonly used, due to their ability to provide the accurate high mass resolution of MS/MS analysis [31, 37].
These alternatives in LC-MS component configuration introduce a clear source of variation in the metabolomics data obtained. This is then further compounded by analytical conditions such as an elution gradient or isocratic solvent system, ionization mode used (positive or negative) and mass scan range (e.g. 50-1500 m/z vs. 100-1000 m/z) [31]. However, it is the flexible nature of LC-MS technology that is also its greatest advantage. The extreme diversity of metabolite chemo-physical properties or concentration, within a sample, precludes global assessment by any single analytical technology [38]. The ability to customize parameters to separate, detect, or even target a wide range of diverse molecules at low concentrations (e.g. pg mL−1), make it LCMS an ideal tool for metabolomic analysis [29, 39].
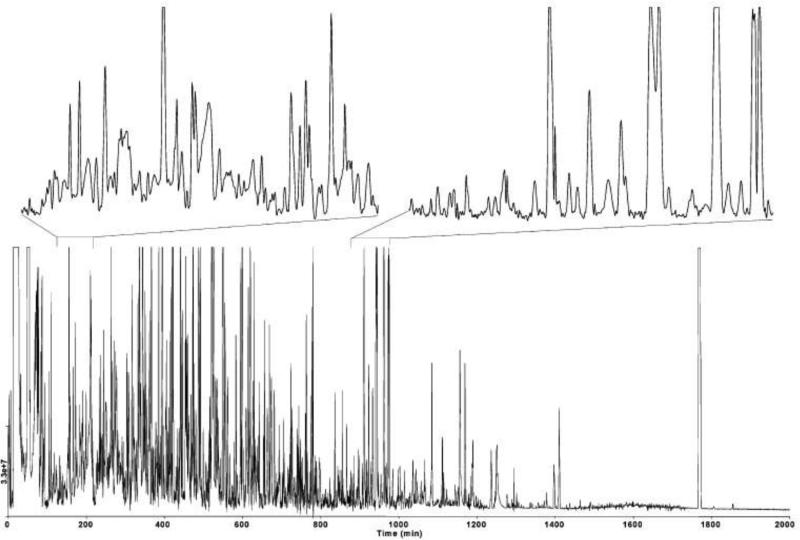
An excellent example of system level metabolomic analysis is in the study of Shewanella oneidensis by Shen et al. [29], in which over 5000 metabolites were detected from a single experiment utilizing a capillary-RPLC-IT-TOF-MS/MS platform (Fig. 2). The potential for high-data output by LC-MS analytical methods make it ideal for system level evaluation from which the data may then be analyzed by multivariate methods (e.g. principal component analysis (PCA)) or by high-order network based analysis [40].
Fig. 2.
System level metabolite analysis by capillary-RPLC-IT-TOF-MS/MS of S. oneidensis, >5000 metabolites detected, 100-1500 m/z scan range. Figure obtained/modified from reference [29]. Permission pending.
3.3 MSI Based Approaches
MS utilized in metabolomics studies is commonly based on assessing metabolite mass combined with one of several sample introduction techniques. One distinct advantage of utilizing MS analysis is the ability to obtain a mass accuracy of less than one ppm. In the full-scan mode, the mass spectrometer performs comprehensive analysis of all ions in a sample, within a predetermined range (e.g., 100–1,000 daltons). These data can include millions of data points, requiring processing into individual components. Most metabolomics MS platforms analyze samples initially processed by liquid chromatography (LC-MS) or gas chromatography (GC-MS) techniques. These interfaces are complimentary and overlapping analyte data provide corroboration when these techniques are combined.
3.4 NMR Based Approaches
Recent studies have shown impressive advances in biochemical analysis with NMR. Most nuclei in a biological sample possess a nuclear spin, which allows for convenient, rapid analysis with NMR spectroscopy, and a multitude of multidimensional experiments have been designed. Given the abundant and ubiquitous presence of 1H in most metabolites, one-dimensional (1D) 1H NMR spectroscopy is the primary source of NMR-based metabolomics data. Unfortunately, metabolite analysis by NMR platforms alone do not match the sensitivity of MS based platforms, but the highly reproducible, quantitative results of NMR, insures it will remain extremely valuable in biochemical studies, especially when combined with MS based techniques.
3.4.1 NMR Based Diagnostic Metabolomics
The informative analytical techniques of NMR and MS combined with systemic statistical analyses is a promising approach for a myriad of metabolomics-based studies. The application of NMR-based metabolomics is extremely diverse, ranging from elucidating environmental toxicology to identifying human diseases, since NMR-based research is more reproducible, nondestructive and embraces a wider dynamic range.
Rabies is a deadly viral infection of the central nervous system (CNS) and currently, no antiviral drugs for rabies are clinically available. O’ Sullivan et al., [41] elucidated the mechanisms of rabies pathogenesis employing NMR-based metabolomics. They examined cerebrospinal fluid (CSF) collected from rabies infected patients over the course of their disease (survivors and non-survivors) and discovered three distinct stages of rabies progression. Several metabolites associated with energy metabolism and cell volume control, which distinguished rabies survivors from non-survivors, were elucidated via the quantification from NMR spectra of the CSF samples. This metabolomics approach may cast light on future therapy for this incurable disease.
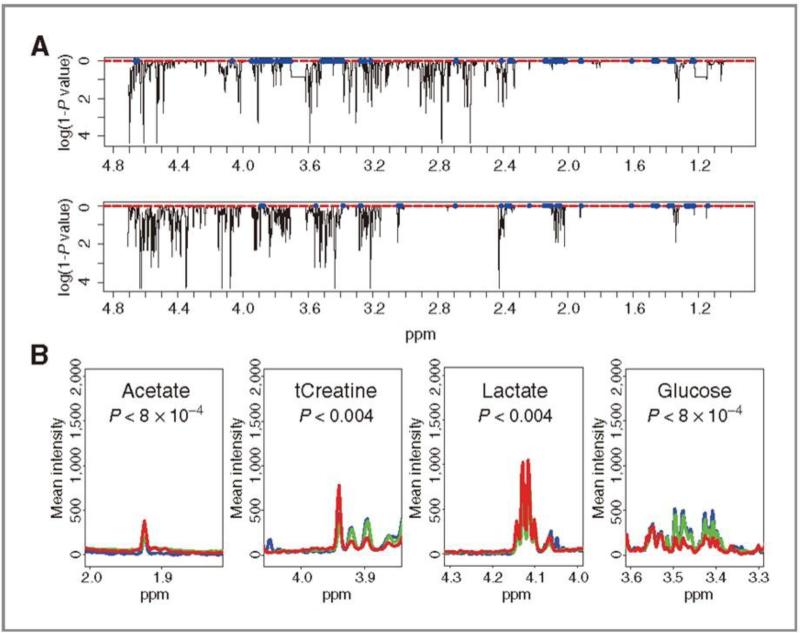
Another case study employing NMR techniques examines CSF in order to diagnose leptomeningeal carcinomatosis (LMC). This metastasis is one of the most common complications of the central nervous system but no satisfactory diagnostic tool has been established. In the aforementioned study, Cho et al., [42] utilized a high-resolution magic angle-spinning (HR-MAS) probe which is optimal for obtaining a high-quality NMR spectrum with a limited CSF sample volume (~40 μL). Their procedure for establishing a metabolomics profile was to gather representative NMR spectra for normal, three-day LMC and seven-day LMC rat models, to identify several metabolites (LMC marker metabolites) reported to be present in CSF including lactate, glucose, total creatine and acetate, and to analyze the spectra utilizing the Wilkoxon rank sum tests. The actual analysis of the LMC marker metabolites are shown using the normalized average spectra of the relevant peaks (Fig. 3) and glucose and t-creatine levels could be readily identified as a diagnostic tool for LMC. This NMR-based metabolomics approach for LMC diagnosis could be meaningful because it only requires 40 μL of CSF which is offered from routine CSF sampling. Indeed, CSF samples could be further utilized to provide clinicians and patients with more accurate and fast diagnosis for LMC than current methods such as magnetic resonance imaging (MRI) which possesses low resolution for the application.
Fig. 3.
A: the Wilkoxon rank sum tests of 7-day LMC group (top) and 3-day LC group (bottom) were performed. The x and y axes represent the ppm axis, and the log of 1-P values, respectively. Values with. P values smaller than 0.01 are shown as blue dots. B: Marker metabolites profile for the LMC group. The actual levels of the LC marker metabolites are exhibited with corresponding peaks. Blue-normal; green- 3-day LMC; red-7-day LMC. Figure obtained from reference [42]. Permission pending.
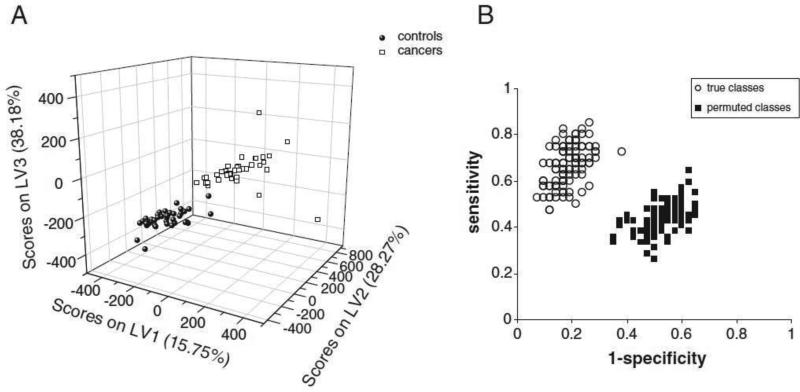
Bladder cancer diagnosis is another example where NMR-based metabolomic analysis can provide an exceptionally sensitive and specific noninvasive monitoring approach [43]. Metabolomics enables analysis of a significant number of small molecules in one step, which presents vast potential for exploring marker compounds to monitor a treatment response and recurrence in patients suffering from bladder cancer [44]. Zhang et al.,[44] profiled the metabolites in urine of dogs with transitional cell carcinoma (TCC) which was verified to be similar with human invasive bladder cancer [45] and control dogs utilizing NMR and statistical analysis methods. For the NMR approach, dog urine was stabilized with phosphate buffer to produce adequate 1H NMR spectra and twenty-one metabolites were subsequently dereplicated by comparison of the acquired and reported NMR spectroscopic data. Consecutively, all the NMR spectra were analyzed by a pertinent statistical approach, orthogonal signal correction pretreated Partial Least Squares-Discriminant Analysis (OSC-PLS-DA), to discover the significant difference between the urine of dogs with TCC from healthy controls. The predictions for the true class assigned models and permuted models were visualized utilizing in a Receiver Operating Characteristic (ROC) space (Fig. 4B) to further validate the abovementioned statistical analysis (i.e., OSC-PLS-DA analysis). The permuted model resulted in clustered pattern at the center of the ROC, which indicates no discrimination. The true class assigned models displayed high sensitivity and specificity, verifying the sensible classification capacity of the employed statistical model.
Fig. 4.
(A) OSC-PLS-DA score plot, and (B) Monte Carlo Cross Validation (MCCV) prediction results of the PLSDA model plotted as sensitivity vs 1-specificity utilizing the 1H NMR spectra of samples from 42 control dogs and 40 dogs with TCC. Figure obtained from reference [46]. Permission pending.
A review of the patent literature reveals an increasing number of metabolomics-based applications, with the majority being focused toward clinical disease detection. In most clinical cases, the earlier the disease is diagnosed the greater the patient's prognosis improves. This is especially true of cancers arising from four major sites: lung, colorectum, breast, and prostate [47].
Targeting lung cancer Imaizumi et al [48] patented a screening method where by a patient's blood sample would be screened for the whole amino acid profile and analyzed by multivariate analysis to discriminate between lung cancer and specific stages. Approximately half of all lung cancers are detected at such a late stage they are inoperable, but if detected at clinical stage IA the mean patient survival rate nears 90%. Their process is non-invasive and allows for the potential detection of lung cancer before any of the usual clinical markers are apparent [48].
Fedorak and Wang [49] patented a diagnostic screen for colorectal cancer and colorectal polyps by metabolomic analysis of 69 metabolites in a patients urine sample. Their screen is non-invasive and can potentially detect colorectal cancer at a much earlier stage than current methods such as fecal occult blood tests or colonoscopy [49]. Their improved screening method has the potential to help curtail morbidity rates from colorectal cancer, a leading cause of cancer morbidity [50]. Raftery et al. [51] patented a method for the early detection of biomarkers indicative of breast cancer from a patient's serum sample. Using a combinational analytical approach employing two-dimensional gas chromatography-mass spectrometry and nuclear magnetic resonance to obtain metabolic profile of the patent's serum which is then analyzed by multivariate statistical methods targeting a mixture of 40 metabolites [51].
Targeting prostate cancer Weinberger et al. [52] filed a patent detailing a metabolomics screening procedure in which a patient blood serum was subjected to combinatorial instrument screening (e.g. HPLC-MS and NMR) to assess 221 specific metabolites as biomarkers for the diagnosis of prostate cancer [52]. The most important similarity that these methods have for the detection of the four major cancer sites are that they are non-invasive and can potentially detect at a much earlier stage in the cancer's progression than currently used methods.
Other metabolomics-based patents targeting disease diagnosis of non-cancerous origin include the screen developed by Lundin and Weinberger [53] to assess kidney disease by screening blood and urine samples for a mixture of biomarkers consisting of two amino acids, two acylcarnitines and two biogenic amines [53]. Their screen allows for staging of the disease to be performed, as well as early stage detection capabilities. Additionally, Cezar [54] patented a method for the non-invasive analysis of multiple biofluids (e.g. amniotic fluid, blood, plasma, urine, etc.) for the metabolomic signature indicative of autism. PCA identified 6,000 statistically significant metabolic features between autistic and non-autistic controls of which they further focused by use of LC-ESI-TOF-MS and HILIC (still allowing for the use of alternative instrumentation for metabolite profiling) on 98 HILIC specific metabolites and 47 C18 specific metabolites for screening [54]
3.4.2 NMR Based Plant Metabolomics
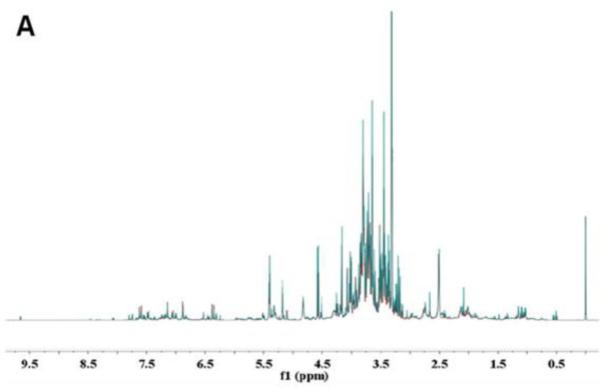
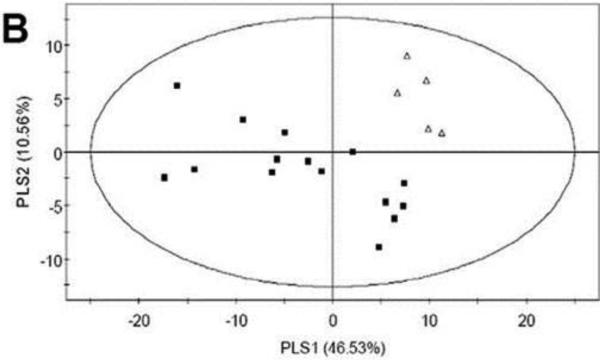
Plant metabolome-based drug discovery is challenging because of the inclusion in a complex matrix consisting of many uncharacterized secondary metabolites with a wide dynamic range of variations of major compounds, minor compounds, polarity, boiling and melting points, etc. To address this demand, NMR-based metabolomics could be instrumental in comprehensive qualitative and quantitative analyses of the vast metabolites originating from plants because reproducibility is thought to be the most critical prerequisite for formulating metabolomics-based drug discovery research. Furthermore, NMR-based metabolomics could be more useful in deciphering complex plant metabolisms when it is manipulated in the combination with multivariate data analysis. Pan et al., [55] demonstrated an application of NMR-based metabolomics with the combination of multivariate data analysis for the quantitative analyses of monoterpenoid indole alkaloid (MIA) from Catharanthus roseus, which has been proven to produce vinblastine through the MIA pathways. The authors designed two types of a transgenic plant overexpressing ORCA3 (Octadecanoid-derivative Responsive Catharanthus AP2-domain), a key regulator of several crucial genes in MIA biosynthesis including DXS, AS, TDC, STR and D4H, and co-overexpressing ORCA3 and G10H (geraniol 10-hydroxylase), which catalyzes the first step of the MIA biosynthesis pathway. Metabolites from each overexpressing plant tissue were measured and analyzed utilizing NMR and a multivariate analysis method, PLS-DA (Fig. 5B). Apparently, 1H NMR spectra of the co-overexpressing transgenic plant and the control appeared similar (Fig. 5A), in-depth analysis of the spectra datasets employing squares-discriminant analysis (PLS-DA) revealed a distinct metabolomic separation between the cooverexpressing transgenic plant and control (Fig. 5B). Additional PLS-DA loading plot analysis found that signals of alanine, glutamic acid, arginine, glucose, sucrose, 2,3-butanediol, quercetin-3-O-glucoside, strictosidine, vindoline and catharanthine were up-regulated in the ORCA3- and G10 co-overexpressing transgenic plant, while the controls displayed enhanced levels of threonine, secologanin, 2,3-DHBA, chlorogenic acid, 4-O-caffeoyl quinic acid, malic acid and fumaric acid. These metabolic discriminations suggests that ORCA3 and G10H cooverexpression enhancement of MIA biosynthesis could affect other metabolic pathways in C. roseus metabolism.
Fig. 5.
A: 1H-NMR spectra of the co-overexpressing transgenic plant (in green) and control (in red) lines. B: Score plot of PLS-DA of the co-overexpressing transgenic plant (Δ) and control (■) lines. Figure obtained from reference [55]. Permission pending.
3.5 Integrated Approaches
The famous quote by Aristotle “The whole is greater than the sum of its parts” is uniquely expressed when analytical technologies are combined in metabolomics studies. Recently, a metabolomics study utilizing GC-MS and LC-MS analysis, data alignment software (MetMAX Beta 1.0) and the multivariate statistical analysis software (COVAIN 1.0), determined the chemical composition of a premenstrual syndrome (PMS) medication, to be inconsistent between different pharmaceutical vendors. The integrated metabolomics platform provided the highest resolution of chemical composition in each medicine and provided data suggesting medicinal values would vary between vendors [56].
3.6 Computational Tools
The composite nature of the data resulting from metabolomics-based analysis is sufficiently complex as to require methods of statistical multivariate data analysis to interpret. PCA is the prevailing method for reducing data dimensionality, though other data-mining techniques such as clustering algorithms (hierarchical clustering, tree clustering, K-means, etc.) are routinely used [57, 58]. With PCA, major sample components are structured to represent the data variance in a two-/three-dimensional coordinate scheme. This technique reveals grouping patterns of samples and observational events that can visually discern outliers which may indicate those samples to be potential sources for novel natural products and thus valuable targets for subsequent analysis [59]. The overall goal of PCA is to reduce the dimensionality of a dataset, while retaining data quality. In datasets containing several groups of variables, some variables often show redundant information. In mass spectra, the variables are the intensities at specific masses. PCA reduces the number of dependent variables in the set by replacing groups of inter-correlated variables with a single new variable, reducing convoluted variables into manageable principal components. Excellent PCA software tools are widely available, (e.g., ClinprotTool 2.0; Bruker Daltonics) and can substantially improve the quality and efficiency of metabolomics platforms. In a study of Ontario ginseng (Panax quinquefolius L.) [60], PCA analysis of 1H-NMR spectra elucidated unique biomarkers between closely-related landraces supporting possible improvement in quality assessment and species authentication.
4. Applications in Phylogeny
Metabolomic analysis evaluates organisms at the system level with the unique ability of providing a snapshot of the functional genetic status of the organism by examining its metabolic profile. An important application of this research is its use in further resolving phylogenetic associations based solely upon classical genomic sequencing. A prominent example would be in cases of horizontal gene transfer, commonly seen as the transfer of peripheral genes [61-63]. A reported example of horizontal gene transfer is the genetic cluster coding for the production of sterigmatocystin, a highly toxic aflatoxin precursor, from Aspergillus nidulans being identified in Podospora anserina [64].
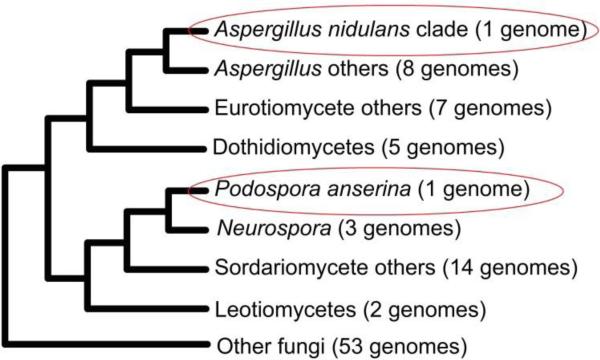
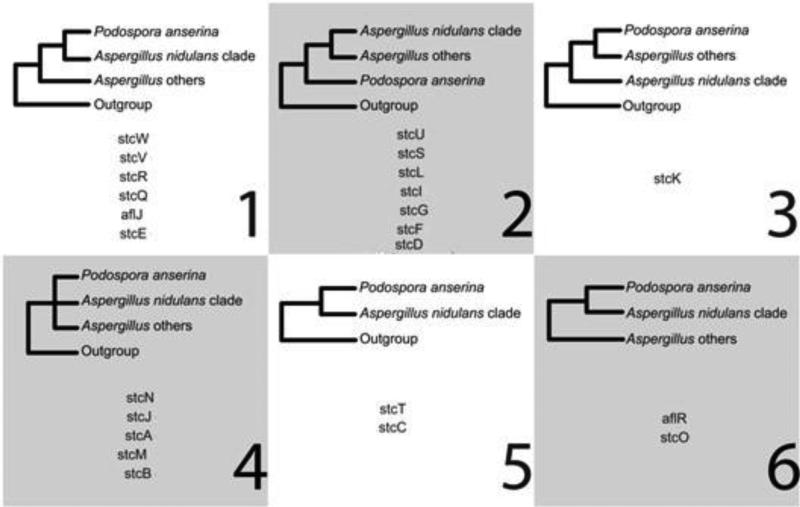
Genomically, A. nidulans and P. anserina are highly divergent species (Fig. 6), however Slot et al. [64] observed the existence of an intact 24 gene cluster encoding for the production of sterigmatocystin in P. anserina that was analogous to the cluster found in A. nidulans. In addition, the extremely high degree of genetic conservation displayed by the observed cluster in terms of both gene order and orientation was especially interesting as they did not find similar clusters beyond the Aspergillus lineage. By employing a phylogenetic analysis of 23 cluster genes, they revealed six topological patterns (Fig. 7) supporting their hypothesis that the ability of P. anserina to produce sterigmatocystin was obtained by a horizontal gene transfer from A. nidulans. Ultimately, this represents an example of two otherwise metabolically dissimilar species that would be phylogenetically clustered if assigned based upon all or portions this horizontally transferred genomic region.
Fig. 6.
Genomic phylogenies of evaluated fungal species. Figure obtained/modified from reference [64]. Permission pending.
Fig. 7.
Cluster gene supported phylogenies. Figure obtained/modified from reference [64]. Permission pending
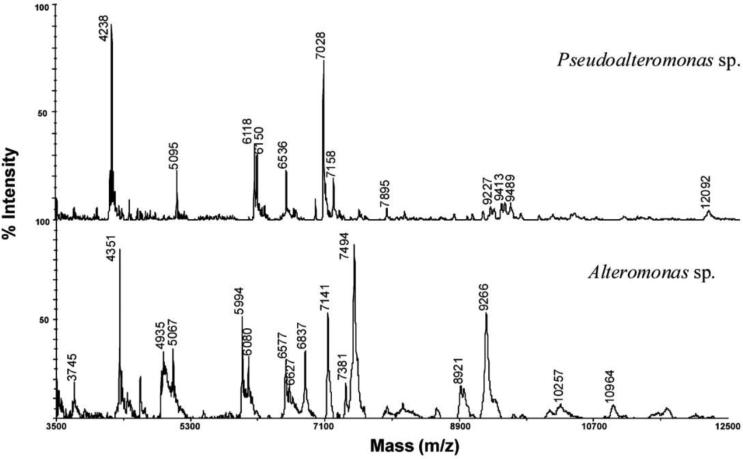
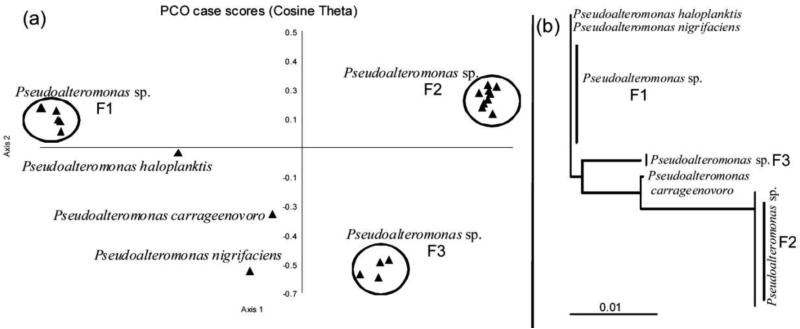
Metabolomics can also aid in discriminating phylogenetic associations in cases where genomic sequence diversity is either too low or too similar for efficient resolution. A study by Dieckmann et al. [65] of numerous bacteria isolated from marine sponges unequivocally resolved several species problematic to resolve genetically due to extreme relatedness (e.g. 99.6% identity in 1400 bp 16S rDNA sequencing) [65, 66]. They found incorporating metabolomic analysis by use of intact cell MALDI-TOF-MS to be effective in producing additional phenotypic markers to quickly and reliably discriminate between species due to their unique metabolite profile. For example, when they compared the metabolomic fingerprints of Pseudoalteromonas species and Alteromonas species there were no overlapping biomarkers observed (Fig. 8). Furthermore, metabolomic analysis can readily differentiate between Pseudoalteromonas species that are both difficult and laborious to discriminate using classical genetic methods (Fig. 6).
Fig. 8.
MALDI-TOF-MS fingerprint analysis of Pseudoalteromonas sp. and Alteromonas sp. Figure obtained/modified from [65]. Permission pending.
In their study, Dieckmann et al., [65] mixed a portion of their bacterial isolates with matrix solution and spotted directly onto a target well of a sample plate. After allowing the sample/matrix mixture to air dry it was analyzed by MALDI-TOF-MS. Their mass spectra data was obtained using a linear delayed extraction mode and they averaged 100 sample sites along the width of the target well focusing on a mass range of 2000-20000 m/z.
The MS data was then analyzed by multivariate clustering. Proceeding from baseline correction they ranked the detected metabolite signals relative to computed intensities: the most intense peak was set to 100%, 2000-4000 Da below 40%, 4000-10000 Da below 10%, 10000-20000 Da below 5%. A spectral grouping was defined as metabolic signals between 4000-20000 Da being present as five or more of the most intense signals. The resulting mass-relative intensity lists were then used in a multivariate statistical package (Kovach Computing Services) to construct the subsequent scatter plots and dendrograms (Fig. 9) based upon the MALDI-TOFMS data.
Fig. 9.
(a) Principal coordinate analysis scatterplot of metabolites from Pseudoalteromonas sp. detected by MALDI-TOF-MS. (b) 16S rDNA based phylogenetic tree of Pseudoalteromonas sp. Figure was obtained/modified from [65]. Permission Pending
Perhaps most importantly, metabolomic analysis allows for the examination of emergent functional genomic responses of an organism due to interactions with its environment which results in the development of complex phenotypes [67, 68]. Metabolomic analysis facilitates the combined phenotypic comparison of species-environment interactions with genetic approaches by providing direct links to changes in metabolites and their originating biochemical pathways. This type of analysis ultimately aids in elucidation of gene function and determining effects of genetic alterations [69-71].
5. Applications in Disease Diagnosis
Disease, regardless of its specific origin (e.g. bacterial, viral, acute, chronic, etc.), disrupts normal metabolism and thus presents a potential target for disease diagnosis. Broadly there are two metabolomics profiling strategies for this: (1) metabolic fingerprinting, the metabolites of interest are not known a priori and diagnosis relies on pattern recognition techniques. (2) Metabolites of interest are defined a priori, verified biomarkers, and are precisely quantified. These strategies make it possible to produce metabolic profiles to differentiate signatures from diseased states from those of healthy controls [72, 73].
As the metabolomic profile is the summation of transcriptional, translational, environmental interactions and operates on a measureable timescale of fractions of a second it is the most rapid and sensitive measurement of a systems phenotype [74]. This makes metabolomic analysis an immensely useful tool in assessing the real-time biochemical changes resulting from both disease progression, as well as, therapeutic treatment. Additionally, this type of analysis can be applied towards the diagnosis if complex disease states which do not exhibit a clear genotypic expression, an important example of which would be Parkinson's Disease [75]. Along these lines, preliminary metabolomic profiling has been performed encompassing several diseased states, such as diabetes, cardiovascular disease, Alzheimer's disease and Huntington's disease [73, 76-80].
Metabolomic analysis has been applied to detect early stage biomarker candidates for diabetic kidney disease, which is incurable and affects approximately 33% of type 1 diabetes mellitus patients. However, if diabetic kidney disease is detected early enough (i.e. pre-clinically) its progression can be halted. Currently diabetic kidney disease is clinically detected by abnormally high urinary albumin excretion rates. Using a combination of GC-MS and LC-MS analysis on urine samples, van der Kloet et al. [81] identified a combination of 34 (from an initial 130) biomarker candidates from 52 patients. These metabolomics biomarkers distinguished which patients would develop abnormally high urinary albumin excretion rates from those that would not with 75% accuracy (with a 5.5 year follow up) [81]. A key observation was that subtle metabolic changes preceded clinical presentation of diabetic kidney disease. Similar preclinical biomarkers, which may only be detectable through holistic approaches such as metabolomic analysis, may yet be discovered for numerous other disease states.
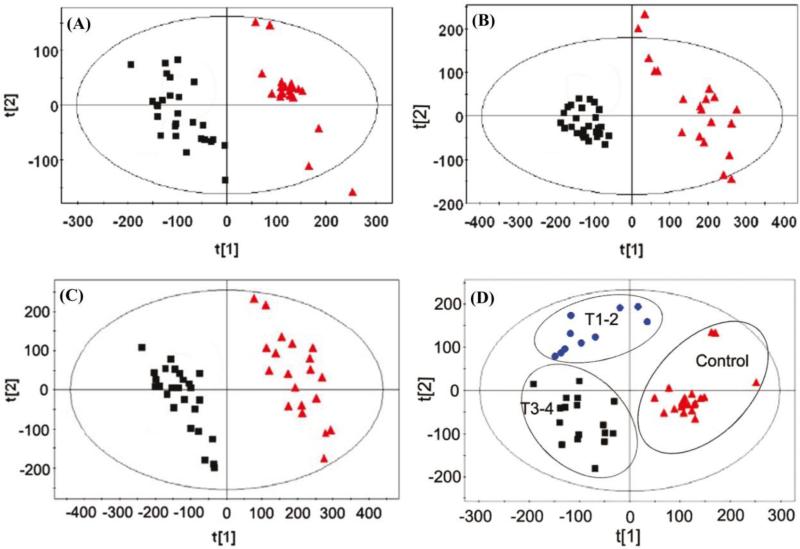
Cancer is a major disease class target for the development of rapid, reliable, non-invasive, methods to detect and differentiate benign and malignant tumors [72, 73]. Metabolomic analysis using LC-MS and multivariate statistical analysis by PCA of patient serum samples allowed for the clear separation of healthy control samples and those of confirmed renal cell carcinoma, even differentiating between healthy/early/late stage renal cell carcinoma [82]. Lin et al. [82] utilized both reversed phase liquid-chromatography (RPLC) and hydrophilic interaction liquid-chromatography (HILIC) coupled mass-spectrometry for the separation of a total of 2140 divergent metabolites from patients serum samples, 1384 from RPLC and 756 from HILIC. The detected metabolites were assessed according to variable importance in the project (VIP) values, which ultimately identified 58 biomarker candidates by RPLC and 36 by HILIC potentially applicable towards the detection of renal cell carcinoma. The data was subsequently analyzed by PCA and partial least-squares-discriminant analysis producing clear separation between the control patients and those with confirmed renal cell carcinoma (Fig. 10 A-C). Furthermore, their targeted metabolomic analysis proved sensitive enough to even discern the stage of cancer progression (Fig. 10 D).
Fig. 10.
Score plot based on (A) RPLC data, (B) HILIC data, and (C) combined data sets (■ renal cell carcinoma patients, ▲ control patients). (D) Staging of patient renal cell carcinoma from combined RPLC/HILLIC-MS data. (▲control patients, ● T1-T2 stage, ■ T3-4 stage). Figure obtained/modified from reference [82]. Permission pending.
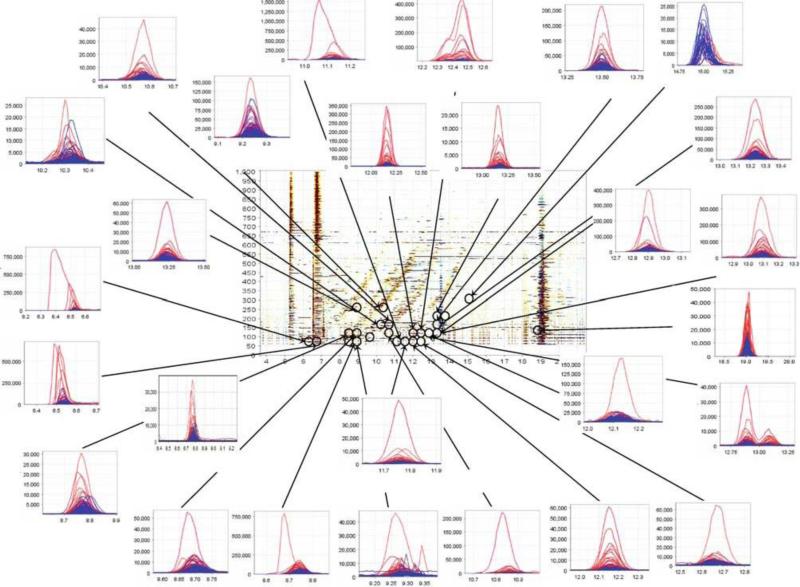
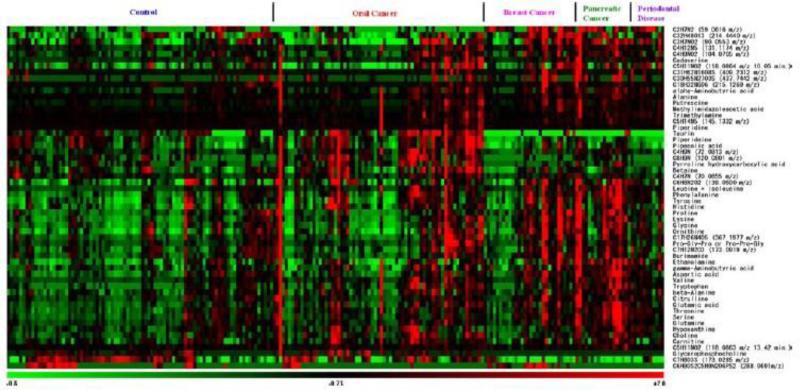
In a similar study targeting cancer, Sugimoto et al. [83] analyzed saliva samples from 69 patients with oral cancer and 87 control patients using capillary electrophoresis time-of-flight mass spectrometry (CE-TOF-MS) to detect biomarker candidates. They detected 3041 peaks per saliva sample, ultimately discriminating 28 metabolites co-occurring in both test groups (Fig. 11). Expanding upon this work they then included 30 breast cancer patients, 18 pancreatic cancer patients, and 11 periodontal disease patients into their saliva test groups. Their CE-TOFMS analysis identified the following number of specific metabolites as potential biomarker candidates: 28 for breast cancer, 48 for pancreatic cancer and 27 for periodontal disease [83]. Subsequently, using a multiple logistic regression model to discern those detected peaks most applicable for discrimination between the test groups settled on 57 peaks that showed a significant difference (p > 0.05) between the control group and one or more disease groups (Fig. 12) [83, 84].
Fig. 11.
CE-TOF-MS profile of salivary metabolites from patients with oral cancer (n = 69) and control samples (n = 87). X axis is migration time and Y axis is m/z. Circled peaks are significantly different (p < 0.05) between the two groups. Red corresponds to oral cancer group and blue to control. Figure obtained/modified from reference [83]. Permission pending.
Fig. 12.
Heat-map of 57 tentative biomarker candidate peaks from 215 patients (control = 85, disease = 128) saliva samples. Columns represent individual patient and rows specific metabolite. Figure obtained/modified from reference [83]. Permission pending.
Ultimately, the capability of metabolomic profiling to assess the real-time biochemical changes may provide earlier opportunities for intervention in disease progression, ideally modifying or even arresting it's course, over the current system of assessing endpoint symptoms of disease states by their clinical manifestations [76, 85].
6. Utility in Natural Products De-replication and Drug Discovery
The inherently complex nature of biological extracts resulting from the search for novel natural products give rise to two inevitable conditions: 1) they will often contain numerous constituents and 2) many of those will be known compounds. Thus, it is extremely valuable to screen the metabolome as early as possible in the natural product discovery process those extracts that are likely to possess novel metabolites from those that are not [65]. Metabolomic capability to analyze at the system level a broad range of metabolites makes it a crucial tool in the de-replication process.
Due to the extreme complexity of natural product extracts there does not exist a single analytical method capable of profiling all metabolites of all extracts at once [86]. However combinatorial chromatographic and spectroscopic techniques such as gas and liquid chromatography, infrared (IR) spectroscopy, mass spectrometry (MS), nuclear magnetic resonance (NMR) spectroscopy and ultraviolet absorption (UV) spectroscopy are proven efficient methods at achieving the most comprehensive analysis of complex extracts [58, 87, 88]. Hyphenated mass spectrometry techniques are routinely used to detect hundreds of metabolites within a single extract. Particularly suited towards metabolome-based natural products characterization is matrix-assisted laser desorption/ionization-time of flight-mass spectrometry (MALDI-TOF-MS). MALDI-TOF-MS is an imaging mass spectrometry technique that allows for the analysis of complex biological mixtures and, most excitingly, is allows for the capability to obtain direct visualization of the spatial distribution of the analyte(s) within the biological matrix [89]. Moreover, this method of data acquisition allows for the unique chemo-spatial examination of, for example, the interplay between microorganism, both inter- and intra-species, and symbiotic associations [90]. This allows for the unambiguous determination of the actual physical source of isolated compounds of interest.
Of distinct value in the characterization of natural products is the use of nuclear magnetic resonance (NMR) spectroscopy, either individually or in a tandem setting. This is due to the capacity of NMR to provide detailed structural information on the individual constituents of complex biological mixtures to a greater extent than that of the preceding techniques [91]. Furthermore, an ideal feature of NMR is the nondestructive nature of its analysis, especially important when samples are derived from organisms that are difficult to culture or obtain [92]. However, access to sufficiently developed and maintained spectral databases is central to the effectiveness of these techniques [93, 94]. This highlights the importance of the development of open access databases where metabolomic data can be maintained and properly annotated [86].
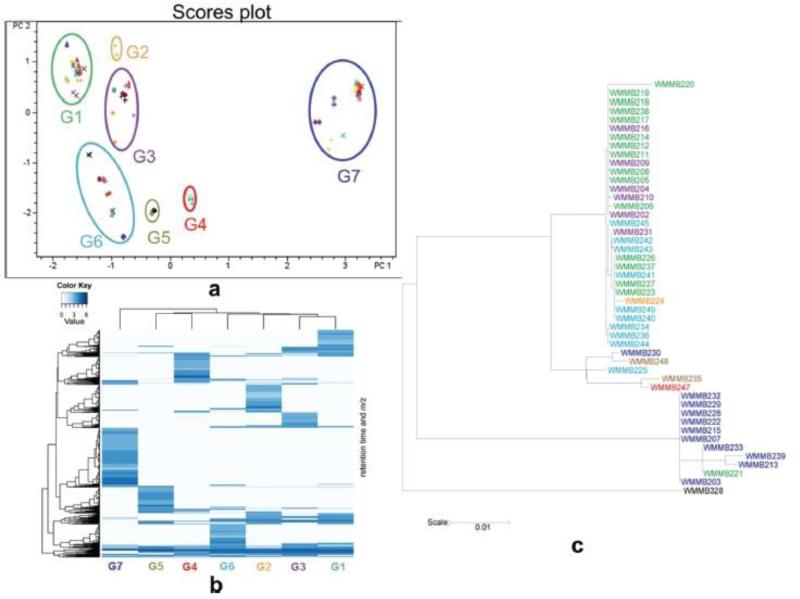
Hou et al. [95] employed LC-MS-PCA as a means of quickly achieving bacterial strain de-replication in their pursuit of novel natural products. Evaluating Micromonospora spp. and Verrucosispora spp. isolated from tropical ascidians they observed that cultivated microbes may appear morphologically different and possess different 16S sequences while still producing the same secondary metabolites. Conversely, strains may appear identical, with identical 16S sequence homology, and produce different secondary metabolites (Fig. 13). Ultimately, as their target was novel natural products (i.e. metabolic end-products) first-pass dereplication by use of metabolomic analysis was far more practical than indirect genetic analysis [95].
Fig. 13.
Isolate de-replication by metabolomic analysis. (a) LC-MS-PCA score plot of 47 strains. (b) Heat-map illustrating metabolic profiles of clusters from PCA, groups 1-7. (c) Phylogenetic tree of strains, colors correspond to metabolomic profiles. Streptomyces sp. (WMMB-328) used as an outgroup. Figure obtained/modified from reference [95]. Permission pending.
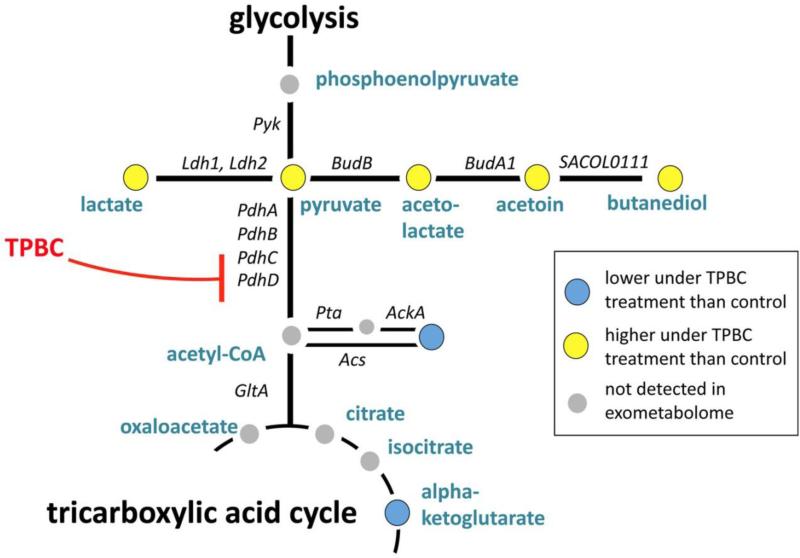
In addition to prioritizing sources of novel natural products, metabolomic analysis can also serve to identify novel mechanisms of action for drugs. Birkenstock et al. [96] investigated the antibacterial activity of triphenylbismuth dichloride (TPBC) against a series of multi-drug resistant bacterial pathogens, such as Staphylococcus aureus, by quantifying the extracellular metabolites of bacterial cultures by 1H NMR. What they observed in cultures treated with TPBC was an alteration in the exometabolome which indicated that TPBC induced a metabolic dysfunction in which glucose oxidation was halted at the pyruvate level, essentially preventing core metabolic activity. By probing the known metabolic pyruvate-pathway of S. aureus they were able to identify bacterial pyruvate dehydrogenase complex as the site of action for TPBC (Fig. 14) and propose the site as a potential drug target in antibiotic-resistant bacteria [96].
Fig. 14.
Schematic representation of the pyruvate-metabolic pathways in S. aureus. Figure obtained/modified from reference [96]. Permission pending.
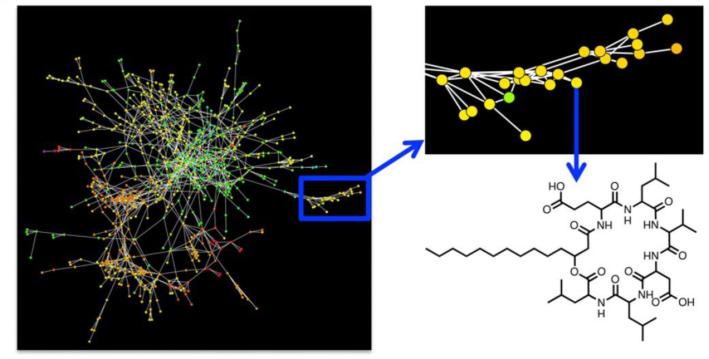
The high-data output of metabolomic screening also makes it ideal for network based analysis. The holistic nature of metabolomics allows for the construction of systems level biological networks to be constructed and queried [40]. From the point of view of natural products research, metabolomically derived spectral networks can readily separate compounds by structural relatedness into discrete clusters, allow the focus on those nodes which represent the most chemically unique structures (Fig. 15) [97].
Fig. 15.
Representative network map where nodes are based on spectral similarity. Figure obtained/modified from reference [97]. Permission pending.
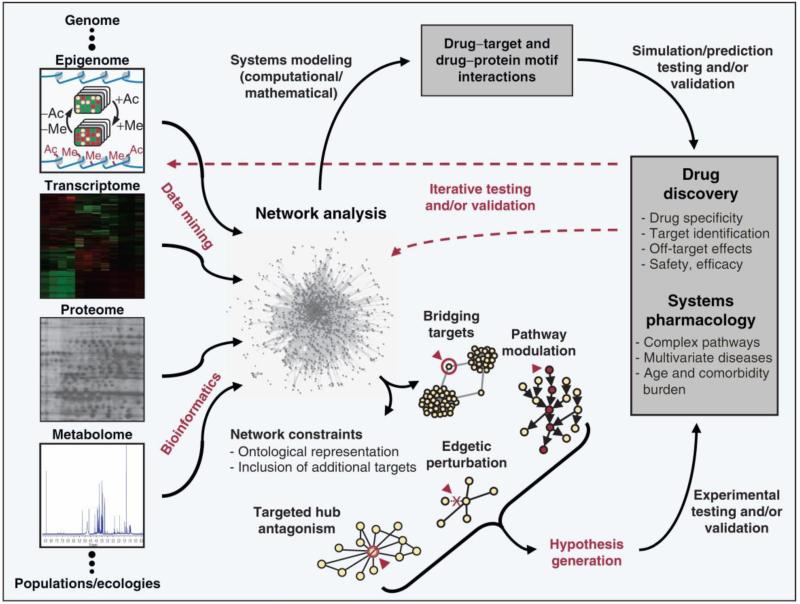
When metabolomic analysis is employed as part of a multi-component network with correlative data from proteomic and genomic analysis, it offers the potential to most closely model complex systems. When coupled with proteomic data such network mapping allows for the querying of potential drugs together with potential protein targets. When coupled with genomic data such network mapping allows for the probing of potential downstream interactions by the perturbation of upstream nodes (Fig. 16) [40].
Fig. 16.
Role of network analysis in systems approach to drug discovery. Figure obtained/modified from reference [40]. Permission pending.
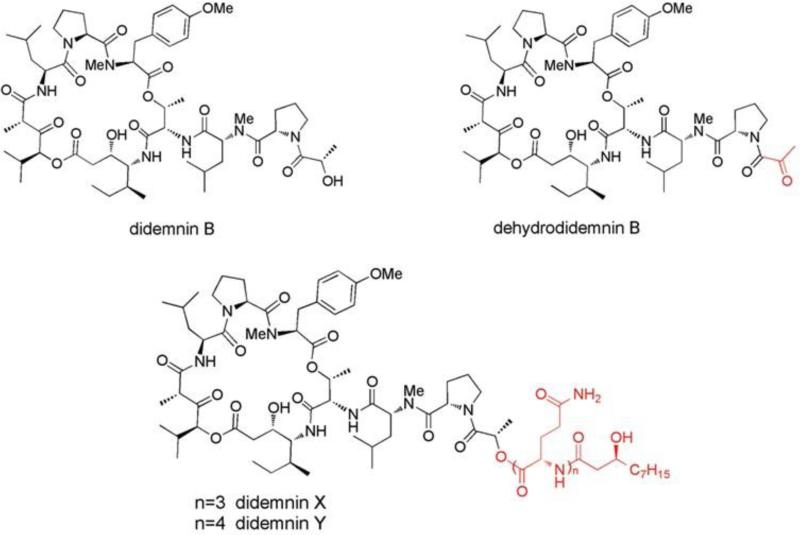
An example of the potential that the combinatorial genomic-metabolomic approach has in natural products drug discovery is the work of Xu, et al. [98] on the didemnins. The didemnins are a family of cyclic depsipeptide compounds originally isolated from the Trididemnum genus of Caribbean tunicates, with preliminary assays showing potent antitumor activity [99]. The most potent was didemnin B, which represents the first natural product isolated from a marine source to enter anticancer clinical trials [100]. However, during Phase II clinical trials cardiac and pulmonary toxicities precluded it from further evaluations [101]. A subsequent didemnin B analogue possessing a modified side-chain (see Fig. 17), dehydrodidemnin B (aplidine/plitidepsin), isolated from a Mediterranean tunicate in the Aplidium genus was found to possess greater antitumor activity and improved safety profile [102-104].
Fig. 17.
Structures of didemnins with side-chain differences from didemnin B noted in red. Figure obtained/modified from reference [98]. Permission pending.
Using the marine bacteria Tistrella mobilis, discovered to biosynthesize didemnin B, Xu et al. [98] utilized 454 pyrosequencing to sequence the complete genome [100]. They developed a biosynthesis model for didemnins based on a non-ribosomal peptide synthetase-polyketide synthase (NRPS-PKS) modular pathway, which they then used to query the genome for the corollary gene cluster [98]. The mapped genome yielded one gene cluster consistent with their NRPS-PKS pathway model [105]. However, the product of the corresponding pathway was not didemnin B but precursors didemnin X and didemnin Y (see Fig. 17).
Examining the metabolomic profile of T. mobilis cultures for didemnin analogues by MALDITOF-MS imaging they observed that didemnin X and didemnin Y were excreted from the bacterial colonies. Moreover, during the time-course disappearance of these metabolites from the culture media they observed a concurrent rise in didemnin B. They also noted that by coupling their identified gene cluster with the observed didemnin metabolic conversion that a single gene inactivation in the NRPS-PKS pathway would alter the downstream biosynthetic pathway from didemnin B to dehydrodidemnin B production. They suggested this could provide a novel alternative to the currently employed multi-step synthetic routes to dehydrodidemnin B, employed due to the scarcity of the natural supply [98].
In summary, metabolomics represents a developing research field involving quantitative and qualitative metabolite assessment with diverse applications. In particular, it is capable of system level metabolic analysis with direct applications towards natural products discovery and detection of disease-related biomarkers with utility in early stage diagnosis. It has growing utility in resolving phylogenetic associations involving horizontal gene transfer and distinguishing subgroups of genera possessing high genetic homology. Additionally, metabolomics is able to provide a snapshot of the functional genetic status of an organism facilitating connections between changes in metabolites, originating biochemical pathways and gene functions to be made. Continued advancements in metabolomic technologies will undoubtedly yield additional improvements in the utility of metabolomics tools as applied toward both scientific and medical research.
Highlights.
Metabolomics is a developing field involving quantitative and qualitative metabolite assessment.
Metabolomics represents a highly adaptable technology with diverse applications.
Metabolomic applications range from phylogenetic assignment of natural products to biomarkers.
Metabolomic analysis provides a view of the functional genetic status of an organism.
Footnotes
Publisher's Disclaimer: This is a PDF file of an unedited manuscript that has been accepted for publication. As a service to our customers we are providing this early version of the manuscript. The manuscript will undergo copyediting, typesetting, and review of the resulting proof before it is published in its final citable form. Please note that during the production process errors may be discovered which could affect the content, and all legal disclaimers that apply to the journal pertain.
References
- 1.Manson JE, Colditz GA, Stampfer MJ, Willett WC, Rosner B, Monson RR, Speizer FE, Hennekens CH. A prospective study of obesity and risk of coronary heart disease in women. N. Engl. J. Med. 1990;322:882–889. doi: 10.1056/NEJM199003293221303. [DOI] [PubMed] [Google Scholar]
- 2.Hinton D, Bacon C. The distribution and ultrastructure of the endophyte of toxic tall fescue. Can. J. Bot. 1985;63:36–42. [Google Scholar]
- 3.Tyree M, Cheung Y, MacGregor M, Talbot A. The characteristics of seasonal and ontogenetic changes in the tissue-water relations of Acer, Populus, Tsuga, and Picea. Can. J. Bot. 1978;56:635–647. [Google Scholar]
- 4.Dudley E, Yousef M, Wang Y, Griffiths W. Targeted metabolomics and mass spectrometry. Adv. Protein Chem. Struct. Biol. 2010;80:45–83. doi: 10.1016/B978-0-12-381264-3.00002-3. [DOI] [PubMed] [Google Scholar]
- 5.Patti GJ, Yanes O, Siuzdak G. Innovation: Metabolomics: the apogee of the omics trilogy. Nat. Rev. Mol. Cell Biol. 2012;13:263–269. doi: 10.1038/nrm3314. [DOI] [PMC free article] [PubMed] [Google Scholar]
- 6.Kell DB. Metabolomics and systems biology: making sense of the soup. Curr. Opin. Microbiol. 2004;7:296–307. doi: 10.1016/j.mib.2004.04.012. [DOI] [PubMed] [Google Scholar]
- 7.Gowda GN, Zhang S, Gu H, Asiago V, Shanaiah N, Raftery D. Metabolomics-based methods for early disease diagnostics. Expert Rev. Mol. Diagn. 2008 doi: 10.1586/14737159.8.5.617. [DOI] [PMC free article] [PubMed] [Google Scholar]
- 8.Trujillo E, Davis C, Milner J. Nutrigenomics, proteomics, metabolomics, and the practice of dietetics. J. Am. Diet. Assoc. 2006;106:403–413. doi: 10.1016/j.jada.2005.12.002. [DOI] [PubMed] [Google Scholar]
- 9.Urano K, Maruyama K, Ogata Y, Morishita Y, Takeda M, Sakurai N, Suzuki H, Saito K, Shibata D, Kobayashi M. Characterization of the ABA-regulated global responses to dehydration in Arabidopsis by metabolomics. Plant J. 2009;57:1065–1078. doi: 10.1111/j.1365-313X.2008.03748.x. [DOI] [PubMed] [Google Scholar]
- 10.Fernie AR, Trethewey RN, Krotzky AJ, Willmitzer L. Metabolite profiling: from diagnostics to systems biology. Nat. Rev. Mol. Cell. Biol. 2004;5:763–769. doi: 10.1038/nrm1451. [DOI] [PubMed] [Google Scholar]
- 11.Devaux P, Horning M, Horning E. Benzyloxime derivatives of steroids. A new metabolic profile procedure for human urinary steroids human urinary steroids. Anal. Lett. 1971;4:151–160. [Google Scholar]
- 12.Cunnick W, Cromie J, Cortell R, Wright B, Beach E, Seltzer F, Miller S. Value of biochemical profiling in a periodic health examination program: analysis of 1,000 cases. Bull. N. Y. Acad. Med. 1972;48:5–22. [PMC free article] [PubMed] [Google Scholar]
- 13.Judy KJ, Schooley DA, Dunham LL, Hall M, Bergot BJ, Siddall JB. Isolation, structure, and absolute configuration of a new natural insect juvenile hormone from Manduca sexta. Proc. Natl. Acad. Sci. U.S.A. 1973;70:1509–1513. doi: 10.1073/pnas.70.5.1509. [DOI] [PMC free article] [PubMed] [Google Scholar]
- 14.Sims JJ, Donnell MS, Leary JV, Lacy GH. Antimicrobial agents from marine algae. Antimicrob. Agents Chemother. 1975;7:320–321. doi: 10.1128/aac.7.3.320. [DOI] [PMC free article] [PubMed] [Google Scholar]
- 15.Kingston DG, Rao MM, Zucker WV. Plant anticancer agents. IX. Constituents of Hyptis tomentosa. J. Nat. Prod. 1979;42:496–499. doi: 10.1021/np50005a010. [DOI] [PubMed] [Google Scholar]
- 16.Vrbanac J, Braselton W, Holland J, Sweeley C. Automated qualitative and quantitative metabolic profiling analysis of urinary steroids by a gas chromatography-mass spectrometry-data system. J. Chromatogr. A. 1982;239:265–276. doi: 10.1016/s0021-9673(00)81987-1. [DOI] [PubMed] [Google Scholar]
- 17.Nicholson J, O'Flynn MP, Sadler P, Macleod A, Juul S, Sonksen P. Proton-nuclear-magnetic-resonance studies of serum, plasma and urine from fasting normal and diabetic subjects. Biochem. J. 1984;217:365–375. doi: 10.1042/bj2170365. [DOI] [PMC free article] [PubMed] [Google Scholar]
- 18.Bales JR, Higham DP, Howe I, Nicholson JK, Sadler PJ. Use of high-resolution proton nuclear magnetic resonance spectroscopy for rapid multi-component analysis of urine. Clin. Chem. 1984;30:426–432. [PubMed] [Google Scholar]
- 19.Bales J, Bell J, Nicholson J, Sadler P, Timbrell J, Hughes R, Bennett P, Williams R. Metabolic profiling of body fluids by proton NMR: self-poisoning episodes with paracetamol (acetaminophen) Magn. Reson. Med. 1988;6:300–306. doi: 10.1002/mrm.1910060308. [DOI] [PubMed] [Google Scholar]
- 20.Sauter H, Lauer M, Fritsch H. Metabolic profiling of plants: a new diagnostic technique. ACS Symposium series-American Chemical Society. 1991;443:288–299. [Google Scholar]
- 21.Smith CA, O'Maille G, Want EJ, Qin C, Trauger SA, Brandon TR, Custodio DE, Abagyan R, Siuzdak G. METLIN: a metabolite mass spectral database. Ther. Drug Monit. 2005;27:747–751. doi: 10.1097/01.ftd.0000179845.53213.39. [DOI] [PubMed] [Google Scholar]
- 22.Sumner LW, Duran AL, Huhman DV, Smith JT. Chapter three metabolomics: a developing and integral component in functional genomic studies of medicago truncatula. Recent Adv. Phytochem. 2002;36:31–61. [Google Scholar]
- 23.Dunn WB, Ellis DI. Metabolomics: current analytical platforms and methodologies. TrAC-Trend Anal. Chem. 2005;24:285–294. [Google Scholar]
- 24.Huenerbein A, Sipoli Marques MA, dos Santos Pereira A, Radler de Aquino Neto F. Improvement in steroid screening for doping control with special emphasis on stanozolol. J. Chromatogr. A. 2003;985:375–386. doi: 10.1016/s0021-9673(02)01801-0. [DOI] [PubMed] [Google Scholar]
- 25.Noguchi Y, Sakai R, Kimura T. Metabolomics and its potential for assessment of adequacy and safety of amino acid intake. J. Nutr. 2003;133:2097S–2100S. doi: 10.1093/jn/133.6.2097S. [DOI] [PubMed] [Google Scholar]
- 26.Dallüge J, Beens J, Brinkman UAT. Comprehensive two-dimensional gas chromatography: a powerful and versatile analytical tool. J. Chromatogr. A. 2003;1000:69–108. doi: 10.1016/s0021-9673(03)00242-5. [DOI] [PubMed] [Google Scholar]
- 27.Adahchour M, Beens J, Vreuls R, Brinkman U. Recent developments in comprehensive two-dimensional gas chromatography (GC × GC): IV. Further applications, conclusions and perspectives. TrAC-Trend Anal. Chem. 2006;25:821–840. [Google Scholar]
- 28.Hu Y, Qi Y, Liu H, Fan G, Chai Y. Effects of celastrol on human cervical cancer cells as revealed by ion-trap gas chromatography–mass spectrometry based metabolic profiling. Biochim. Biophys. Acta, Gen. Subj. 2012;1830:2779–2789. doi: 10.1016/j.bbagen.2012.10.024. [DOI] [PubMed] [Google Scholar]
- 29.Shen Y, Zhang R, Moore RJ, Kim J, Metz TO, Hixson KK, Zhao R, Livesay EA, Udseth HR, Smith RD. Automated 20 kpsi RPLC-MS and MS/MS with chromatographic peak capacities of 1000-1500 and capabilities in proteomics and metabolomics. Anal. Chem. 2005;77:3090–3100. doi: 10.1021/ac0483062. [DOI] [PubMed] [Google Scholar]
- 30.Lu W, Bennett BD, Rabinowitz JD. Analytical strategies for LC–MS-based targeted metabolomics. J. Chromatogr. B. 2008;871:236–242. doi: 10.1016/j.jchromb.2008.04.031. [DOI] [PMC free article] [PubMed] [Google Scholar]
- 31.Zhou B, Xiao JF, Tuli L, Ressom HW. LC-MS-based metabolomics. Mol. Biosyst. 2012;8:470–481. doi: 10.1039/c1mb05350g. [DOI] [PMC free article] [PubMed] [Google Scholar]
- 32.Scigelova M, Hornshaw M, Giannakopulos A, Makarov A. Fourier transform mass spectrometry. Mol. Cell. Proteomics. 2011;10 doi: 10.1074/mcp.M111.009431. [DOI] [PMC free article] [PubMed] [Google Scholar]
- 33.Hu Q, Noll RJ, Li H, Makarov A, Hardman M, Graham Cooks R. The Orbitrap: a new mass spectrometer. J. Mass Spectrom. 2005;40:430–443. doi: 10.1002/jms.856. [DOI] [PubMed] [Google Scholar]
- 34.March RE. Quadrupole ion trap mass spectrometry: a view at the turn of the century. Int. J. Mass Spectrom. 2000;200:285–312. [Google Scholar]
- 35.Douglas DJ, Frank AJ, Mao D. Linear ion traps in mass spectrometry. Mass Spectrom. Rev. 2005;24:1–29. doi: 10.1002/mas.20004. [DOI] [PubMed] [Google Scholar]
- 36.Lacorte S, Fernandez-Alba AR. Time of flight mass spectrometry applied to the liquid chromatographic analysis of pesticides in water and food. Mass Spectrom. Rev. 2006;25:866–880. doi: 10.1002/mas.20094. [DOI] [PubMed] [Google Scholar]
- 37.Wang JH, Byun J, Pennathur S. Analytical approaches to metabolomics and applications to systems biology. Seminars in Nephrology. 2010;30:500–511. doi: 10.1016/j.semnephrol.2010.07.007. [DOI] [PMC free article] [PubMed] [Google Scholar]
- 38.Brown M, Wedge DC, Goodacre R, Kell DB, Baker PN, Kenny LC, Mamas MA, Neyses L, Dunn WB. Automated workflows for accurate mass-based putative metabolite identification in LC/MS-derived metabolomic datasets. Bioinformatics. 2011;27:1108–1112. doi: 10.1093/bioinformatics/btr079. [DOI] [PMC free article] [PubMed] [Google Scholar]
- 39.Kaddurah-Daouk R, Kristal BS, Weinshilboum RM. Metabolomics: a global biochemical approach to drug response and disease. Annu. Rev. Pharmacol. Toxicol. 2008;48:653–683. doi: 10.1146/annurev.pharmtox.48.113006.094715. [DOI] [PubMed] [Google Scholar]
- 40.Arrell D, Terzic A. Network systems biology for drug discovery. Clin. Pharmacol. Ther. 2010;88:120–125. doi: 10.1038/clpt.2010.91. [DOI] [PubMed] [Google Scholar]
- 41.O'Sullivan A, Willoughby RE, Mishchuk D, Alcarraz B, Cabezas-Sanchez C, Condori RE, David D, Encarnacion R, Fatteh N, Fernandez J, Franka R, Hedderwick S, McCaughey C, Ondrush J, Paez-Martinez A, Rupprecht C, Velasco-Villa A, Slupsky CM. Metabolomics of cerebrospinal fluid from humans treated for rabies. J. Proteome Res. 2012;12:481–490. doi: 10.1021/pr3009176. [DOI] [PMC free article] [PubMed] [Google Scholar]
- 42.Cho HR, Wen H, Ryu YJ, An YJ, Kim HC, Moon WK, Han MH, Park S, Choi SH. An NMR metabolomics approach for the diagnosis of leptomeningeal carcinomatosis. Cancer Res. 2012;72:5179–5187. doi: 10.1158/0008-5472.CAN-12-0755. [DOI] [PubMed] [Google Scholar]
- 43.Van Q, Veenstra T, Issaq H. Metabolic profiling for the detection of bladder cancer. Curr. Urol. Rep. 2011;12:34–40. doi: 10.1007/s11934-010-0151-3. [DOI] [PubMed] [Google Scholar]
- 44.Zhang J, Wei S, Liu L, Nagana Gowda GA, Bonney P, Stewart J, Knapp DW, Raftery D. NMR-based metabolomics study of canine bladder cancer. Biochim. Biophys. Acta, Mol. Basis Dis. 2012;1822:1807–1814. doi: 10.1016/j.bbadis.2012.08.001. [DOI] [PubMed] [Google Scholar]
- 45.Knapp DW, Glickman NW, DeNicola DB, Bonney PL, Lin TL, Glickman LT. Naturally-occurring canine transitional cell carcinoma of the urinary bladder A relevant model of human invasive bladder cancer. Urol. Oncol. 2000;5:47–59. doi: 10.1016/s1078-1439(99)00006-x. [DOI] [PubMed] [Google Scholar]
- 46.Hnatyshyn S, Shipkova P. Automated and unbiased analysis of LC-MS metabolomic data. Bioanalysis. 2012;4:541–554. doi: 10.4155/bio.12.9. [DOI] [PubMed] [Google Scholar]
- 47.Jemal A, Siegel R, Ward E, Hao Y, Xu J, Murray T, Thun MJ. Cancer statistics, 2008. CA Cancer J. Clin. 2008;58:71–96. doi: 10.3322/CA.2007.0010. [DOI] [PubMed] [Google Scholar]
- 48.Imaizumi A, Ono N, Sakai R, Ando T, Okamoto N, Imamura F, Higashiyama M. Lung cancer evaluating apparatus, method, system, and program recording medium therefor. 2010 US 2010/0017144A1.
- 49.Fedorak RN, Wang E. Methods for the assessment of colorectal cancer and colorectal polyps by measurement of metabolites in urine. 2013 US 2013/0065320A1.
- 50.Potter MB. Strategies and resources to address colorectal cancer screening rates and disparities in the United States and globally. Annu. Rev. Public. Health. 2013;34:413–429. doi: 10.1146/annurev-publhealth-031912-114436. [DOI] [PubMed] [Google Scholar]
- 51.Raftery MD, Asiago VM, Gowda GAN, Alvarado L. Early detection of recurrent breast cancer using metabolite profiling. 2013 doi: 10.1158/0008-5472.CAN-10-1319. US 2013/0023056. [DOI] [PMC free article] [PubMed]
- 52.Weinberger K, Deinger H, Igwe EI, Enot D, Dallmann G, Klocker H. Diagnosing prostate cancer relapse. 2012 US 2012/0326025A1.
- 53.Lundin U, Weinberger K. New biomarkers for assessing kidney disease. 2012 US 2012/0129265A1.
- 54.Cezar GG. Molecule biomarkers of autism. 2012 US 2012/0190055A1.
- 55.Pan Q, Wang Q, Yuan F, Xing S, Zhao J, Choi YH, Verpoorte R, Tian Y, Wang G, Tang K. Overexpression of ORCA3 and G10H in Catharanthus roseus plants regulated alkaloid biosynthesis and metabolism revealed by NMR-metabolomics. PLoS One. 2012;7:e43038. doi: 10.1371/journal.pone.0043038. [DOI] [PMC free article] [PubMed] [Google Scholar]
- 56.Mari A, Lyon D, Fragner L, Montoro P, Piacente S, Wienkoop S, Egelhofer V, Weckwerth W. Phytochemical composition of Potentilla anserina L. analyzed by an integrative GC-MS and LC-MS metabolomics platform. Metabolomics. 2012:1–9. doi: 10.1007/s11306-012-0473-x. [DOI] [PMC free article] [PubMed] [Google Scholar]
- 57.Böröczky K, Laatsch H, Wagner-Döbler I, Stritzke K, Schulz S. Cluster analysis as selection and dereplication tool for the identification of new natural compounds from large sample sets. Chem. Biodiversity. 2006;3:622–634. doi: 10.1002/cbdv.200690065. [DOI] [PubMed] [Google Scholar]
- 58.Pierens GK, Palframan ME, Tranter CJ, Carroll AR, Quinn RJ. A robust clustering approach for NMR spectra of natural product extracts. Magn. Reson. Chem. 2005;43:359–365. doi: 10.1002/mrc.1562. [DOI] [PubMed] [Google Scholar]
- 59.Krug D, Zurek G, Revermann O, Vos M, Velicer GJ, Müller R. Discovering the hidden secondary metabolome of Myxococcus xanthus: a study of intraspecific diversity. Appl. Environ. Microbiol. 2008;74:3058–3068. doi: 10.1128/AEM.02863-07. [DOI] [PMC free article] [PubMed] [Google Scholar]
- 60.Yuk J, McIntyre KL, Fischer C, Hicks J, Colson KL, Lui E, Brown D, Arnason JT. Distinguishing Ontario ginseng landraces and ginseng species using NMR-based metabolomics. Anal. Bioanal. Chem. 2012:1–11. doi: 10.1007/s00216-012-6582-6. [DOI] [PubMed] [Google Scholar]
- 61.Boto L. Horizontal gene transfer in evolution: facts and challenges. Proc. R. Soc. B: Biol. Sci. 2010;277:819–827. doi: 10.1098/rspb.2009.1679. [DOI] [PMC free article] [PubMed] [Google Scholar]
- 62.Clemente JC, Satou K, Valiente G. Phylogenetic reconstruction from non-genomic data. Bioinformatics. 2007;23:e110–e115. doi: 10.1093/bioinformatics/btl307. [DOI] [PubMed] [Google Scholar]
- 63.Pál C, Papp B, Lercher MJ. Adaptive evolution of bacterial metabolic networks by horizontal gene transfer. Nat. Genet. 2005;37:1372–1375. doi: 10.1038/ng1686. [DOI] [PubMed] [Google Scholar]
- 64.Slot JC, Rokas A. Horizontal transfer of a large and highly toxic secondary metabolic gene cluster between fungi. Curr. Biol. 2011;21:134–139. doi: 10.1016/j.cub.2010.12.020. [DOI] [PubMed] [Google Scholar]
- 65.Dieckmann R, Graeber I, Kaesler I, Szewzyk U, Von Döhren H. Rapid screening and dereplication of bacterial isolates from marine sponges of the Sula Ridge by Intact-Cell-MALDI-TOF mass spectrometry (ICM-MS) Appl. Microbiol. Biotechnol. 2005;67:539–548. doi: 10.1007/s00253-004-1812-2. [DOI] [PubMed] [Google Scholar]
- 66.Gauthier G, Gauthier M, Christen R. Phylogenetic analysis of the genera Alteromonas, Shewanella, and Moritella using genes coding for small-subunit rRNA sequences and division of the genus Alteromonas into two genera, Alteromonas (emended) and Pseudoalteromonas gen. nov., and proposal of twelve new species combinations. Int. J. Syst. Bacteriol. 1995;45:755–761. doi: 10.1099/00207713-45-4-755. [DOI] [PubMed] [Google Scholar]
- 67.Duan L-X, Chen T-L, Li M, Chen M, Zhou Y-Q, Cui G-H, Zhao A-H, Jia W, Huang L-Q, Qi X. Use of the metabolomics approach to characterize Chinese medicinal material Huangqi. Mol. Plant. 2012;5:376–386. doi: 10.1093/mp/ssr093. [DOI] [PubMed] [Google Scholar]
- 68.Fiehn O. Metabolomics–the link between genotypes and phenotypes. Plant Mol. Biol. 2002;48:155–171. [PubMed] [Google Scholar]
- 69.Chang CW, Lyu PC, Arita M. Reconstructing phylogeny from metabolic substrate-product relationships. BMC bioinformatics. 2011;12:S27. doi: 10.1186/1471-2105-12-S1-S27. [DOI] [PMC free article] [PubMed] [Google Scholar]
- 70.Fiehn O, Kopka J, Dörmann P, Altmann T, Trethewey RN, Willmitzer L. Metabolite profiling for plant functional genomics. Nat. Biotechnol. 2000;18:1157–1161. doi: 10.1038/81137. [DOI] [PubMed] [Google Scholar]
- 71.Dixon RA, Sumner LW. Legume natural products: understanding and manipulating complex pathways for human and animal health. Plant Physiol. 2003;131:878–885. doi: 10.1104/pp.102.017319. [DOI] [PMC free article] [PubMed] [Google Scholar]
- 72.Claudino WM, Goncalves PH, di Leo A, Philip PA, Sarkar FH. Metabolomics in cancer: a bench-to-bedside intersection. Crit. Rev. Oncol. Hematol. 2012;84:1–7. doi: 10.1016/j.critrevonc.2012.02.009. [DOI] [PubMed] [Google Scholar]
- 73.Madsen R, Lundstedt T, Trygg J. Chemometrics in metabolomics—a review in human disease diagnosis. Anal. Chim. Acta. 2010;659:23–33. doi: 10.1016/j.aca.2009.11.042. [DOI] [PubMed] [Google Scholar]
- 74.Mamas M, Dunn WB, Neyses L, Goodacre R. The role of metabolites and metabolomics in clinically applicable biomarkers of disease. Arch. Toxicol. 2011;85:5–17. doi: 10.1007/s00204-010-0609-6. [DOI] [PubMed] [Google Scholar]
- 75.Tang CC, Poston KL, Dhawan V, Eidelberg D. Abnormalities in metabolic network activity precede the onset of motor symptoms in Parkinson's disease. J. Neurosci. 2010;30:1049–1056. doi: 10.1523/JNEUROSCI.4188-09.2010. [DOI] [PMC free article] [PubMed] [Google Scholar]
- 76.German JB, Watkins SM, Fay L-B. Metabolomics in practice: emerging knowledge to guide future dietetic advice toward individualized health. J. Am. Diet. Assoc. 2005;105:1425–1432. doi: 10.1016/j.jada.2005.06.006. [DOI] [PubMed] [Google Scholar]
- 77.Wang C, Kong H, Guan Y, Yang J, Gu J, Yang S, Xu G. Plasma phospholipid metabolic profiling and biomarkers of type 2 diabetes mellitus based on high-performance liquid chromatography/electrospray mass spectrometry and multivariate statistical analysis. Anal. Chem. 2005;77:4108–4116. doi: 10.1021/ac0481001. [DOI] [PubMed] [Google Scholar]
- 78.Yuan K, Kong H, Guan Y, Yang J, Xu G. A GC-based metabonomics investigation of type 2 diabetes by organic acids metabolic profile. J. Chromatogr. B. 2007;850:236–240. doi: 10.1016/j.jchromb.2006.11.035. [DOI] [PubMed] [Google Scholar]
- 79.Brindle JT, Antti H, Holmes E, Tranter G, Nicholson JK, Bethell HW, Clarke S, Schofield PM, McKilligin E, Mosedale DE. Rapid and noninvasive diagnosis of the presence and severity of coronary heart disease using 1H-NMR-based metabonomics. Nat. Med. 2002;8:1439–1445. doi: 10.1038/nm1202-802. [DOI] [PubMed] [Google Scholar]
- 80.Han X, M Holtzman D, W McKeel D, Kelley J, Morris JC. Substantial sulfatide deficiency and ceramide elevation in very early Alzheimer's disease: potential role in disease pathogenesis. J. Neurochem. 2002;82:809–818. doi: 10.1046/j.1471-4159.2002.00997.x. [DOI] [PubMed] [Google Scholar]
- 81.van der Kloet F, Tempels F, Ismail N, van der Heijden R, Kasper P, Rojas-Cherto M, van Doorn R, Spijksma G, Koek M, van der Greef J. Discovery of early-stage biomarkers for diabetic kidney disease using ms-based metabolomics (FinnDiane study) Metabolomics. 2012;8:109–119. doi: 10.1007/s11306-011-0291-6. [DOI] [PMC free article] [PubMed] [Google Scholar]
- 82.Lin L, Huang Z, Gao Y, Yan X, Xing J, Hang W. LC-MS based serum metabonomic analysis for renal cell carcinoma diagnosis, staging, and biomarker discovery. J. Proteome Res. 2011;10:1396–1405. doi: 10.1021/pr101161u. [DOI] [PubMed] [Google Scholar]
- 83.Sugimoto M, Wong D, Hirayama A, Soga T, Tomita M. Capillary electrophoresis mass spectrometry-based saliva metabolomics identified oral, breast and pancreatic cancer-specific profiles. Metabolomics. 2010;6:78–95. doi: 10.1007/s11306-009-0178-y. [DOI] [PMC free article] [PubMed] [Google Scholar]
- 84.Spielmann N, Wong DT. Saliva: diagnostics and therapeutic perspectives. Oral Dis. 2011;17:345–354. doi: 10.1111/j.1601-0825.2010.01773.x. [DOI] [PMC free article] [PubMed] [Google Scholar]
- 85.Quinones MP, Kaddurah-Daouk R. Metabolomics tools for identifying biomarkers for neuropsychiatric diseases. Neurobiol. Dis. 2009;35:165–176. doi: 10.1016/j.nbd.2009.02.019. [DOI] [PubMed] [Google Scholar]
- 86.Moco S, Bino RJ, Vorst O, Verhoeven HA, de Groot J, van Beek TA, Vervoort J, De Vos CR. A liquid chromatography-mass spectrometry-based metabolome database for tomato. Plant Physiol. 2006;141:1205–1218. doi: 10.1104/pp.106.078428. [DOI] [PMC free article] [PubMed] [Google Scholar]
- 87.Dias DA, Urban S, Roessner U. A historical overview of natural products in drug discovery. Metabolites. 2012;2:303–336. doi: 10.3390/metabo2020303. [DOI] [PMC free article] [PubMed] [Google Scholar]
- 88.Yuliana ND, Khatib A, Choi YH, Verpoorte R. Metabolomics for bioactivity assessment of natural products. Phytother. Res. 2011;25:157–169. doi: 10.1002/ptr.3258. [DOI] [PubMed] [Google Scholar]
- 89.Gulder TA, Moore BS. Chasing the treasures of the sea—bacterial marine natural products. Curr. Opin. Microbiol. 2009;12:252–260. doi: 10.1016/j.mib.2009.05.002. [DOI] [PMC free article] [PubMed] [Google Scholar]
- 90.Esquenazi E, Yang Y-L, Watrous J, Gerwick WH, Dorrestein PC. Imaging mass spectrometry of natural products. Nat. Prod. Rep. 2009;26:1521–1534. doi: 10.1039/b915674g. [DOI] [PubMed] [Google Scholar]
- 91.Staerk D, Kesting JR, Sairafianpour M, Witt M, Asili J, Emami SA, Jaroszewski JW. Accelerated dereplication of crude extracts using HPLC–PDA–MS–SPE–NMR: quinolinone alkaloids of Haplophyllum acutifolium. Phytochemistry. 2009;70:1055–1061. doi: 10.1016/j.phytochem.2009.05.004. [DOI] [PubMed] [Google Scholar]
- 92.Wishart DS. Quantitative metabolomics using NMR. TrAC-Trend Anal. Chem. 2008;27:228–237. [Google Scholar]
- 93.Imhoff JF, Labes A, Wiese J. Bio-mining the microbial treasures of the ocean: new natural products. Biotech. Adv. 2011;29:468–482. doi: 10.1016/j.biotechadv.2011.03.001. [DOI] [PubMed] [Google Scholar]
- 94.Torras-Claveria L, Berkov S, Jáuregui O, Caujapé J, Viladomat F, Codina C, Bastida J. Metabolic profiling of bioactive Pancratium canariense extracts by GC-MS. Phytochem. Anal. 2010;21:80–88. doi: 10.1002/pca.1158. [DOI] [PubMed] [Google Scholar]
- 95.Hou Y, Braun DR, Michel CR, Klassen JL, Adnani N, Wyche TP, Bugni TS. Microbial strain prioritization using metabolomics tools for the discovery of natural products. Anal. Chem. 2012;84:4277–4283. doi: 10.1021/ac202623g. [DOI] [PMC free article] [PubMed] [Google Scholar]
- 96.Birkenstock T, Liebeke M, Winstel V, Krismer B, Gekeler C, Niemiec MJ, Bisswanger H, Lalk M, Peschel A. Exometabolome analysis identifies pyruvate dehydrogenase as a target for the antibiotic triphenylbismuthdichloride in multiresistant bacterial pathogens. J. Biol. Chem. 2012;287:2887–2895. doi: 10.1074/jbc.M111.288894. [DOI] [PMC free article] [PubMed] [Google Scholar]
- 97.Traxler MF, Kolter R. A massively spectacular view of the chemical lives of microbes. Proc. Natl. Acad. Sci. U.S.A. 2012;109:10128–10129. doi: 10.1073/pnas.1207725109. [DOI] [PMC free article] [PubMed] [Google Scholar]
- 98.Xu Y, Kersten RD, Nam S-J, Lu L, Al-Suwailem AM, Zheng H, Fenical W, Dorrestein PC, Moore BS, Qian P-Y. Bacterial biosynthesis and maturation of the didemnin anti-cancer agents. J. Am. Chem. Soc. 2012;134:8625–8632. doi: 10.1021/ja301735a. [DOI] [PMC free article] [PubMed] [Google Scholar]
- 99.Rinehart KL, Jr, Gloer JB, Hughes R, Jr, Renis HE, McGovren JP, Swynenberg EB, Stringfellow DA, Kuentzel SL, Li LH. Didemnins: antiviral and antitumor depsipeptides from a Caribbean tunicate. Science. 1981;212:933–935. doi: 10.1126/science.7233187. [DOI] [PubMed] [Google Scholar]
- 100.Tsukimoto M, Nagaoka M, Shishido Y, Fujimoto J, Nishisaka F, Matsumoto S, Harunari E, Imada C, Matsuzaki T. Bacterial production of the tunicate-derived antitumor cyclic depsipeptide didemnin B. J. Nat. Prod. 2011;74:2329–2331. doi: 10.1021/np200543z. [DOI] [PubMed] [Google Scholar]
- 101.Williamson SK, Wolf MK, Eisenberger MA, O'Rourke M, Brannon W, Crawford ED. Phase II evaluation of didemnin B in hormonally refractory metastatic prostate cancer. Invest. New Drugs. 1995;13:167–170. doi: 10.1007/BF00872867. [DOI] [PubMed] [Google Scholar]
- 102.Ding X, Vera MD, Liang B, Zhao Y, Leonard MS, Joullié MM. Structure–activity relationships of side-chain modified didemnins. Bioorg. Med. Chem. Lett. 2001;11:231–234. doi: 10.1016/s0960-894x(00)00638-7. [DOI] [PubMed] [Google Scholar]
- 103.Ribrag V, Caballero D, Fermé C, Zucca E, Arranz R, Briones J, Gisselbrecht C, Salles G, Gianni AM, Gomez H. Multicenter phase II study of plitidepsin in patients with relapsed/refractory non-Hodgkin's lymphoma. Haematologica. 2013;98:357–363. doi: 10.3324/haematol.2012.069757. [DOI] [PMC free article] [PubMed] [Google Scholar]
- 104.Zubia E, Ortega MJ, Salva J. Natural products chemistry in marine ascidians of the genus Aplidium. Mini-Rev. Org. Chem. 2005;2:389–399. [Google Scholar]
- 105.Qian P, Xu YS, Lai P. Didemnin biosynthetic gene cluster in tistrella mobilis. 2013 WO 2013041969 A2.


