

Abstract
The microbial world offers a rich source of bioactive compounds for those able to sift through it. Technologies capable of quantitatively detecting natural products while simultaneously identifying known compounds would expedite the search for new pharmaceutical leads. Prior efforts have targeted histone deacetylases in fungi to globally activate the production of new secondary metabolites, yet no study has directly assessed its effects with minimal bias at the metabolomic level. Using untargeted metabolomics, we monitored changes in >1000 small molecules secreted from the model fungus, Aspergillus nidulans, following genetic or chemical reductions in histone deacetylase activity (HDACi). Through quantitative, differential analyses, we found nearly equal numbers of compounds were up- and down-regulated by >100 fold. We detected products from both known and unknown biosynthetic pathways and discovered that A. nidulans is capable of producing fellutamides, proteasome inhibitors whose expression was induced by ~100 fold or greater upon HDACi. This work adds momentum to an ‘omics’-driven resurgence in natural products research, where direct detection replaces bioactivity as the primary screen for new pharmacophores.
INTRODUCTION
Fungal secondary metabolites are a valuable source of bioactive and medically useful compounds. From penicillin to the anti-cholesterol agent lovastatin, fungi have provided high-value lead compounds for the development of pharmaceuticals. Indeed, nearly half of fungal natural products found to date have antibacterial, antifungal, or anti-proliferative activity.1 As more genomic data becomes available for fungi, it is increasingly apparent that we have mined only a fraction of the vast number of secondary metabolites that are genetically encoded.2
A general challenge in the field is to induce expression of new secondary metabolites, many of which are encoded by gene clusters not expressed under typical laboratory conditions.3,4 This severely impairs discovery efforts for natural products. However, unlike bacteria, fungi utilize chromatin to regulate gene expression, a general feature common to eukaryotic organisms.5-7 Enzymes, such as the histone deacetylases (HDACs), are responsible for establishing, maintaining and removing local chromatin modifications that either promote or repress gene transcription. By inhibiting the activity of HDACs, it is believed that large parts of the genome can be converted to a more transcriptionally active state because acetylation is generally associated with pro-transcriptional programs. Several groups have successfully adopted this approach to access cryptic secondary metabolites.8-10 However, only a few global studies of gene expression using RNA profiling11,12 have been performed, and none that use MS-based metabolomics.11,13-15
We used untargeted metabolomics to assess the ability of HDAC inhibition to aid in discovery of secondary metabolites from the model fungus, Aspergillus nidulans.16 Like prior reports12,17-20 we have used broad-spectrum chemical HDAC inhibitors; however, we have also reduced levels of a single HDAC, RpdA (AN4493)7,21 and quantified the changes in expression of secondary metabolomes (Figure 1). Upon rpdA knockdown, we found that 61 compounds have >100 fold increases in their relative levels and 47 have >100 fold decreases. This suggests that though HDAC inhibition generally leads to up-regulation of biosynthetic machinery, as evidenced by transcriptomics, the response at the level of the secondary metabolome is more complex than global increase in abundance of secondary metabolites. We also report a high degree of agreement between chemical HDAC inhibition and RpdA knockdown strategies in the overall response for expression of extracellular metabolites. Finally, we report for the first time that A. nidulans is capable of producing several of the fellutamides, lipopeptide aldehydes that inhibit proteasome activity.22,23
Figure 1.
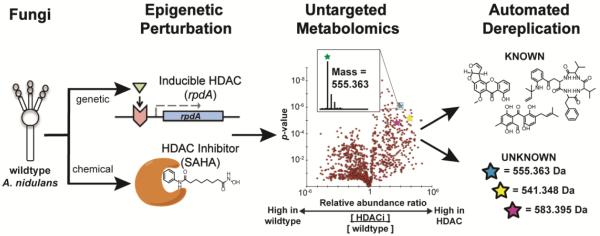
Workflow for an epigenetic approach to fungal natural product discovery. Following epigenetic perturbation by antagonism of histone deacetylases (using either genetic or chemical inhibition), the extracellular metabolome is measured quantitatively using replicate LC-MS runs with high mass accuracy. The results can be visualized in a volcano plot, where each point represents a metabolite that can potentially be annotated by accurate mass and verified by MS2 fragmentation.
RESULTS
Controllable repression of an HDAC
We first wanted to test the effects on the exported metabolome when the activity of the HDAC RpdA was reduced. Since the complete deletion of rpdA is lethal,24 we utilized a strain with the rpdA gene (AN4493) under the control of the xylose-inducible promoter from Penicillium chrysogenum (xylP(p)).24 In this way, we generated a strain, RAAS58.4, where the expression of RpdA could be induced with the addition of xylose. Phenotypically, the uninduced xylP(p)::rpdA strain (grown without xylose) showed decreased radial growth, sparse hyphal structures, poor conidiation, and had increased pigment production (Figure 2, insets at bottom). However, in the presence of xylose, this strain appeared nearly identical to the wildtype strain (Supplementary Figure 1a). Analysis of Northern blots of the xylP(p)::rpdA strain grown without xylose showed that the levels of the rpdA transcript were reduced 14-fold relative to wildtype A. nidulans (Supplementary Figure 1b). Such growths where rpdA is knocked down in expression are referred to as rpdAKD. The impact of altered RpdA levels on the relative levels of >1,100 molecular species in the exported metabolome were determined (Figure 2).
Figure 2.
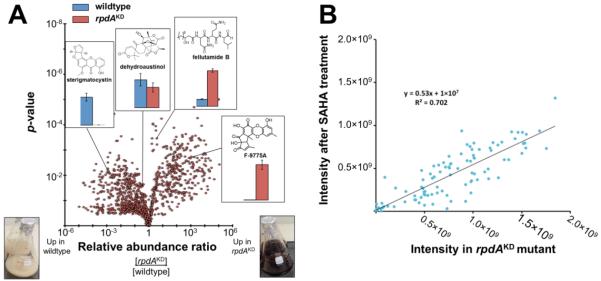
(A) Volcano-plot representation of global changes in the Aspergillus nidulans metabolome in response to reduced expression of rpdA. Displayed in insets are the responses of several known metabolites. Each dot represents an individual compound (within ±3 ppm in mass and ±2 min. in retention time) and the probability of that quantitative observation being statistically significant is indicated by a p-value on the y-axis (determined using the standard linear model within SIEVE software). Compounds observed in the right half of the plot are present at higher levels in the rpdAKD samples. Compounds observed in the left hand portion of the diagram are present at higher levels in the wildtype samples. Also shown are representative liquid GMM growths of wildtype A. nidulans (left) and the rpdAKD strain (right). (B) Correlation of the quantitative responses observed for all compounds that were >5 fold upregulated upon treatment with either 100 μM SAHA (y-axis) or rpdAKD (x-axis).
Global monitoring of the exported metabolome
Combining all strains analyzed, 1,268 unique molecular species were detected by LC-MS. Mass spectrometric signals from different isotope and adduct peaks were combined such that the great majority of these species represent individual compounds produced by the fungus. The intact masses for these compounds were used to search against a database containing the theoretical masses of 104 metabolites known to be produced by A. nidulans. When searching against this targeted database with a mass tolerance of 2 part-per-million (ppm), we putatively identified 49 compounds. In order to verify all annotations based on intact accurate mass, tandem mass spectra were manually interrogated; 45 annotations were validated and are shown in Table 1. The ability of LC-MS/MS with accurate mass (i.e., use of Fourier-transform mass spectrometry) to dereplicate fungal secondary metabolites has recently been demonstrated.25-28 However, annotated MS2 spectra (Supplementary Figures 2 – 8) are included to further validate the ability of tandem MS with manual interpretation to confidently identify known compounds.
Table 1.
Forty-five known compounds confidently identified in rpdaKD vs. wildtype experiments. Compounds are grouped based on common biosynthesis. All compounds shown here have been verified by MS2. Compounds marked with an asterisk (*) have associated MS2 verification shown in the Supplementary Information.
| Compound | Mass (Da) |
Error (ppm) |
Ratio rpdAKD/ WT |
Compound | Mass (Da) |
Error (ppm) |
Ratio rpdAKD/ WT |
|---|---|---|---|---|---|---|---|
| emericellamide A* | 609.4112 | 1.69 | 0.0143 | alternariol | 258.0528 | 0.72 | 288 |
| emericellamide C* | 595.3954 | 1.57 | 0.00583 | arugosin A* | 424.1885 | 0.15 | 0.0459 |
| emericellamide D* | 595.3956 | 1.77 | 0.00947 | arugosin G | 492.2514 | 0.35 | 0.000845 |
| emericellamide E* | 623.427 | 1.91 | 0.015 | arugosin H* | 356.1259 | 0.16 | 0.0564 |
| emericellamide F* | 623.427 | 1.91 | 0.015 | emodin | 270.0528 | 0.98 | 6.64 |
| austinol* | 458.1941 | 0.64 | 0.308 | emericellin | 408.1939 | 0.62 | 0.00466 |
| dehydroaustinol* | 456.1783 | 0.19 | 0.726 | cycloisoemericellin | 406.178 | 0.14 | 0.00733 |
| austinoneol A | 414.2042 | 0.3 | 0.308 | sanghaspirodin A | 512.1107 | 1.97 | 234 |
| austinolide | 442.1993 | 0.39 | 0.48 | violaceol I | 262.0841 | 0.13 | 162 |
| preaustinoid A3 | 456.215 | 0.33 | 0.609 | violaceol II | 262.0841 | 0.12 | 175 |
| psi A beta OR psi B alpha |
296.2351 | 0.24 | 7.75 | F9775A | 396.0845 | 0.61 | 203 |
| psi A alpha | 294.2195 | 0.12 | 7.45 | F9775B | 396.0845 | 0.02 | 173 |
| psi B beta | 298.2508 | 0.36 | 6.24 | unguinol | 326.1153 | 0.25 | 0.0104 |
| psi C alpha | 312.2301 | 0.29 | 15.4 | asperfuranone | 332.1624 | 1.18 | 0.03 |
| aspoquinolone A | 465.2155 | 0.72 | 0.00002 | aspyridone A | 329.1627 | 0.18 | 0.91 |
| aspoquinolone B | 465.2158 | 1.32 | 0.00001 | benzylphenyl-maleic anhydride |
264.0786 | 0.64 | 0.02 |
| aspoquinolone C | 483.2259 | 0.36 | 0.0000003 | nidulalin A | 302.079 | 1.48 | 8.35 |
| aspoquinolone D | 483.2262 | 1.06 | 0.0000004 | terriquinone A | 490.2258 | 0.29 | 0.451 |
| sterigmatocystin* | 324.0634 | 0.04 | 0.00764 | desferritriacetyl-fusigen | 852.4117 | 1.22 | 18.9 |
| nidulanin A* | 603.3423 | 0.34 | 1.16 | triacetylfusigen | 905.3232 | 0.11 | 23.9 |
| nidulanin A + O | 619.3376 | 1.05 | 1.19 | averythrin | 354.1103 | 0.69 | 0.0091 |
| nidulanin A + O2 | 635.3322 | 0.48 | 0.893 | nidurufin | 384.0847 | 0.48 | 4.47 |
| antibiotic 3127* | 541.3481 | 0.96 | 8.58 | ||||
Having dereplicated 45 known A. nidulans metabolites, we next turned to quantitative analysis of these and other metabolites in response to knockdown of rpdA. The results from replicate analyses and ANOVA analysis of wildtype versus rpdAKD extracts are displayed using a volcano plot (Figure 2). Overall reduced expression of rpdA led to a 4-fold increase in metabolite production of over 70% of all compounds identified in this study compared to wildtype; a greater than 10-fold change was observed for over 60% of all compounds identified relative to wildtype. The compounds antibiotic 312729, F9775A and B30 and alternariol31 were only seen at significant levels in the rpdAKD samples. In contrast, several abundant and well studied compounds were present at reduced levels in the rpdAKD samples as compared to wildtype. Production of sterigmatocystin, one of the most thoroughly characterized mycotoxins,32-34 was down-regulated by a factor of over 100 in the rpdAKD strain compared to wildtype (Figure 2A inset and Supplementary Figure 9). The compound 5-hydroxydihydro-sterigmatocystin was similarly down-regulated, in this case by a factor of ~25. A similar pattern was also observed with the emericellamides, the arugosins, the aspoquinolones and the austinols (Supplementary Figure 9).
We observed several general patterns in the comparison of extracts from wildtype and rpdAKD strains. For the 100 most abundant compounds in wildtype, their average expression level decreased by ~50% in the rpdAKD samples. However, the opposite general response was seen for the 100 least abundant compounds in wildtype, whose average intensity increased >60-fold in rpdAKD. For the 100 compounds closest to the median intensity in wildtype, their average abundance increased >3-fold in rpdAKD. In addition to the general trends above, the levels of known compounds were more likely to be down-regulated in the rpdAKD samples than were unknowns (Supplementary Figure 10). The reverse was also true: unknown compounds had a greater chance of being up-regulated by >10 fold in extracts of the rpdAKD strain (Supplementary Figure 10).
Chemical HDAC inhibition causes expression and silencing of many secondary metabolites
Similar to the rpdAKD growths, the addition of chemical HDAC inhibitors, suberanilohydroxamic acid (SAHA), trichostatin A, or sodium butyrate, resulted in slower growth. Unlike the rpdAKD growths, pigmentation was unaltered relative to the wildtype growths. The levels of known metabolites were analyzed to study the effect of chemical HDAC inhibition. The levels of sterigmatocystin and several emericellamides were reduced in all 3 chemical HDAC inhibition samples, consistent with observations in the rpdAKD samples (Supplementary Figure 11). In particular, treatment with SAHA resulted in an up-regulation of a large number of compounds also up-regulated in the rpdAKD samples. In SAHA-treated samples, 167 compounds were found to be present at levels >5 times higher than in wildtype A. nidulans. Of these, 141 were also up-regulated >5-fold in the rpdAKD samples (Figure 2B).
Inhibition of HDAC activity induces production of the fellutamides
We identified dozens of compounds that do not dereplicate to known A. nidulans secondary metabolites, and that were produced at significant levels only in the rpdAKD samples. Many of these were also up-regulated significantly in the chemical HDAC inhibitor-treated samples. Based on intact accurate masses and similarities of fragmentation patterns, we found that A. nidulans is capable of making several of the lipopeptide aldehydes known as the fellutamides: fellutamide B (92-fold up-regulated), antibiotic 1656-G (268-fold up-regulated) and antibiotic 3127 (201-fold up-regulated) (Figure 3). Inspection of the chromatographic retention and MS2 fragmentation of a synthetic fellutamide B standard35 verifies the identity of the endogenous compound (Supplementary Figure 12), and strongly supports the annotations of the structurally related compounds identified as antibiotics 1656-G and 3127 (Supplementary Figure 13). The fellutamides, originally isolated from Penicillium fellutanum,36 have also been isolated from other fungi including Aspergillus versicolor,37 which is closely related to A. nidulans. Despite being studied for decades, the ability of A. nidulans to produce the fellutamides has evaded detection until now.
Figure 3.
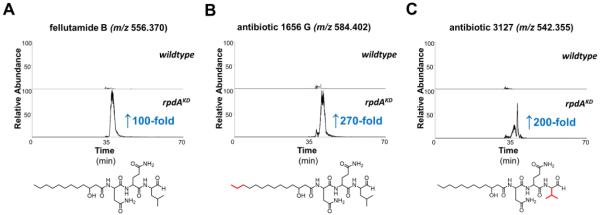
Selected ion chromatograms (SICs) of three fellutamides identified in this work; (A) fellutamide B and (B) antibiotic 1656 G, are fellutamides that were previously not known to be produced by A. nidulans, while (C) antibiotic 3127, is an analogue that was isolated from A. nidulans strain 3127 from a 1991 Japanese Patent38. Structural differences between the three are highlighted in red. See Supplementary Figures 12 and 13 for verification of these fellutamides using tandem MS. Fold changes in expression are lower estimates obtained by taking the ratio of MS signal intensities in samples of rpdAKD to wildtype A. nidulans; no background expression was detected in wildtype samples for antibiotics 1656 G and 3127 (panels B and C), whereas trace levels of fellutamide B were detectable in wildtype (panel A).
DISCUSSION
The use of HDACi to induce expression of cryptic secondary metabolites has proven successful since evidence suggesting its potential started to be published.6 According to this strategy, HDACi increases histone acetylation causing large portions of the fungal genome to become more euchromatic and transcriptionally active. This in turn leads to expression of previously cryptic gene clusters and production of their associated natural products. While this model has been supported by global transcriptomics,11,12 an assessment of the effects of HDACi on the secondary metabolome itself has been lacking until now. Quantitative monitoring of extracellular small molecules following genetic or chemical HDACi revealed both up- and down-regulation in the levels of secondary metabolites.
Upon implementation of genetic approach targeting a specific HDAC, the rpdAKD strain of A nidulans displayed up-regulation of diverse compounds such as alternariol, F9775-A and -B, 3 fellutamides, and ~50 unknown metabolites. Chemical HDACi was found to have analogous effects on the secondary metabolome. For example, treatment with the HDAC inhibitor SAHA led to the up-regulation of many compounds also up-regulated in the rpdAKD strain. Correlation of all compounds >5 fold up-regulated in both SAHA-treated and the rpdAKD strain resulted in a roughly linear relationship (i.e., R2 of 0.7, Figure 2B). Activation of similar compounds at comparable levels suggests that RpdA depletion and non-specific HDACi promote analogous states of hyperacetylation in bulk chromatin and even specific genomic loci.
Intriguingly, another general pattern in the abundance changes of secondary metabolites in both the rpdAKD and chemically HDAC-inhibited strains could be ascertained. Many of the most abundant compounds present in wildtype/control extracts were reduced in HDACi samples, while many low abundance compounds were significantly increased upon HDACi. A potential explanation for this phenomenon may be that as additional secondary metabolism gene clusters are activated upon the stress of HDACi, the building blocks required for production of previously abundant compounds are consumed by other, newly activated pathways.
This study illustrates the importance in the choice of HDAC to target: A. nidulans and most other filamentous fungi harbor 4 classical HDACs, which potentially would result in distinct metabolic profiles upon selective inhibition. Here, the rpdA gene was targeted because deletion of its homolog in Saccharomyces cerevisiae (rpd3) leads to the largest extent of global hyperacetylation, particularly on histones H3 and H4 (unpublished results). From another study, the deletion of the non-essential HDAC, HdaA in A. nidulans, led to increases in two of the three secondary metabolites monitored (penicillin and sterigmatocystin) as determined by thin layer chromatography.6 However, deletion of two other HDACs, HosB and HstA, did not affect levels of penicillin or sterigmatocystin.6
Operationally, treatment with a chemical for non-specific HDACi is more tractable for most labs than genetic manipulation of undomesticated fungal strains. Whether HDACi is superior to other stressors or perturbations of fungi to coax production of new natural products is yet an open question. MS-based metabolomics with accurate mass for discovery of new secondary metabolites is becoming more accessible, and its utility is demonstrated here with the first unambiguous identification of the fellutamides as A. nidulans natural products.
CONCLUSION
Overall, these results provide a deeper view into the complex regulatory mechanisms governing the production of secondary metabolites by large collections of hierarchically regulated fungal genes. Rather than producing the expected global up-regulation of secondary metabolism, reduction of RpdA activity led to selective up-regulation in several compounds, such as F9775-A and -B and three fellutamides. The discovery that the fellutamides are biosynthesized by A. nidulans supports the use of HDAC inhibition for the discovery of cryptic secondary metabolites. In addition, RpdA perturbation led to down-regulation in levels of several known metabolites: chiefly sterigmatocystin and the emericellamides. The ability of differential mass spectrometry to detect and quantify such a large number of structurally diverse metabolites demonstrates its value as a tool for investigating fungal secondary metabolism and its regulation, particularly at an epigenetic level.
To date, many studies that use histone acetylation levels to coax secondary metabolites into expression have relied on levels of gene transcripts as the measure of success for activation of secondary metabolism. While transcript levels do provide some insight into gene-level regulation of secondary metabolism gene clusters, the secondary metabolites themselves are the final products of interest and are ultimately the entities responsible for biological activity. It follows that monitoring changes of the secondary metabolome directly using high performance quantitative mass spectrometry will provide a clear path to discovery of new compounds at a far faster rate than previously possible.
METHODS
Fungal Strains
X79 (rpdA(p)::pyrG::P. chrysogenum xylP(p)::rpdA, pyrG89, riboB2, yA2, chaA1, veA1)24 was crossed with RJMP1.59 (pyrG89, pyroA4, veA)39 to yield the prototroph RAAS58.4 (rpdA(p)::pyrG::P. chrysogenum xylP(p)::rpdA, veA). RJMP103.5 (veA) was used as wildtype for all studies.
Growth and Extraction of Metabolites
250 mL cultures of liquid GMM or GMM + 1% xylose were inoculated with 1 × 10⁶ spores ml−1 and incubated at 250 rpm and 37°C for 96 hours under constant light. For induction of overexpression strains, lactose minimal medium + 30 mM cyclopentanone was used. Mycelia were removed from the culture supernatant using miracloth. The filtrates were extracted overnight with 8:1:1 ethyl acetate: methanol: dichloromethane to prepare total organic extracts. The organic layer was removed and concentrated using a Büchi Rotavapor R-210. For HDAC inhibition, the following compounds were added to RJMP103.5 cultures prepared as above after 24 hours of growth: 10 mM sodium butyrate, 1 µM trichostatin A (TSA), or 100 µM suberanilohydroxamic acid (SAHA). Cultures were grown for an additional 72 hours. Organic extracts were prepared as above.
LC/MS Analysis
Total organic extracts were reduced to dryness and resuspended in methanol to a final concentration of 2 mg mL−1. Forty micrograms of sample was loaded onto a Phenomenex Luna C18 column (150 mm × 2 mm, 3 μm). Analysis was performed using an Agilent 1150 system at a flow rate of 0.2 mL min−1. The following gradient was employed using water/0.1% formic acid (solvent A) and acetonitrile/0.1% formic acid (solvent B): time 0 min., 2% B; 35 min., 70% B; 54 min., 98%B. The LC was placed in-line with a Q-Exactive mass spectrometer for MS analysis. The instrument settings were as follows: capillary temperature 250°C, sheath gas 8 (arbitrary units), spray voltage 4.2 kV. Full MS spectra were acquired at 35,000 resolution for the mass range m/z 200 to 1500 for all samples. Following each full MS scan, the top 5 most intense ions were selected for a dependent MS2 scan. MS2 was conducted using HCD with a normalized collisional energy of 25. Each sample analyzed (e.g., wildtype, rpdAKD, and chemical HDACi) was prepared in biological triplicate each of which were run in technical duplicate.
Informatics and Statistical Treatment of Data for Quantitative Metabolomic Profiling
SIEVE software version 2.0.178 was used for chromatographic alignment, component detection, and relative quantification. Chromatographic alignment was performed for all samples using an initial tile size of 1000 frames. This led to alignment scores >0.95 for all samples with a maximum time correction of 3.25 min. Following alignment, component detection was performed using a mass tolerance of 10 ppm and a retention time window of 3 min. A minimum intensity of 5x10⁶ was selected as the threshold for defining a peak as a component. For each component, a reconstructed ion chromatogram was created and the integrated intensity of the peak was calculated. The integrated intensities for a given component were averaged for each condition. The resulting component ratios and p-values were calculated and plotted on a logarithmic scale to create a volcano plot. This provides a visual representation of both the relative expression level observed as well as the confidence level of that measurement for each metabolite.
For the fellutamides shown in Figure 3, targeted estimates of fold-change were performed manually. When calculating expression ratios for these compounds, if no detectable levels were present in a sample, the baseline noise intensity was used to set a lower bound on the limit of detection.
Construction of Fungal Databases and Compound Dereplication
All components were searched against an accurate mass database consisting of known fungal metabolites using a mass tolerance of 3 part-per-million (ppm). The database was prepared using Antibase,29 Dictionary of Natural Products,38 as well as additional fungal natural products found in the literature.2,40,41 To confirm and evaluate intact mass-based identifications, manual analyses of fragmentation data were performed as described below.
MS/MS Verification Procedure
All compounds putatively identified via accurate intact mass were confirmed using accurate mass, tandem MS (MS2) data. To ensure that low-quality spectra were not included, MS2 spectra containing less than 5 peaks at >1% relative abundance were excluded from analysis. Additionally, spectra containing more than 100 peaks at >1% abundance were included only if >20% of the peaks appeared in the higher m/z half of the spectrum. Structures for putatively identified compounds were fragmented in silico using the software suite Mass Frontier (Thermo Fisher Scientific, Waltham, MA). Both general fragmentation rules and fragmentation library modes were used. When available, comparison with published fragmentation was also performed to confirm identifications further.
Supplementary Material
ACKNOWLEDGEMENTS
We thank the support provided by the National Institutes of Health R01GM067725 to NLK, 5PO1GM084077 to NPK, and by NIH T32 GM07133 and NIH NRSA AI55397 to AAS. We also thank the laboratory of R. Payne for generously providing a synthetic standard of fellutamide B.
Footnotes
ASSOCIATED CONTENT
Supporting Information. Figures display validation of genetic constructs and annotated MS/MS spectra. This material is available free of charge via the Internet at http://pubs.acs.org.
Notes
The authors declare no competing financial interest.
REFERENCES
- 1.Paláez F. In: In Handbook of Industrial Mycology. An Z, editor. Marcel Dekker; New York: 2005. pp. 49–92. [Google Scholar]
- 2.Yaegashi J, Oakley BR, Wang CC. Recent advances in genome mining of secondary metabolite biosynthetic gene clusters and the development of heterologous expression systems in Aspergillus nidulans. J. Ind. Microbiol. Biotechnol. 2014;41:433–442. doi: 10.1007/s10295-013-1386-z. [DOI] [PMC free article] [PubMed] [Google Scholar]
- 3.Giles SS, Soukup AA, Lauer C, Shaaban M, Lin A, Oakley BR, Wang CC, Keller NP. Cryptic Aspergillus nidulans antimicrobials. Appl. Environ. Microbiol. 2011;77:3669–3675. doi: 10.1128/AEM.02000-10. [DOI] [PMC free article] [PubMed] [Google Scholar]
- 4.Lim FY, Sanchez JF, Wang CC, Keller NP. Toward awakening cryptic secondary metabolite gene clusters in filamentous fungi. Methods Enzymol. 2012;517:303–324. doi: 10.1016/B978-0-12-404634-4.00015-2. [DOI] [PMC free article] [PubMed] [Google Scholar]
- 5.Nutzmann HW, Fischer J, Scherlach K, Hertweck C, Brakhage AA. Distinct amino acids of histone H3 control secondary metabolism in Aspergillus nidulans. Appl. Environ. Microbiol. 2013;79:6102–6109. doi: 10.1128/AEM.01578-13. [DOI] [PMC free article] [PubMed] [Google Scholar]
- 6.Shwab EK, Bok JW, Tribus M, Galehr J, Graessle S, Keller NP. Histone deacetylase activity regulates chemical diversity in Aspergillus. Eukaryot Cell. 2007;6:1656–1664. doi: 10.1128/EC.00186-07. [DOI] [PMC free article] [PubMed] [Google Scholar]
- 7.Trojer P, Brandtner EM, Brosch G, Loidl P, Galehr J, Linzmaier R, Haas H, Mair K, Tribus M, Graessle S. Histone deacetylases in fungi: novel members, new facts. Nucleic Acids Res. 2003;31:3971–3981. doi: 10.1093/nar/gkg473. [DOI] [PMC free article] [PubMed] [Google Scholar]
- 8.Bayram O, Krappmann S, Ni M, Bok JW, Helmstaedt K, Valerius O, Braus-Stromeyer S, Kwon NJ, Keller NP, Yu JH, Braus GH. VelB/VeA/LaeA complex coordinates light signal with fungal development and secondary metabolism. Science. 2008;320:1504–1506. doi: 10.1126/science.1155888. [DOI] [PubMed] [Google Scholar]
- 9.Cichewicz RH. Epigenome manipulation as a pathway to new natural product scaffolds and their congeners. Nat. Prod. Rep. 2010;27:11–22. doi: 10.1039/b920860g. [DOI] [PMC free article] [PubMed] [Google Scholar]
- 10.Lee I, Oh JH, Shwab EK, Dagenais TR, Andes D, Keller NP. HdaA, a class 2 histone deacetylase of Aspergillus fumigatus, affects germination and secondary metabolite production. Fungal genetics and biology : FG & B. 2009;46:782–790. doi: 10.1016/j.fgb.2009.06.007. [DOI] [PMC free article] [PubMed] [Google Scholar]
- 11.Lin JQ, Zhao XX, Zhi QQ, Zhao M, He ZM. Transcriptomic profiling of Aspergillus flavus in response to 5-azacytidine. Fungal Genet Biol. 2013;56:78–86. doi: 10.1016/j.fgb.2013.04.007. [DOI] [PubMed] [Google Scholar]
- 12.Fisch KM, Gillaspy AF, Gipson M, Henrikson JC, Hoover AR, Jackson L, Najar FZ, Wagele H, Cichewicz RH. Chemical induction of silent biosynthetic pathway transcription in Aspergillus niger. J. Ind. Microbiol. Biotechnol. 2009;36:1199–1213. doi: 10.1007/s10295-009-0601-4. [DOI] [PubMed] [Google Scholar]
- 13.Sarkar A, Funk AN, Scherlach K, Horn F, Schroeckh V, Chankhamjon P, Westermann M, Roth M, Brakhage AA, Hertweck C, Horn U. Differential expression of silent polyketide biosynthesis gene clusters in chemostat cultures of Aspergillus nidulans. J. Biotechnol. 2012;160:64–71. doi: 10.1016/j.jbiotec.2012.01.015. [DOI] [PubMed] [Google Scholar]
- 14.Bergmann S, Funk AN, Scherlach K, Schroeckh V, Shelest E, Horn U, Hertweck C, Brakhage AA. Activation of a silent fungal polyketide biosynthesis pathway through regulatory cross talk with a cryptic nonribosomal peptide synthetase gene cluster. Appl. Environ. Microbiol. 2010;76:8143–8149. doi: 10.1128/AEM.00683-10. [DOI] [PMC free article] [PubMed] [Google Scholar]
- 15.Szilagyi M, Miskei M, Karanyi Z, Lenkey B, Pocsi I, Emri T. Transcriptome changes initiated by carbon starvation in Aspergillus nidulans. Microbiology. 2013;159:176–190. doi: 10.1099/mic.0.062935-0. [DOI] [PubMed] [Google Scholar]
- 16.Maggio-Hall LA, Hammond TM, Keller NP. Aspergillus nidulans as a model system to study secondary metabolism. Secondary Metabolism in Model Systems. 2004;38:197–222. [Google Scholar]
- 17.Zutz C, Gacek A, Sulyok M, Wagner M, Strauss J, Rychli K. Small chemical chromatin effectors alter secondary metabolite production in Aspergillus clavatus. Toxins (Basel) 2013;5:1723–1741. doi: 10.3390/toxins5101723. [DOI] [PMC free article] [PubMed] [Google Scholar]
- 18.Asai T, Yamamoto T, Shirata N, Taniguchi T, Monde K, Fujii I, Gomi K, Oshima Y. Structurally diverse chaetophenol productions induced by chemically mediated epigenetic manipulation of fungal gene expression. Org. Lett. 2013;15:3346–3349. doi: 10.1021/ol401386w. [DOI] [PubMed] [Google Scholar]
- 19.Chung YM, Wei CK, Chuang DW, El-Shazly M, Hsieh CT, Asai T, Oshima Y, Hsieh TJ, Hwang TL, Wu YC, Chang FR. An epigenetic modifier enhances the production of anti-diabetic and anti-inflammatory sesquiterpenoids from Aspergillus sydowii. Bioorg. Med. Chem. 2013;21:3866–3872. doi: 10.1016/j.bmc.2013.04.004. [DOI] [PubMed] [Google Scholar]
- 20.Henrikson JC, Hoover AR, Joyner PM, Cichewicz RH. A chemical epigenetics approach for engineering the in situ biosynthesis of a cryptic natural product from Aspergillus niger. Org Biomol Chem. 2009;7:435–438. doi: 10.1039/b819208a. [DOI] [PubMed] [Google Scholar]
- 21.Graessle S, Dangl M, Haas H, Mair K, Trojer P, Brandtner E-M, Walton JD, Loidl P, Brosch G. Characterization of two putative histone deacetylase genes from Aspergillus nidulans. Biochimica et Biophysica Acta (BBA) - Gene Structure and Expression. 2000;1492:120–126. doi: 10.1016/s0167-4781(00)00093-2. [DOI] [PubMed] [Google Scholar]
- 22.Lin G, Li D, Chidawanyika T, Nathan C, Li H. Fellutamide B is a potent inhibitor of the Mycobacterium tuberculosis proteasome. Arch. Biochem. Biophys. 2010;501:214–220. doi: 10.1016/j.abb.2010.06.009. [DOI] [PMC free article] [PubMed] [Google Scholar]
- 23.Hines J, Groll M, Fahnestock M, Crews CM. Proteasome Inhibition by Fellutamide B Induces Nerve Growth Factor Synthesis. Chemistry & biology. 2008;15:501–512. doi: 10.1016/j.chembiol.2008.03.020. [DOI] [PMC free article] [PubMed] [Google Scholar]
- 24.Tribus M, Bauer I, Galehr J, Rieser G, Trojer P, Brosch G, Loidl P, Haas H, Graessle S. A novel motif in fungal class 1 histone deacetylases is essential for growth and development of Aspergillus. Molecular biology of the cell. 2010;21:345–353. doi: 10.1091/mbc.E09-08-0750. [DOI] [PMC free article] [PubMed] [Google Scholar]
- 25.Hoffmann T, Krug D, Huttel S, Muller R. Improving Natural Products Identification through Targeted LC-MS/MS in an Untargeted Secondary Metabolomics Workflow. Anal. Chem. 2014;86:10780–10788. doi: 10.1021/ac502805w. [DOI] [PubMed] [Google Scholar]
- 26.Klitgaard A, Iversen A, Andersen MR, Larsen TO, Frisvad JC, Nielsen KF. Aggressive dereplication using UHPLC-DAD-QTOF: screening extracts for up to 3000 fungal secondary metabolites. Anal Bioanal Chem. 2014;406:1933–1943. doi: 10.1007/s00216-013-7582-x. [DOI] [PMC free article] [PubMed] [Google Scholar]
- 27.El-Elimat T, Figueroa M, Ehrmann BM, Cech NB, Pearce CJ, Oberlies NH. High-resolution MS, MS/MS, and UV database of fungal secondary metabolites as a dereplication protocol for bioactive natural products. J. Nat. Prod. 2013;76:1709–1716. doi: 10.1021/np4004307. [DOI] [PMC free article] [PubMed] [Google Scholar]
- 28.Nielsen KF, Mansson M, Rank C, Frisvad JC, Larsen TO. Dereplication of microbial natural products by LC-DAD-TOFMS. J. Nat. Prod. 2011;74:2338–2348. doi: 10.1021/np200254t. [DOI] [PubMed] [Google Scholar]
- 29.Laatsch H. Wiley VCH; Weinheim, Germany: 2011. [Google Scholar]
- 30.Sanchez JF, Chiang YM, Szewczyk E, Davidson AD, Ahuja M, Elizabeth Oakley C, Woo Bok J, Keller N, Oakley BR, Wang CC. Molecular genetic analysis of the orsellinic acid/F9775 gene cluster of Aspergillus nidulans. Mol Biosyst. 2010;6:587–593. doi: 10.1039/b904541d. [DOI] [PMC free article] [PubMed] [Google Scholar]
- 31.Ahuja M, Chiang YM, Chang SL, Praseuth MB, Entwistle R, Sanchez JF, Lo HC, Yeh HH, Oakley BR, Wang CC. Illuminating the diversity of aromatic polyketide synthases in Aspergillus nidulans. J. Am. Chem. Soc. 2012;134:8212–8221. doi: 10.1021/ja3016395. [DOI] [PMC free article] [PubMed] [Google Scholar]
- 32.Brown DW, Yu JH, Kelkar HS, Fernandes M, Nesbitt TC, Keller NP, Adams TH, Leonard TJ. Twenty-five coregulated transcripts define a sterigmatocystin gene cluster in Aspergillus nidulans. P Natl Acad Sci USA. 1996;93:1418–1422. doi: 10.1073/pnas.93.4.1418. [DOI] [PMC free article] [PubMed] [Google Scholar]
- 33.Dezotti NO, Zucchi TM. Identification of Aspergillus nidulans genes essential for the accumulation of sterigmatocystin. Fungal Genetics and Biology. 2001;34:93–105. doi: 10.1006/fgbi.2001.1292. [DOI] [PubMed] [Google Scholar]
- 34.Yu JH, Leonard TJ. Sterigmatocystin biosynthesis in Aspergillus nidulans requires a novel type I polyketide synthase. J Bacteriol. 1995;177:4792–4800. doi: 10.1128/jb.177.16.4792-4800.1995. [DOI] [PMC free article] [PubMed] [Google Scholar]
- 35.Giltrap AM, Cergol KM, Pang A, Britton WJ, Payne RJ. Total Synthesis of Fellutamide B and Deoxy-Fellutamides B, C, and D. Marine Drugs. 2013;11:2382–2397. doi: 10.3390/md11072382. [DOI] [PMC free article] [PubMed] [Google Scholar]
- 36.Shigemori H, Wakuri S, Yazawa K, Nakamura T, Sasaki T, Kobayashi J. i. Fellutamides A and B, cytotoxic peptides from a marine fish-possessing fungus Penicillium fellutanum. Tetrahedron. 1991;47:8529–8534. [Google Scholar]
- 37.Lee YM, Kim MJ, Li H, Zhang P, Bao B, Lee KJ, Jung JH. Marine-derived Aspergillus species as a source of bioactive secondary metabolites. Marine biotechnology. 2013;15:499–519. doi: 10.1007/s10126-013-9506-3. [DOI] [PubMed] [Google Scholar]
- 38.Running WE. Chapman and Hall Dictionary of Natural-Products on Cd-Rom. Journal of Chemical Information and Computer Sciences. 1993;33:934–935. [Google Scholar]
- 39.Palmer JM, Mallaredy S, Perry DW, Sanchez JF, Theisen JM, Szewczyk E, Oakley BR, Wang CC, Keller NP, Mirabito PM. Telomere position effect is regulated by heterochromatin-associated proteins and NkuA in Aspergillus nidulans. Microbiology. 2010;156:3522–3531. doi: 10.1099/mic.0.039255-0. [DOI] [PMC free article] [PubMed] [Google Scholar]
- 40.Andersen MR, Nielsen JB, Klitgaard A, Petersen LM, Zachariasen M, Hansen TJ, Blicher LH, Gotfredsen CH, Larsen TO, Nielsen KF, Mortensen UH. Accurate prediction of secondary metabolite gene clusters in filamentous fungi. Proc Natl Acad Sci U.S.A. 2013;110:E99–107. doi: 10.1073/pnas.1205532110. [DOI] [PMC free article] [PubMed] [Google Scholar]
- 41.Caboche S, Pupin M, Leclere V, Fontaine A, Jacques P, Kucherov G. NORINE: a database of nonribosomal peptides. Nucleic Acids Res. 2008;36:D326–331. doi: 10.1093/nar/gkm792. [DOI] [PMC free article] [PubMed] [Google Scholar]
Associated Data
This section collects any data citations, data availability statements, or supplementary materials included in this article.