Abstract
Purpose
The study objective was to compare different body size descriptors that best estimate vancomycin Vd and clearance (CL).
Methods
Patients between 3 months and 21 years old who received vancomycin for ≥48 hours from 2003 to 2011 were evaluated in this matched case-control study. Cases had body mass index in the ≥85th percentile; controls were nonobese individuals who were matched by age and baseline serum creatinine (SCr). Using a 1-compartment model with first-order kinetics, Bayesian post hoc individual Vd and CL were estimated.
Findings
Analysis included 87 matched pairs with 389 vancomycin serum concentrations. Median ages were 10.0 (interquartile range [IQR], 4.8–15.2) years for cases (overweight and obese children) and 10.2 (IQR, 4.5–14.8) years for controls (normal-weight children). Median weights were 44.0 (IQR, 23.4–78.1) kg for cases and 31.3 (IQR, 16.8–47.1) kg for controls. Mean (SD) for the baseline SCr values were also similar between the groups: 0.51 (0.22) (IQR, 0.34–0.67) mg/dL and 0.48 (0.20) (IQR, 0.30–0.60) mg/dL for the cases and controls, respectively. Actual weight and allometric weight (ie, weight0.75) were used in the final model to estimate Vd and CL, respectively. The mean Vd and CL, based on weight, for cases were lower than controls by 0.012 L/kg and 0.014 L/kg/h, respectively.
Implications
In obese children, actual weight and allometric weight are reasonable, convenient estimations of body fat to use for estimating vancomycin Vd and CL, respectively. However, these pharmacokinetic differences between obese children and those with normal weights are small and may not likely to be clinically relevant in dose variation.
Keywords: antibiotics, children, obesity, pediatrics, pharmacokinetics, Staphylococcus aureus, vancomycin
INTRODUCTION
Vancomycin is a first-line antibiotic for treating invasive methicillin-resistant Staphylococcus aureus infections.1 The pharmacokinetic (PK) profile and dosing information of vancomycin for obese children remain suboptimal. Coupled to the age-related PK variation between adults and children, excessive adipose tissue (ie, obesity) may significantly affect the distribution and clearance of drugs. With the extensive use of vancomycin in pediatrics and an epidemic of obesity, we believe that it is essential to first analyze the PK parameters of vancomycin that are necessary to optimize dosing in obese children, especially in light of limited population-based PK studies.1
Previous PK studies on vancomycin dosing in obese pediatric and adult patients evaluated different body size descriptors (primarily total weight and secondarily lean body mass [LBM] and ideal weight [IW]) for estimating Vd and clearance (CL).2–7 In obese adults, weight-adjusted Vd was decreased, whereas weight-adjusted CL was either similar or decreased.4–7 Pediatric studies did not yield significant conclusions regarding differences in weight-adjusted Vd and CL.2,3,8,9 Notably, none of these pediatric PK studies used Bayesian analysis, which is better in predicting Vd and CL in an obese population based on an understanding of the population PK properties and interindividual and intra-individual variability.
With the limited population-based PK studies that incorporate Bayesian estimation, we aimed to compare 7 different measures of body size descriptors, including actual weight, adjusted weight (AW), IW, allometric weight (ALWT), body mass index (BMI), body surface area (BSA), and LBM, and their influences on vancomycin Vd and CL and in overweight and obese children. Enhancing the accuracy in estimating Vd and CL would result in better empiric dosing recommendation in this population to rapidly achieve a therapeutic exposure without unnecessary vancomycin renal toxicity.
PATIENTS AND METHODS
This matched case-control study was conducted at 2 children’s hospitals. Miller Children’s Hospital of Long Beach is a community-based, tertiary care, teaching hospital with 249 beds (34 pediatric intensive care, 69 neonatal intensive care, 94 general pediatrics, and 52 hematology/oncology beds). Rady Children’s Hospital of San Diego is a tertiary care, teaching hospital with 308 beds (44 pediatric intensive care, 49 neonatal intensive care, 177 general medical/surgical, and 38 hematology/oncology beds). This study was approved by the institutional review boards at these institutions with the use of a waiver of informed consent for retrospective, deidentified data collection and analysis.
As part of routine patient care at Miller Children’s Hospital of Long Beach and Rady Children’s Hospital of San Diego, clinical pharmacists conduct therapeutic drug monitoring for all patients receiving vancomycin. Patients were monitored daily while they were taking vancomycin; blood samples to evaluate vancomycin concentrations were generally obtained after the third dose. The entire dosing history and measured serum concentrations, in the context of the timing of the blood sample after vancomycin infusion, were used in the PK modeling. Renal function was monitored closely using serum creatinine (SCr).
Data Collection
Patients aged 3 months to 21 years were included if they received vancomycin for ≥48 hours from September 1, 2003, through July 30, 2011, and had ≥1 serum vancomycin concentration collected within ≤96 hours of drug therapy initiation. Patients were excluded if they were undergoing hemodialysis or receiving amphotericin B formulations or immunosuppressive medications, including cyclosporine, tacrolimus, and sirolimus, which may have interfered with vancomycin CL within 7 days before or during vancomycin therapy. Demographic characteristics (eg, sex, age, weight, and height) and clinical and laboratory data (eg, SCr and vancomycin concentrations) were extracted for each patient on standardized case report forms. The growth charts from the Centers for Disease Control and Prevention were used to categorize overweight and obesity based on age and sex.10 Overweight was defined as weight or BMI in the 85th to 94.9th percentile and obesity at the ≥95th percentile.11 Actual body weight was used to categorize overweight or obesity in patients <2 years old and BMI for those ≥2 years old. Overweight and obese patients served as cases and were matched to controls consisting of individuals with normal weights. Matching criteria were age (within 1 year), SCr (within 0.4 mg/dL), the use of concurrent nephrotoxic medications, and stay in the intensive care unit. Different measures of body composition were calculated using various equations (Table I).
Table I.
Equations for measures of weight.
| Weight Type | Equation |
|---|---|
| Actual weight | |
| Allometric weight (ALWT)12,13 | ALWT (kg) = Weight (kg)0.75 |
| Body surface area (BSA)14 | BSA (m2) = (Height [cm] × Weight [kg]/3600)0.5 |
| Lean body mass (LBM)15,16 | |
| ≤5 years | LBM (kg) = 0.0817 ×eight (kg)0.6469 × Height (cm)0.7236 |
| >5 years, male | ln(LBM [kg]) = −2.8990 + 0.8064 ln (Height [cm]) + 0.5674 ln(Weight [kg]) + 0.0000185 Weight (kg)2 − 0.0153 BMIz2 + 0.0132 Age (y) |
| >5 years, female | ln(LBM [kg]) = −3.8345 + 0.954 ln (Height [cm]) + 0.6515 ln(Weight [kg]) − 0.0102 BMIz2 |
| Ideal weight (IW)14,17–19 | |
| 1–18 years, <5 ft | IW (kg) = Height (cm)2 × 1.65/1000 |
| 1–18 years, ≥5 ft, male | IW (kg) = 2.27 kg/in × Height (in) above 5 ft + 39 kg |
| 1–18 years, ≥5 ft, female | IW (kg) = 2.27 kg/in × Height (in) above 5 ft + 42.2 kg |
| >18 years, male | IW (kg) = 2.3 kg/in × Height (in) above 5 ft + 50 kg |
| >18 years, female | IW (kg) = 2.3 kg/in × Height (in) above 5 ft + 45.5 kg |
| Adjusted weight(AW) (kg)20 | |
| Weight > IW | AW (kg) = IW (kg) + 0.4 × (Weight [kg] − IW) |
| Weight ≤ IW | AW (kg) = Weight (kg) |
| Body Mass Index (BMI) (kg/m2) | BMI (kg/m2) = Weight (kg)/Height (m)2 |
Population-Based PK Model
Assays to measure serum vancomycin concentrations and SCr at each study site have been published previously.21 Population-based PK analyses were performed using the nonlinear mixed-effect modeling software NONMEM, version 7.2 (Icon, Dublin, Ireland), and Perl-Speaks-NONMEM, version 3.7.6 (Free Software Foundation using General Public License). Because most vancomycin samples were collected after the distribution phase, a 1-compartment model was used to describe the vancomycin PK parameters Vd and CL. On the basis of a large population-based PK study in children, age and SCr were identified as important covariates for CL.21 Consequently, these measures were included as covariates in the base model, and different measures of body size descriptors were evaluated in subsequent intermediate models.
Models were fitted using the first-order conditional estimation subroutine and the interaction option. The maximum a posteriori Bayesian analysis of each patient’s data using the final population model and the POSTHOC option were used to generate the parameter estimates for Vd and CL for each patient. Residual error was modeled with the proportional and combination methods. Weight measures that improved the model fit using a likelihood ratio test with a reduction in the minimum objective function (MOF) of 4 (P ≤ 0.05 for 1 df) were selected for further analysis. The uncertainty in the final model was evaluated using a bootstrap analysis of 1000 replicates selected from our cohort to calculate the 95% CIs for the population estimates. The model was considered reliable if the parameter estimates were within the 95% CIs.
Accuracy, which represents the tendency to over-predict or underpredict a parameter, was calculated by (Xestimated − Xfinal model) ÷ Xfinal model. The boundaries for accuracy used in published reports ranged from <5% to 20%.22–26 In this study, we aimed for <5% accuracy. Data were analyzed between case and control groups using appropriate tests (ie, paired t test for continuous variables and McNemar test for categorical variables with continuity correction). Pearson correlation was used to derive the R2 for the graphs. P = 0.05 for a 2-sided test was assumed when calculating results. All descriptive and statistical analyses were performed using R software, version 3.0.1.27
RESULTS
A total of 87 matched pairs (n = 87 overweight or obese cases and n = 87 normal-weight controls) with 389 vancomycin concentrations were included in the PK analysis. Ninety-eight (n = 42 overweight or obese cases and n = 56 normal-weight controls) participants had ≥2 vancomycin concentrations. The numbers of drug samples measured were as follows: from the end of infusion to 1 hour, 4 (1%); 1.1 to 2 hours, 10 (3%); 2.1 to 5 hours, 145 (37%); and >5 hours, 230 (59%). The median age for all participants was 10.1 (interquartile range [IQR], 4.7–14.9) years, and the mean baseline SCr concentration was 0.49 (IQR, 0.32–0.61) mg/dL, which were similar between cases and controls. The median weight and BMI in the different age groups were significantly different between cases and normal-weight controls for age >2 years (Table II).
Table II.
Baseline characteristics of the 174 study participants.*
| Characteristic | Controls (n = 87) | Cases (n = 87) | P |
|---|---|---|---|
| Age, median (IQR), y | 10.2 (4.5–14.8) | 10.0 (4.8–15.2) | –† |
| Age group, y | |||
| <2 | 6 (6.9) | 3 (3.5) | – |
| 2 to <12 | 45 (51.7) | 49 (56.3) | – |
| 12 to <18 | 33 (37.9) | 33 (37.9) | – |
| ≥18 | 3 (3.4) | 2 (2.3) | – |
| Weight, median (IQR), kg | 31.3 (16.8–47.1) | 44.0 (23.4–78.1) | <0.001 |
| Weight by age group, y | |||
| <2 | 11.4 (10.0–12.0) | 13.0 (10.7–13.2) | 0.77 |
| 2 to <12 | 17.7 (16.0–28.6) | 26.6 (18.4–43.3) | 0.008 |
| 12 to <18 | 53.2 (41.8–58.4) | 80.0 (73.5–95.3) | <0.001 |
| ≥18 | 68.7 (59.6–70.4) | 123.4 (120.8–126.1) | 0.006 |
| Body mass index, median (IQR), kg/m2 | 16.73 | 23.43 | <0.001 |
| Overweight | – | 33 (37.9) | – |
| Obese | – | 54 (62.1) | – |
| Overweight or obese by age group, y | |||
| <2 | 17.3 (16.9–17.5) | 21.9 (20.1–23.1) | 0.09 |
| 2 to <12 | 15.0 (14.3–16.7) | 20.2 (18.7–22.9) | <0.001 |
| 12 to <18 | 19.6 (17.4–20.5) | 30.0 (27.9–34.3) | <0.001 |
| ≥18 | 18.5 (17.6–20.4) | 40.9 (40.2–41.6) | 0.002 |
| Male | 42 (48.3) | 44 (50.6) | 0.9 |
| Intensive care unit stay | 33 (37.9) | 33 (37.9) | –† |
| Concurrent use of nephrotoxic medications | 28 (32.2) | 28 (32.2) | –† |
| Empiric vancomycin dose, mean (SD) [IQR], mg/kg/d | 47.4 (13.0) [39.9–53.3] | 41.9 (12.0) [33.4–50.1] | 0.004 |
| Dosing interval | 0.3 | ||
| Every 6 hours | 31 (35.6) | 37 (42.5) | – |
| Every 8 hours | 49 (56.3) | 39 (44.8) | – |
| Every 12 hours | 6 (6.9) | 11 (12.6) | – |
| Serum creatinine, mean (SD) [IQR], mg/dL | 0.48 (0.20) [0.30–0.60] | 0.51 (0.22) [0.34–0.67] | –† |
IQR = interquartile range.
Data are presented as number (percentage) of patients unless otherwise indicated.
Cases were matched to controls by age (within 1 year), serum creatinine (within 0.4 mg/dL), the use of concurrent nephrotoxic medications, and stay in the intensive care unit.
For each weight measure, models were created to characterize Vd and CL (Table III). Age and SCr were preselected independent covariates on CL for all models using a previous study.20 The differences in the MOFs for weight, BMI, and ALWT in estimating Vd were not significant; thus, weight was selected in the final model for estimation of Vd. Although BSA and adjusted weight produced the lowest MOFs for CL estimation, ALWT was selected for the final model because (1) the reduction in MOF was <4 (the threshold that is considered statistically significant at a P ≤ 0.05 for 1 df), and (2) its integration into clinical practice is feasible because ALWT does not require height information or IW estimations using different equations that are based on age and sex.
Table III.
Covariate screening during pharmacokinetic model development.
| Covariate | Minimum Objective Function | Change in Minimum Objective Function | P |
|---|---|---|---|
| Vd, L* | |||
| Actual weight, kg (base model) | 1751.044 | – | 0.028 |
| Body mass index, kg/m2 | 1750.359 | −0.685 | 0.019 |
| Allometric weight, kg | 1751.486 | 0.442 | 0.037 |
| Adjusted weight, kg | 1751.667 | 0.623 | 0.041 |
| Body surface area, m2 | 1752.198 | 1.154 | 0.056 |
| Lean body mass, kg | 1752.203 | 1.159 | 0.056 |
| Ideal weight, kg | 1752.832 | 1.788 | 0.082 |
| Clearance, L/h† | |||
| Allometric weight, kg (final model) | 1680.621 | – | 0.011 |
| Body surface area, m2 | 1676.776 | −3.846 | 0.001 |
| Adjusted weight, kg | 1680.388 | −0.233 | 0.009 |
| Lean body mass, kg | 1681.874 | 1.252 | 0.021 |
| Ideal weight, kg | 1682.739 | 2.118 | 0.035 |
| Actual weight, kg | 1682.968 | 2.348 | 0.041 |
| Body mass index, kg/m2 | 1685.685 | 5.064 | 0.224 |
The change in minimum objective function for the volume of distribution was calculated from the base model using actual weight.
Actual weight was the covariate for Vd used in all models to estimate clearance. The change in minimum objective function for clearance was calculated from the final model that incorporated the log function of age (in days) and serum creatinine (in milligrams per deciliter) as covariates along with different weights.
The final PK model incorporated weight for Vd and ALWT for CL (Table IV). Minimization and the covariance step were successful for the final model. The mean (SD) post hoc Bayesian estimates of Vd and CL, based on weight, were 0.56 (0.06) L/kg and 0.11 (0.04) L/kg/h, respectively, with significant differences in CL between only the case and control groups (Table V). Age and SCr did not affect vancomycin Vd in both cases and controls (Figure 1). However, CL was inversely proportional to age and SCr for both case and control groups, although the trend was not as robust for SCr in controls and for SCr >1.0 mg/dL in cases (Figure 2). Scatterplots revealed good fit between observed and predicted (both individual and population) concentrations (Figure 3). Model prediction of concentrations measured at >15 hours (which was <2% of total observed concentrations) was less accurate than early concentrations because these late concentrations were obtained from 4 cases who had increasing SCr values while undergoing vancomycin therapy (Figure 4). In these 4 cases with increasing SCr values during vancomycin therapy, SCr values increased more rapidly (by 34.8%) than respective decreases in drug CL (by −6.9%).
Table IV.
Vancomycin final pharmacokinetic model.
| Parameter Estimate | Intersubject Variability, % | Residual Error, % |
|---|---|---|
| CL (L/h) = 0.286 × ALWT (kg) × (0.4/SCr [mg/dL])0.290 × (ln[Age*]/8.3)0.755 | 30 | 24 |
| Vd (L) = 0.574 × Weight (kg) | 29 |
ALWT = allometric weight (equivalent to weight0.75); CL = clearance; SCr = serum creatinine.
Age expressed in days.
Table V.
Baseline parameter estimations using final pharmacokinetic model.*
| Variable | Controls (n = 87) | Cases (n = 87) | P |
|---|---|---|---|
| Serum creatinine, mg/dL | 0.48 (0.20) [0.30–0.60] | 0.51 (0.22) [0.34–0.67] | 0.2 |
| Clearance, L/kg/h | 0.12 (0.03) [0.10–0.15] | 0.11 (0.04) [0.08–0.14] | 0.003 |
| Vd, L/kg | 0.58 (0.08) [0.53–0.61] | 0.56 (0.06) [0.53–0.60] | 0.3 |
| Half-life, h | 3.4 (0.8) [2.8–3.9] | 4.1 (1.7) [2.9–4.8] | <0.001 |
| Elimination rate constant, h−1 | 0.21 (0.05) [0.18–0.25] | 0.19 (0.06) [0.14–0.24] | 0.002 |
Data are presented as mean (SD) [interquartile range].
Figure 1.
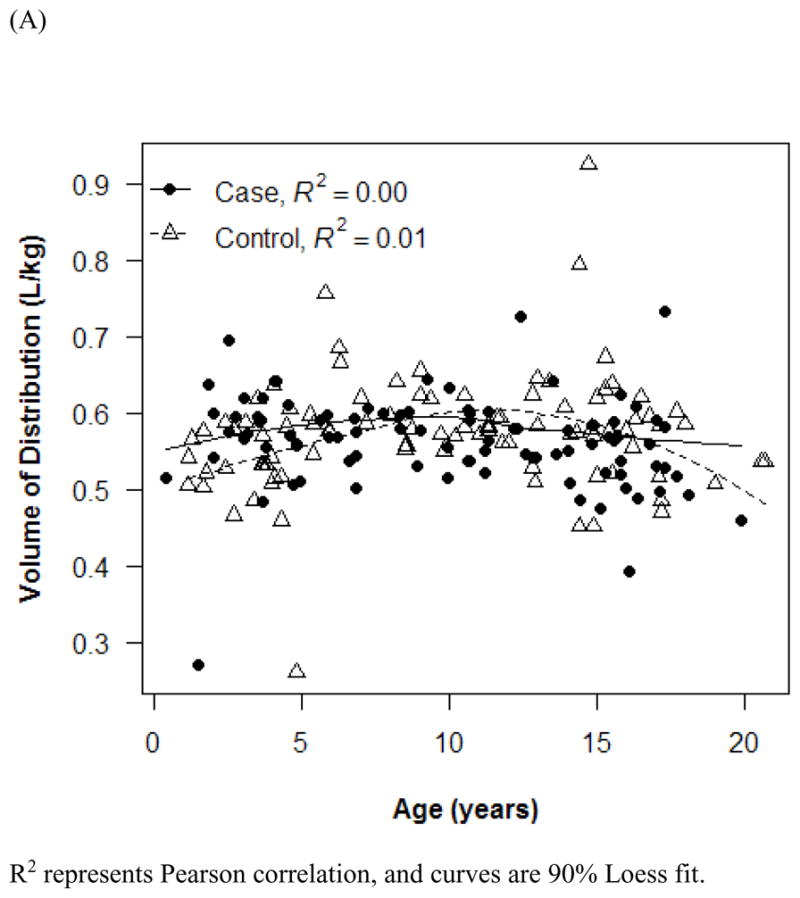
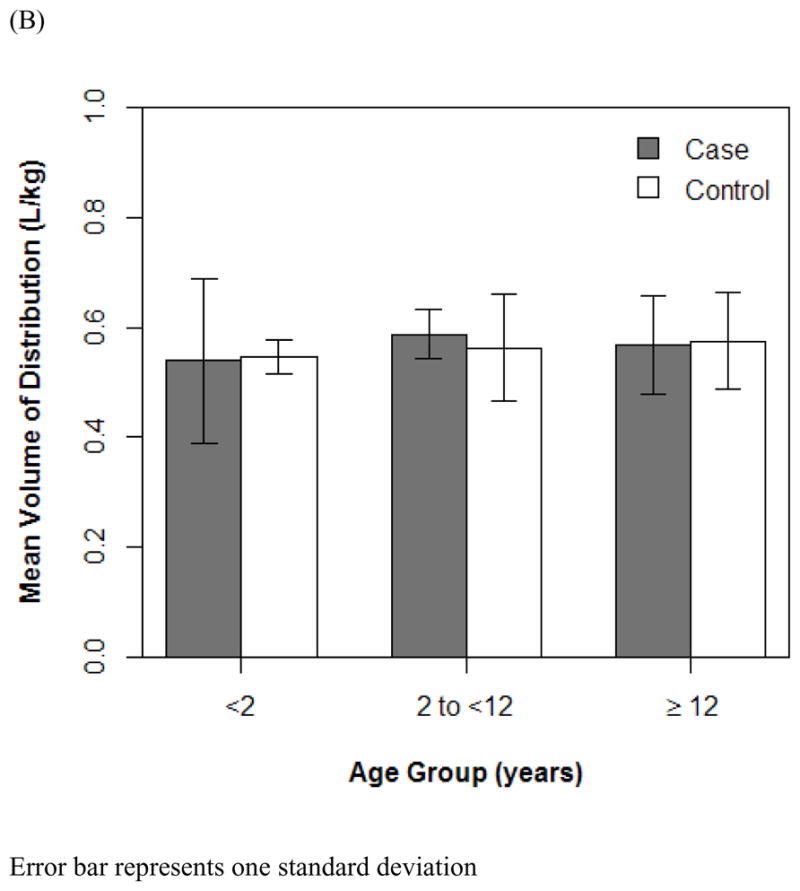
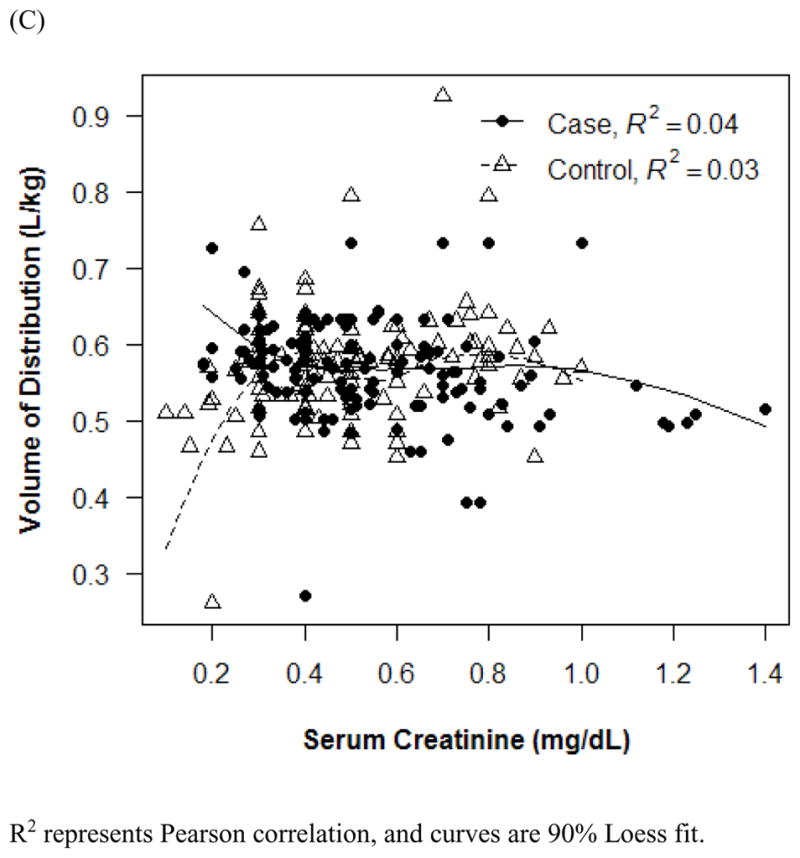
Effect of age (A and B) and serum creatinine (C) on vancomycin Vd. R2 represents Pearson correlation, and curves are 90% Loess fit. Error bars indicate 1 SD.
Figure 2.
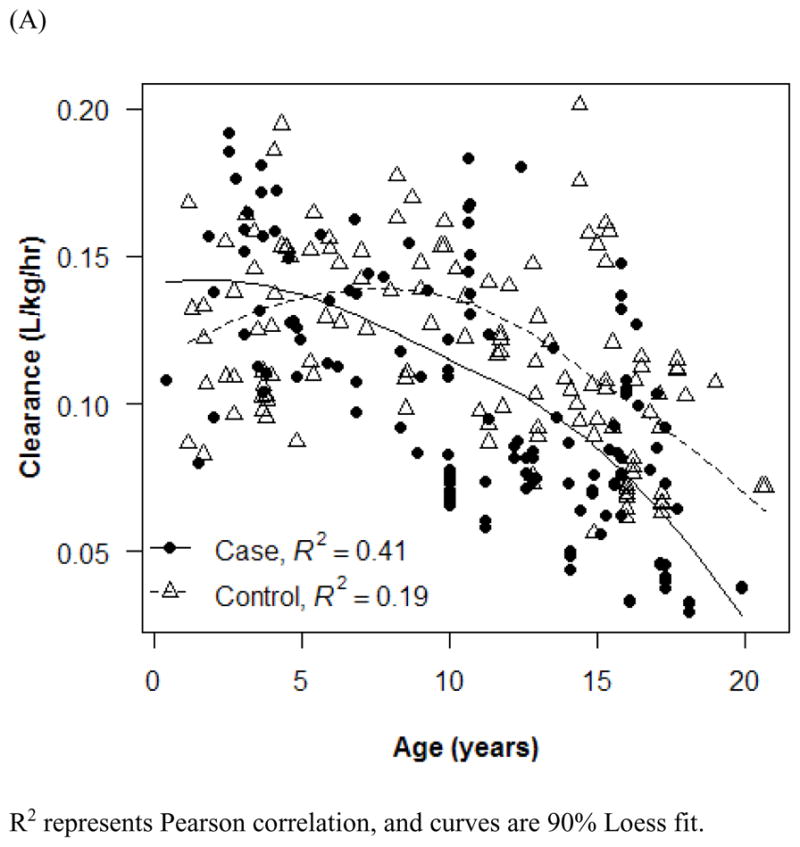
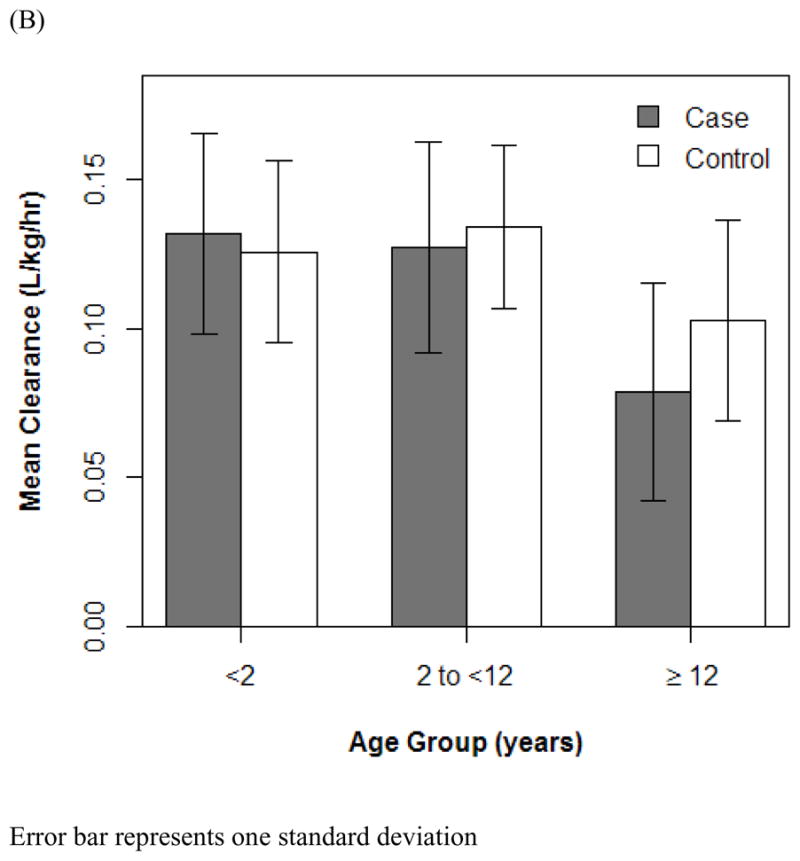
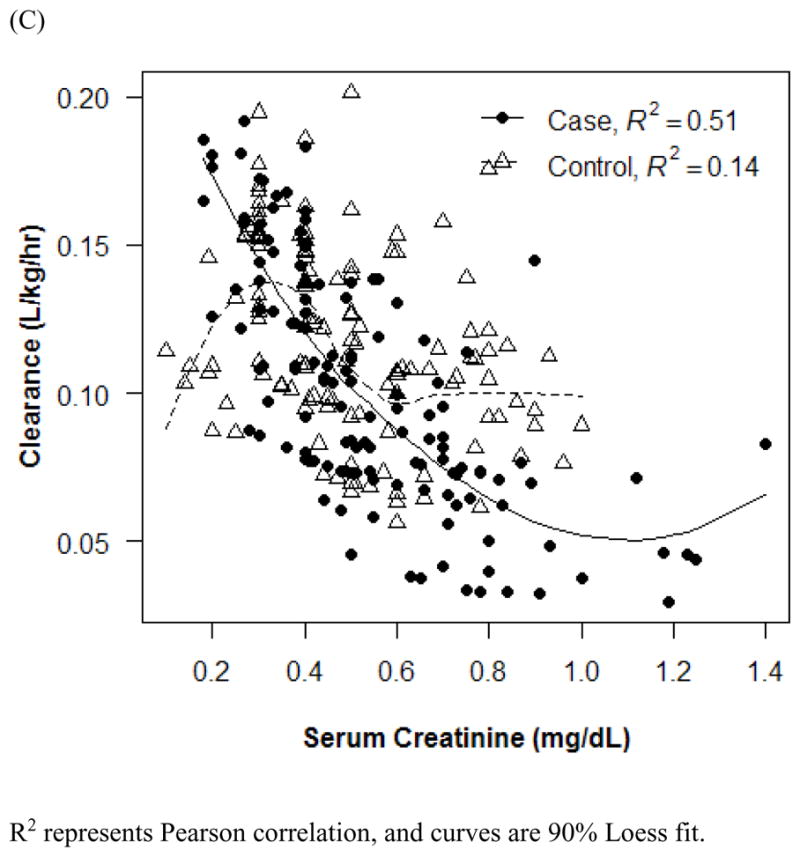
Effect of age (A and B) and serum creatinine (C) on vancomycin clearance. R2 represents Pearson correlation, and curves are 90% Loess fit. Error bars indicate 1 SD.
Figure 3.
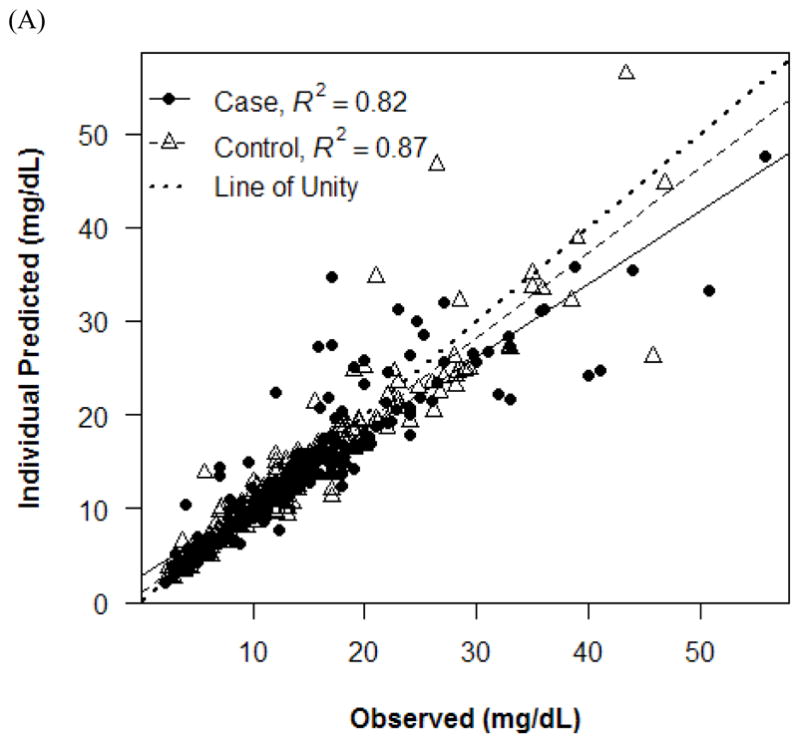
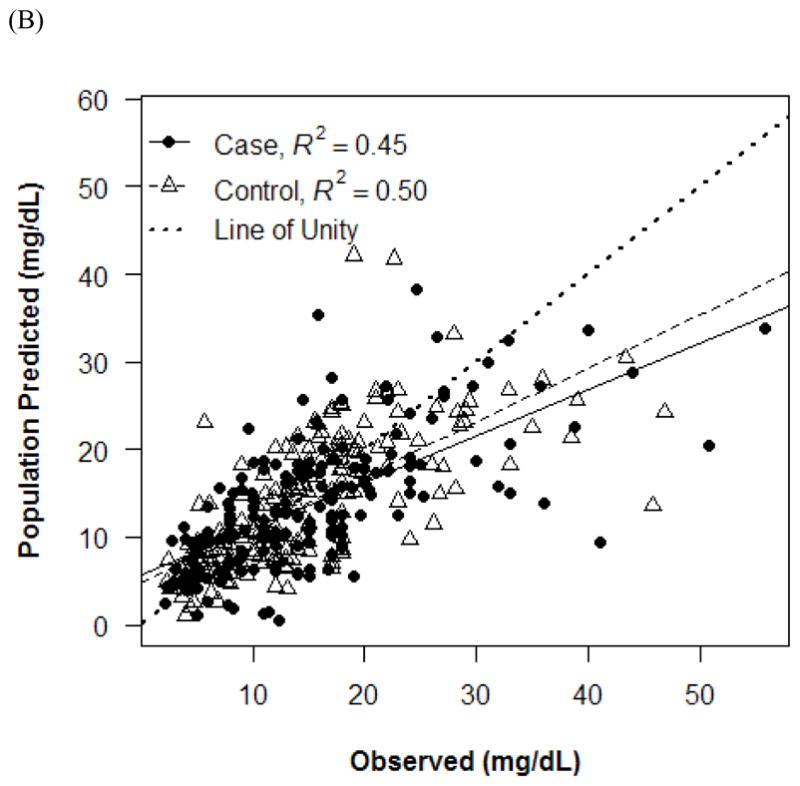
Observed versus individual (A) and population (B) predicted concentrations.
Figure 4.
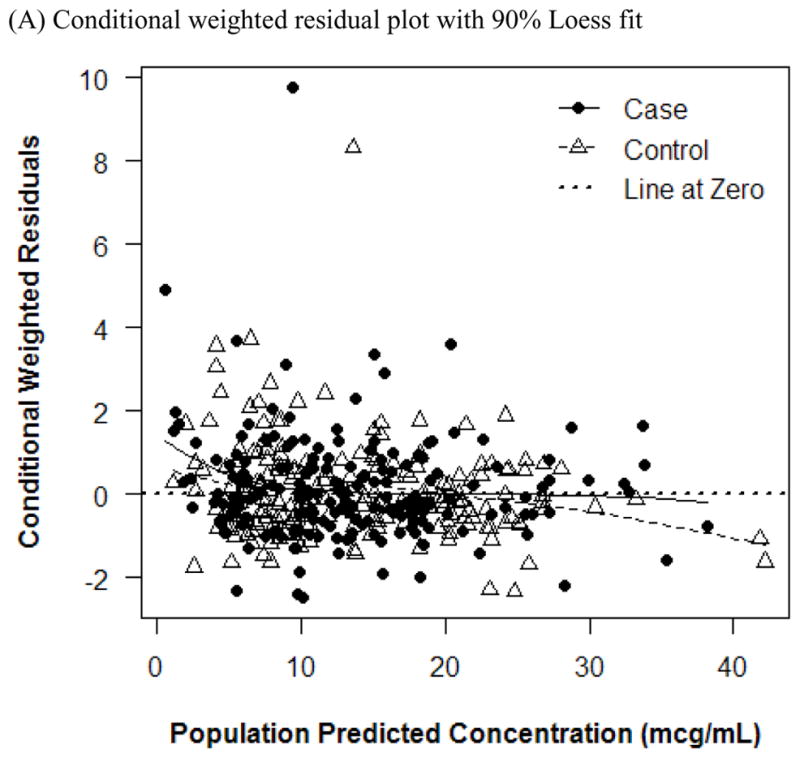
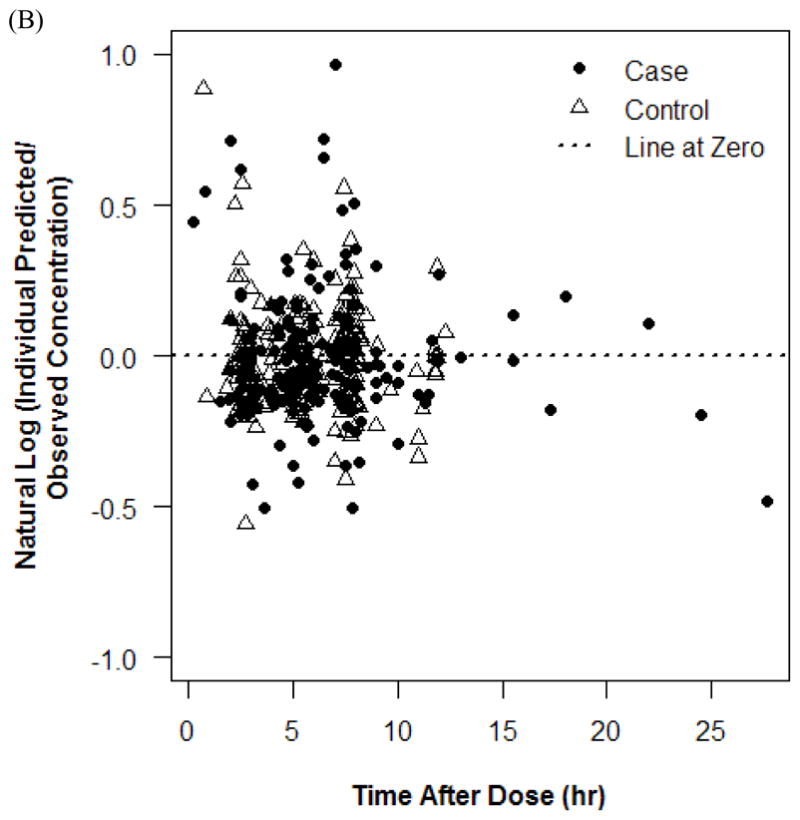
Plots of residuals in concentrations. Conditional weighted residual plot with 90% Loess fit (A) and natural log plot (B).
The accuracy was consistently improved in Vd estimation for controls compared with cases, and <6% accuracy was observed between weight and other weights for both groups (Table VI). For CL estimation in both groups, the accuracy was within 2% for weight, BSA, and adjusted weight (Table VI). The post hoc Bayesian population estimates for Vd and CL were similar to the median bootstrap analysis values and were all within the 95% CIs obtained from the bootstrap analysis (Table VII).
Table VI.
Accuracy of different measures of weight on vancomycin pharmacokinetic properties.
| Weight Type | Accuracy, %*
|
|||
|---|---|---|---|---|
| Vd
|
Clearance
|
|||
| Controls (n = 87) | Cases (n = 87) | Controls (n = 87) | Cases (n = 87) | |
| Actual weight, kg | – | – | −0.30 | −0.19 |
| Allometric weight, kg | 0.13 | −0.89 | – | – |
| Body surface area, m2 | 0.48 | −3.00 | 0.90 | −0.34 |
| Adjusted weight, kg | 1.03 | −2.77 | 1.15 | −0.59 |
| Lean body mass, kg | 0.36 | −3.55 | 0.94 | −0.80 |
| Ideal weight, kg | 0.97 | −5.72 | 3.13 | −0.76 |
| Body mass index, kg/m2 | −3.00 | 4.27 | 2.73 | 2.47 |
Accuracy was determined relative to actual weight for volume of distribution and allometric weight for clearance.
Table VII.
Estimates of final population pharmacokinetic parameters and random effects.*
| Parameter | Estimate | SE of Estimate | Median Bootstrap Estimate (95% CI) |
|---|---|---|---|
| θ1 | 0.574 | 0.031 | 0.572 (0.514–0.632) |
| θ2 | 0.286 | 0.009 | 0.285 (0.268–0.304) |
| θ3 | 0.290 | 0.057 | 0.291 (0.165–0.395) |
| θ4 | 0.755 | 0.264 | 0.742 (0.194–1.263) |
| η1 | 0.084 | 0.048 | 0.080 (0.002–0.182) |
| η2 | 0.092 | 0.016 | 0.090 (0.061–0.124) |
| E | 0.056 | 0.007 | 0.056 (0.042–0.069) |
η1 = intersubject random effect associated with Vd; η2 = intersubject random effect associated with CL; ε = residual random effect.
Final pharmacokinetic model was Vd (L) = θ1 × Weight and CL (L/h) = θ2 × ALWT × (0.4/SCr)θ3 × (ln[Age]/8.3)θ4, where ALWT indicates allometric weight and SCr indicates serum creatinine.
DISCUSSION
In this study, we evaluated the influence of different body size descriptors measures on vancomycin Vd and CL in obese children using population-based PK modeling with Bayesian estimation, which has been previously found to improve predictions of vancomycin PK parameters.28–30 Using a matched case-control design with a good sample size, we also compared the different body size measures between normal-weight and overweight or obese children.
Previous studies have reported decreased vancomycin weight-adjusted Vd and CL in obese adult and pediatric patients compared with those who were nonobese by 13% to 53% and 20% to 37%, respectively (Table VIII).3–7 Consistent with previous studies, our study found that the weight-adjusted Vd and CL decreased by 2.2% and 10.8%, respectively, in obese and overweight children compared with those with normal weight. One potential explanation for the small decrease in weight-adjusted Vd is the hydrophilicity of and large size of vancomycin, which hinders drug distribution into adipose tissue.2,31 Notably, the observed decrease in weight-adjusted Vd corresponds to an increase in the non–weight-adjusted Vd that are sometimes evaluated in adult studies.32
Table VIII.
Summary of vancomycin pharmacokinetic properties in obese children and adults.
| Year of Publication | Age, mean (SD) or range, y | Sample Size | Vd, Mean (SD) or Median (Range), L/kg | Weight Used for Volume Estimation | Clearance, Mean (SD) or Median (Range), L/kg/h | Weight Used for Clearance Estimation | Obesity Definition |
|---|---|---|---|---|---|---|---|
| Pediatric | |||||||
| 20118 | 2–17 | 70 Overweight or obese | – | – | – | – | BMI ≥85th percentile for age and sex (CDC) |
| 162 Normal weight | – | – | – | – | BMI <85th percentile | ||
| 20112 | 6.8 (4.31) | 24 Obese | 0.35 (0.15) (n = 4) | Weight | – | – | BMI >95th percentile for age and sex (CDC) |
| 7.2 (4.80) | 24 Normal weight | – | – | – | – | 25%–75th percentile for age and sex | |
| 20123 | 5; 0.5–18 | 18 Overweight* | 0.81 (0.37) | Weight | 0.16 (0.05) | Weight | BMI ≥98th percentile for 0–2 y and BMI ≥85th percentile for 2–18 y |
| 31 Normal weight* | 1 (0.35) | Weight | 0.2 (0.08) | Weight | BMI = 2 in the 98th percentile for 0–2 y and 5 in the 85th percentile for 2–18 y | ||
| 13 Underweight* | 0.97 (0.54) | Weight | 0.18 (0.09) | Weight | BMI ≤2nd percentile for 0–2 y and BMI ≤5th percentile for 2–18 y | ||
| 20139 | 8.9 (5.1) | 21 Obese | – | – | – | – | BMI ≥95th percentile |
| 9.7 (4.7) | 21 Overweight | – | – | – | – | BMI = 85th–94th percentile | |
| 9.5 (4.9) | 84 Normal weight | – | – | – | – | BMI ≤84th percentile for age and sex (CDC) | |
| Adults | |||||||
| 19824 | 27–37 | 6 Morbidly obese | 0.26 (0.03) | Weight | 0.066 (0.01) | Weight | Weight >190% IW |
| 0.68 (0.07) | IW | 0.174 (0.04) | IW | ||||
| 25–30 | 4 Normal weight | 0.39 (0.06) | Weight | 0.065 (0.004) | Weight | Weight <115% IW | |
| 19935 | 54.3–60.0† | 107 Obese | (0.81) | Weight | 0.0366–0.051† | Weight | Weight >120% LBM |
| 36.4–58.1† | 113 Normal weight | – | – | 0.0624–0.066† | Weight | Weight <120% LBM | |
| 19946 | 50.0; 46.8–53.2‡ | 108 Obese | 0.89 (0.82–0.97‡) | IW | – | – | Weight >130% IW |
| 0.56 (0.52–0.59‡) | Weight | ||||||
| 43.3; 42.0–44.6‡ | 559 Normal weight | 0.65 (0.63–0.67‡) | IW | – | – | Weight = 80%–130% IW | |
| 0.64 (0.62–0.66‡) | Weight | ||||||
| 45.4; 39.2–51.7‡ | 37 Underweight | 0.62 (0.55–0.68‡) | IW | – | – | Weight <80% IW | |
| 0.83 (0.74–0.92‡) | Weight | ||||||
| 19987 | 41 (7) | 24 Morbidly obese | 0.32 (0.05) | Weight | 0.072 (0.012) | Weight | Weight >190% IW |
| 0.83 (0.08) | IW | 0.186 (0.042) | IW | ||||
| 40 (7) | 24 Normal weight | 0.68 (0.24) | Weight | 0.066 (0.018) | Weight | Weight = 85%–115% IW | |
| 0.64 (0.26) | IW | 0.06 (0.024) | IW | ||||
| 201522 | 43.0; 38.5–53.0 | 31 | 0.51 | Weight | 6.54 | – | BMI ≥40 kg/m2 |
BMI = body mass index; CDC = Centers for Disease Control and Prevention; IW = ideal weight; LBM = lean body mass.
Trough concentrations for 51 patients total.
Range of means.
95% CI.
The correlation between vancomycin Vd or CL and weight in obese adults were variable based on previous studies. The correlation between Vd and weight ranged from r = 0.36 to r = 0.943 for Vd.4–7 Two studies4,7 reported strong correlation between CL and weight, whereas another study5 considered WT alone to be weak predictor of CL compared with SCr and age. One pediatric study found no statistical difference between different weight groups for weight-adjusted Vd and CL.3 In our study, we incorporated SCr, age, and ALWT for CL estimation.
Compared with weight, we found that BSA, AW, ALWT, and LBM were all strong determinants of vancomycin CL in this study. The use of BSA yielded the lowest MOF, perhaps because the total number of glomeruli and kidney weight in large humans are directly proportional to BSA.33 Although BSA provided the best determinant for CL, it was not used in the final model because the reduction in MOF was <4, indicating an insignificant PK modeling change as described in the Patients and Methods section. In addition, BSA is generally used for highly toxic chemotherapeutic agents (rather than antibiotics like vancomycin) and requires height information that can be challenging to measure in young children. The use of weight only requires measuring actual weight, without the need for a second variable of height measurement. In contrast, AW and LBM require age, height, and sex information and thus are not always pragmatic. More importantly, although LBM appears to an appropriate body size descriptor for predicting drug CL based on one meta-analysis, LBM has not been well studied in the obese population and unconfirmed in children.23,24
ALWT was selected for the final model in estimating vancomycin CL because it uses a simple exponential function of weight. The exponent used in the allometric scaling of weight can vary; however, we selected a fixed exponent of 0.75 that has been found to accurately predict drug CL in children aged >5 years and those who are obese.26,34 On the basis of one meta-analysis of 458 articles, allometric scaling of weight was the most appropriate approach used to describe drug CL in both pediatrics and adults because CL was nonlinear to weight to account for different metabolic rates.24 Furthermore, allometry has been suggested for use during pediatric drug development in children aged >6 years to predict their drug CL. Our final model with ALWT is a good approximation to models using BSA or AW, with accuracy for weight-adjusted CL within 1% for the cases.
There were several study limitations. First, the vancomycin samples were analyzed at 2 separate clinical laboratories that used immunoassays and thus may have produced some variability in CL estimations. Second, only one drug concentration was measured in 35% of participants, which may result in suboptimal estimation of Vd, produce over-parameterization of the PK parameters, and dictate the use of a 1-compartment model. However, on the basis of a recent review article and subsequent large population-based PK study, a 1-compartment model appears to be the adequate model to characterize vancomycin PK in children.21,35 Furthermore, our final model and the bootstrap analysis of 1000 replicates achieved minimization. Third, our final PK model was based on serum vancomycin concentrations only, with the lack of drug concentrations in adipose tissues, which may shed light on the extent of drug penetration in this specific compartment through physiologically based PK modeling. Fourth, we did not distinguish between obese and overweight children, which were respectively 62% and 38% of the case group; thus, any PK variability between these groups remains undefined.
CONCLUSION
We found that weight and ALWT can be used to estimate vancomycin Vd and CL, respectively, in obese children between the ages of 4 and 16 years. Using these measures of weight for Vd and CL estimation, clinicians can then optimally dose vancomycin. Further studies using Bayesian estimation and Monte Carlo simulation are needed to validate our findings and evaluate optimal vancomycin dosing.
Acknowledgments
Jennifer Le contributed to all aspects of this work, including literature search, figure creation, study design, data collection, data interpretation, and writing. Edmund V. Capparelli contributed to study design, data collection, and data interpretation. Uzra Wahid contributed to literature search, data collection, and data interpretation. Yi Shuan S. Wu contributed to literature search, figure creation, data collection, data interpretation, and writing. Gale L. Romanowski contributed study design and data interpretation. Tri M. Tran contributed to literature search, figure creation, data collection, and writing. Austin Nguyen contributed to literature search, figure creation, study design, data collection, and writing. John S. Bradley, contributed to study design, data interpretation, and writing.
FUNDING SOURCES
This project was supported by grant K23AI089978 to J.L. from the National Institute of Allergy And Infectious Diseases and grant U54HD071600 to E.V.C. and J.S.B. from the Eunice Kennedy Shriver National Institute of Child Health and Human Development.
References
- 1.Liu C, Bayer A, Cosgrove SE, et al. Clinical practice guidelines by the infectious diseases society of america for the treatment of methicillin-resistant Staphylococcus aureus infections in adults and children. Clin Infect Dis. 2011;52:e18–e55. doi: 10.1093/cid/ciq146. [DOI] [PubMed] [Google Scholar]
- 2.Moffett BS, Kim S, Edwards MS. Vancomycin dosing in obese pediatric patients. Clin Pediatr. 2011;50:442–446. doi: 10.1177/0009922810393500. [DOI] [PubMed] [Google Scholar]
- 3.Nassar L, Hadad S, Gefen A, et al. Prospective evaluation of the dosing regimen of vancomycin in children of different weight categories. Curr Drug Saf. 2012;7:375–381. doi: 10.2174/157488612805076606. [DOI] [PubMed] [Google Scholar]
- 4.Blouin RA, Bauer LA, Miller DD, et al. Vancomycin pharmacokinetics in normal and morbidly obese subjects. Antimicrob Agents Chemother. 1982;21:575–580. doi: 10.1128/aac.21.4.575. [DOI] [PMC free article] [PubMed] [Google Scholar]
- 5.Vance-Bryan K, Guay DR, Gilliland SS, et al. Effect of obesity on vancomycin pharmacokinetic parameters as determined by using a Bayesian forecasting technique. Antimicrob Agents Chemother. 1993;37:436–440. doi: 10.1128/aac.37.3.436. [DOI] [PMC free article] [PubMed] [Google Scholar]
- 6.Ducharme MP, Slaughter RL, Edwards DJ. Vancomycin pharmacokinetics in a patient population: effect of age, gender, and body weight. Ther Drug Monit. 1994;16:513–518. doi: 10.1097/00007691-199410000-00013. [DOI] [PubMed] [Google Scholar]
- 7.Bauer LA, Black DJ, Lill JS. Vancomycin dosing in morbidly obese patients. Eur J Clin Pharmacol. 1998;54:621–625. doi: 10.1007/s002280050524. [DOI] [PubMed] [Google Scholar]
- 8.Miller M, Miller JL, Hagemann TM, et al. Vancomycin dosage in overweight and obese children. Am J Health-Syst Pharm. 2011;68:2062–2068. doi: 10.2146/ajhp110107. [DOI] [PubMed] [Google Scholar]
- 9.Heble DE, Jr, McPherson C, Nelson MP, Hunstad DA. Vancomycin trough concentrations in overweight or obese pediatric patients. Pharmacotherapy. 2013;33:1273–1277. doi: 10.1002/phar.1321. [DOI] [PubMed] [Google Scholar]
- 10.Kuczmarski RJ, Ogden CL, Guo SS, et al. 2000 CDC Growth Charts for the United States: methods and development. Vital Health Stat. 2002;11:1–190. [PubMed] [Google Scholar]
- 11.Centers for Disease Control and Prevention. Obesity and Overweight for Professionals: Childhood: Basics About Childhood Obesity. Atlanta, GA: Centers for Disease Control and Prevention; 2012. [Google Scholar]
- 12.Mahmood I. Prediction of drug clearance in children: impact of allometric exponents, body weight, and age. Ther Drug Monit. 2007;29:271–278. doi: 10.1097/FTD.0b013e318042d3c4. [DOI] [PubMed] [Google Scholar]
- 13.Mahmood I. Prediction of drug clearance in children from adults: a comparison of several allometric methods. Br J Clin Pharmacol. 2006;61:545–557. doi: 10.1111/j.1365-2125.2006.02622.x. [DOI] [PMC free article] [PubMed] [Google Scholar]
- 14.Taketomo CK, Hodding JH, Kraus DM. Pediatric Dosage Handbook. 13. Hudson, OH: Lexi-Comp; 2006. [Google Scholar]
- 15.Peters AM, Snelling HL, Glass DM, Bird NJ. Estimation of lean body mass in children. Br J Anaesth. 2011;106:719–723. doi: 10.1093/bja/aer057. [DOI] [PubMed] [Google Scholar]
- 16.Foster BJ, Platt RW, Zemel BS. Development and validation of a predictive equation for lean body mass in children and adolescents. Ann Hum Biol. 2012;39:171–182. doi: 10.3109/03014460.2012.681800. [DOI] [PubMed] [Google Scholar]
- 17.Pai MP, Paloucek FP. The origin of the “ideal” body weight equations. Ann Pharmacother. 2000;34:1066–1069. doi: 10.1345/aph.19381. [DOI] [PubMed] [Google Scholar]
- 18.Shah B, Sucher K, Hollenbeck CB. Comparison of ideal body weight equations and published height-weight tables with body mass index tables for healthy adults in the United States. Nutr Clin Pract. 2006;21:312–319. doi: 10.1177/0115426506021003312. [DOI] [PubMed] [Google Scholar]
- 19.Traub SL, Johnson CE. Comparison of methods of estimating creatinine clearance in children. Am J Hosp Pharm. 1980;37:195–201. [PubMed] [Google Scholar]
- 20.Krenitsky J. Adjusted body weight, pro: evidence to support the use of adjusted body weight in calculating calorie requirements. Nutr Clin Pract. 2005;20:468–473. doi: 10.1177/0115426505020004468. [DOI] [PubMed] [Google Scholar]
- 21.Le J, Bradley JS, Murray W, et al. Improved vancomycin dosing in children using area under the curve exposure. Pediatr Infect Dis J. 2013;32:e155–e163. doi: 10.1097/INF.0b013e318286378e. [DOI] [PMC free article] [PubMed] [Google Scholar]
- 22.Adane ED, Herald M, Koura F. Pharmacokinetics of vancomycin in extremely obese patients with suspected or confirmed Staphylococcus aureus infections. Pharmacotherapy. 2015;35:127–139. doi: 10.1002/phar.1531. [DOI] [PubMed] [Google Scholar]
- 23.Janmahasatian S, Duffull SB, Ash S, et al. Quantification of lean bodyweight. Clin Pharmacokinet. 2005;44:1051–1065. doi: 10.2165/00003088-200544100-00004. [DOI] [PubMed] [Google Scholar]
- 24.McLeay SC, Morrish GA, Kirkpatrick CM, Green B. The relationship between drug clearance and body size: systematic review and meta-analysis of the literature published from 2000 to 2007. Clin Pharmacokinet. 2012;51:319–330. doi: 10.2165/11598930-000000000-00000. [DOI] [PubMed] [Google Scholar]
- 25.Green B, Duffull SB. What is the best size descriptor to use for pharmacokinetic studies in the obese? Br J Clin Pharmacol. 2004;58:119–133. doi: 10.1111/j.1365-2125.2004.02157.x. [DOI] [PMC free article] [PubMed] [Google Scholar]
- 26.Mahmood I. Dosing in children: a critical review of the pharmacokinetic allometric scaling and modelling approaches in paediatric drug development and clinical settings. Clin Pharmacokinet. 2014;53:327–346. doi: 10.1007/s40262-014-0134-5. [DOI] [PubMed] [Google Scholar]
- 27.R Core Team. R: A language and environment for statistical computing. R Foundation for Statistical Computing; Vienna; Austria: 2015. http://www.R-project.org/ [Google Scholar]
- 28.Mahmood I. Interspecies scaling of biliary excreted drugs: prediction of human clearance and volume of distribution. Drug Metab Drug Interactions. 2012;27:157–164. doi: 10.1515/dmdi-2012-0012. [DOI] [PubMed] [Google Scholar]
- 29.Rodvold KA, Gentry CA, Plank GS, et al. Bayesian forecasting of serum vancomycin concentrations in neonates and infants. Ther Drug Monit. 1995;17:239–246. doi: 10.1097/00007691-199506000-00005. [DOI] [PubMed] [Google Scholar]
- 30.Llopis-Salvia P, Jimenez-Torres NV. Population pharmacokinetic parameters of vancomycin in critically ill patients. J Clin Pharm Ther. 2006;31:447–454. doi: 10.1111/j.1365-2710.2006.00762.x. [DOI] [PubMed] [Google Scholar]
- 31.Kendrick JG, Carr RR, Ensom MH. Pharmacokinetics and drug dosing in obese children. J Pediatr Pharmacol Ther. 2010;15:94–109. [PMC free article] [PubMed] [Google Scholar]
- 32.Grace E. Altered vancomycin pharmacokinetics in obese and morbidly obese patients: what we have learned over the past 30 years. J Antimicrob Chemother. 2012;67:1305–1310. doi: 10.1093/jac/dks066. [DOI] [PubMed] [Google Scholar]
- 33.Smith H. The Kidney: Structure and Function in Health and Disease. New York, NY: Oxford University Press; 1951. [Google Scholar]
- 34.Mahmood I. Prediction of clearance and volume of distribution in the obese from normal weight subjects: an allometric approach. Clin Pharmacokinet. 2012;51:527–542. doi: 10.2165/11631630-000000000-00000. [DOI] [PubMed] [Google Scholar]
- 35.Marsot A, Boulamery A, Bruguerolle B, Simon N. Vancomycin: a review of population pharmacokinetic analyses. Clin Pharmacokinet. 2012;51:1–13. doi: 10.2165/11596390-000000000-00000. [DOI] [PubMed] [Google Scholar]


