Abstract
A large quantity of high throughput screening (HTS) data for antimalarial activity has become available in recent years. This includes both phenotypic and target-based activity. Realising the maximum value of these data remains a challenge. In this respect, methods that allow such data to be used for virtual screening maximise efficiency and reduce costs. In this study both in vitro antimalarial activity and inhibitory data for β-haematin formation, largely obtained from publically available sources, has been used to develop Bayesian models for inhibitors of β-haematin formation and in vitro antimalarial activity. These models were used to screen two in silico compound libraries. In the first, the 1510 U.S. Food and Drug Administration approved drugs available on PubChem were ranked from highest to lowest Bayesian score based on a training set of β-haematin inhibiting compounds active against P. falciparum that did not include any of the clinical antimalarials or close analogues. The six known clinical antimalarials that inhibit β-haematin formation were ranked in the top 2.1% of compounds. Furthermore, the in vitro antimalarial hit-rate for this prioritised set of compounds was found to be 81% in the case of the subset where activity data are available in PubChem. In the second, a library of about 5,000 commercially available compounds (AldrichCPR) was virtually screened for ability to inhibit β-haematin formation and then for in vitro antimalarial activity. A selection of 34 compounds was purchased and tested, of which 24 were predicted to be β-haematin inhibitors. The hit rate for inhibition of β-haematin formation was found to be 25% and a third of these were active against P. falciparum, corresponding to enrichments estimated at about 25- and 140-fold relative to random screening, respectively.
Keywords: malaria, antimalarial, haemozoin, β-haematin, in silico screening, Bayesian statistics, machine learning
1. Introduction
The increasing popularity of high throughput screening (HTS) as a starting point for drug discovery has led to a surge in the availability of activity data. This is also true in antimalarial research, where the urgent need for novel treatments has been exacerbated by recent reports of resistance to the currently recommended drug, artemisinin.1,2 High mortality rates associated with resistance to previously successful drugs such as chloroquine (CQ) and sulfadoxine-pyrimethamine have decreased since artemisinin-based combination therapies were adopted.3 However, this treatment may now also be threatened.
The primary goal of HTS is the identification of validated hits that have potential to become chemical leads in drug discovery programmes. Determining which of these compounds has the appropriate chemical characteristics as well as pharmacodynamic and pharmacokinetic properties is a resource and time-intensive task.4 Large quantities of data from HTS projects, including the negative data (non-hits), are underutilised as a result of this. One way to make use of all the screening results is by analysing the data in parallel by employing in silico data mining algorithms. These machine learning techniques not only help with data interpretation, but can also be used for predicting the activities of new compounds.5
In recent literature, Bayesian classifiers based on Bayes' theorem have been used to build in silico activity models for efficient identification of new actives.6,7 Since 2004, this method has been applied for modelling kinase inhibitors,8,9,10 Escherichia coli dihydrofolate reductase inhibitors,11 G protein-coupled receptor (GPCR) ligands,12 oestrogen receptor inhibitors as well as metalloproteinase, nitric oxide synthase and other non-kinase enzyme inhibitors.10,13 These are key targets for diseases such as cancer and Alzheimer's.14 In addition, Ekins et al.15,16 have employed public whole-cell Mycobacterium tuberculosis (Mtb) HTS data to demonstrate a 10-fold enrichment on typical hit rates when compounds are prioritized using Bayesian models.
Currently, there is no literature demonstrating Bayesian probability applied to antimalarial activity prediction. This is despite the availability of published Plasmodium falciparum activity datasets, including whole-cell screens from GlaxoSmithKline (GSK, the TCAMS library) and the St Jude Children's Research Hospital.17,18 The green-fluorescence based assay used in these screens is phenotypic, not target specific and as a result, the active compounds cover a range of chemical and physical properties, depending on the mechanism of action of that molecule. Ekins et al. used Mtb whole-cell data for model generation. Currently, their studies appear to be the only available references to Bayesian modelling of multimodal distributions.15,16 Other studies apply Bayesian probabilities to specific targets. The extent to which inhibitors of different antimalarial targets differ in chemical space is not fully understood, however it is reasonable to hypothesise that Bayesian models may perform better using compounds acting on a single target in the training set. Another reason for the lack of published models is the absence of available inactive or negative data. The exception to this is the St Jude's set where the structures and bioactivities for the entire library of 309,474 compounds have been disclosed.
The quinoline-based compounds (particularly CQ) have been shown to inhibit P. falciparum growth by interrupting the parasite's haemozoin (Hz) formation pathway, resulting in increased cytotoxic free haem within the parasite cell.19,20 Resistance to CQ is not directly related to the production of Hz from free haem. Rather, gene mutations encoding the PfCRT protein in the parasite's acidic digestive vacuole (DV) membrane allow for a structure-specific efflux from the site of therapeutic action.21 As a result, the Hz formation pathway continues to be an attractive drug target. Carter et al.22 demonstrated the ability of cheap neutral detergents such as Nonidet-P40 (NP-40) to mimic neutral lipids present in the DV that are believed to act as nucleation points for haem crystallisation. This enables synthetic Hz, known as β-haematin (βH), to be produced efficiently and reliably in an extracellular environment from commercially available haematin under physiological conditions of temperature and pH. This assay is especially robust when combined with the use of pyridine to produce a colorimetric ferrichrome for quantitative measurement.23 Furthermore, quinoline compounds were shown to inhibit βH formation in a dose dependent manner, resulting in the development of a cost-effective assay for βH inhibitors.7
Since 2010, an NP-40 based detergent mediated pyridine ferrichrome assay has been applied in HTS efforts to discover new antimalarial scaffolds. A pilot screen on 38,400 compounds in the Vanderbilt University (VU) compound library confirmed the robustness of the assay with favourable Z′ and drift values.24 From the 161 novel βH inhibitors found, 48 inhibited parasite growth by ≥90% at 23 μM. Subsequently, Sandlin et al. screened the 144,330 remaining compounds in the library using the same procedure.25 This identified a further 530 βH inhibiting compounds (>80% inhibition at 19.3 μM) of which 171 showed whole cell activities (IC50 = 0.11 − 17.8 μM). The NP-40 assay has also been employed to test ∼200 bioactive compounds synthesised by the group of Inokuchi and co-workers at Okayama University (OU) in Japan. These compounds are neocryptolepine and isocryptolepine derivatives with long amine side chains for which the data is already publically available.26,27,28,29,30
In this study, a virtual screening approach for discovering βH formation and P. falciparum growth inhibitors has been validated by employing combined HTS data, including published data and as yet unpublished βH screening data for the 13,533 active TCAMS compounds (which will be disclosed in a later publication) as training sets. Two models were created, the first which uses VU, TCAMS, OU as well as in-house University of Cape Town (UCT) data as a training set to predict βH activity and the second which includes the biologically inactive St Jude's compounds in the training set for modelling P. falciparum bioactivity. It is important to note that only known βH inhibitors were used as actives in the training set for in vitro antimalarial activity. Although the detergent based assay for βH formation does not give definitive proof of the mechanism of whole-cell therapeutic action, it was hypothesized that most of the bioactive molecules used in generating the model would be Hz inhibitors, allowing for a single-target training set. For this reason, the St. Jude's actives were excluded since their targets are, for the most part, unknown. Finally, the generated Bayesian models were employed to predict the βH inhibitory and antimalarial activity of 1510 U.S. Food and Drug Administration (FDA) approved drugs as well as purchasable compounds from Sigma-Aldrich's drug-like molecule library (AldrichCPR). A selection of 34 of these compounds were purchased and tested for both βH inhibition and in vitro parasite growth inhibition.
2. Results and Discussion
2.1 Optimisation of Bayesian models
Model for predicting inhibition of βH formation
It is generally accepted that Bayesian models perform more effectively when the training data covers sufficient chemical space and if meaningful molecular features can be generated.7 This was tested by creating models based only on the VU data with increasing numbers of negative data points. A group of 339 randomly selected VU compounds was excluded from the training set to be used as a test set and the models were used to predict whether they were active or inactive. Finally, all the βH data from TCAMS, OU and UCT were also added to the training set (Table 1). As expected, the Receiver Operating Characteristic (ROC) score increased with increasing numbers of compounds in the training set. The VU test set predictions also improved from 78% to 83% correct as VU inactives were added, however the percentage dropped to 77 when compounds from different libraries (covering wider chemical space) were incorporated into the training set. See Supplementary Data Table S1 and Figure S1 for further details on cross-validation of the model.
Table 1.
Optimisation of βH model using a cut-off of 100 μM, with increasing numbers of inactive compounds from the VU set. The test set contained 339 VU samples.
| Total βH actives in training set | Total βH inactives in training set | ROC score for model (leave-one-out) | VU test set correctly predicted |
|---|---|---|---|
| 1,000 | 1,000 | 0.876 | 78% |
| 1,000 | 6,000 | 0.901 | 80% |
| 1,000 | 31,000 | 0.901 | 83% |
| 1,000a | 51,000a | 0.905 | 83% |
| 2,113b | 64,118b | 0.915 | 77% |
These compounds were prepared at pH 5 in the calculation.
This set incorporated VU, TCAMS, OU and UCT data at pH 5.
Model for predicting parasite activity
An advantage of using Bayesian models over multiple linear correlations, typical in QSAR analysis and prediction, is that the precise IC50 becomes less important. The data are divided into an active and inactive set at some appropriate user-defined IC50 cut-off and the model built on the frequency of occurrence of particular molecular features. Conversely, traditional QSAR uses the measured IC50 value to build a mathematical model, where fairly small differences in experimental procedures can lead to significant effects on the fitted coefficients. This was an important consideration in electing to build a Bayesian model to predict parasite activity, since data were sourced and compared from different compound sets and tested in different laboratories with non-standardised assay procedures. However, this did not appear to disadvantage the models, because for most of the samples, their assignment to the active or inactive set was not dependent on a precise IC50 value, since they lay either well below, or well above the cut-off value. Initially, a 2 μM cut-off with only the βH inhibiting TCAMS and VU compounds was used in the training set, where the latter compounds inhibited parasite growth by ≥90% at 23 μM. Then a selection of unpublished in-house UCT compounds were added as well as the VU <90% set in order to increase the numbers of inactive compounds. Finally, the inactive compound set from the St Jude's screen was incorporated for ROC optimisation. A test set consisting of 156 molecules from the TCAMS and VU screening data was used for basic validation of the models with excellent prediction statistics for the 2 μM cut-off model (Table 2).
Table 2.
Optimisation of P. falciparum activity models using IC50 cut-offs of 2 μM and 0.5 μM. The test set contained 156 molecules from the TCAMS and VU libraries. Data in bold are for the optimised model after adding all the data to the training set.
| Dataset added to training set | Total parasite actives in training set | Total parasite inactives in the training set | Cut-off IC50 (μM) | ROC score for model (leave-one-out) | % test set correctly predicted |
|---|---|---|---|---|---|
| TCAMS (βH inhibitors only) and VU (>90% inhibition at 23 μM) | 351 | 549 | 0.5 | 0.796 | ND |
| 806 | 94 | 2 | 0.937 | 85% | |
| As above + VU (<90% inhibition at 23 μM) + UCT | 352 | 790 | 0.5 | 0.842 | 70% |
| 817 | 325 | 2 | 0.959 | 94% | |
| As above + St Jude's (inactives only) | 352 | 42194 | 0.5 | 0.989 | 55% (at 0.5 μM)/92% (at 2 μM) |
| 817 | 41729 | 2 | 0.991 | 92% |
When an additional model was developed with a 0.5 μM cut-off using the same training sets, the test set prediction percentage dropped considerably when the St Jude's inactives were incorporated in the training set (Table 2). In this case, it was found that 95% of the test set compounds with IC50 values <2 μM were classified as active and 88% of compounds with IC50 values >2 μM were classified as inactive. This caused many false positive values based on an activity cut-off of 0.5 μM. This was probably as a result of the paucity of active compounds in the training set (only 352 actives out of 42194 compounds, 0.8% of the training set) below the 0.5 μM cut-off. Interestingly, this model predicted 92% of the compounds correctly if active test compounds were reclassified as those with IC50 values <2 μM.
Comparison of Molecular Descriptors for βH and Parasite Activity
The calculated descriptors which were used to build the models were compared in order to find the optimal ranges for best activity. In Table 3, the values represent the ranges for each feature which were most favourable amongst the active training set molecules. For the majority of features ranges are similar for the two models, suggesting that having a higher logP, molecular weight (MW), number of hydrogen bond donors (#HBD), number of hydrogen bond acceptors (#HBA), number of rotatable bonds (#R) and number of aromatic rings (#AR) would improve both activities. However, the βH model requires a lower #RB for optimal inhibition, whilst the parasite model requires a much larger #RB. This could be interpreted as a molecule needing to be planar for efficient haem interaction and requiring lipophilic saturated side chains to cross membranes for parasite activity. In addition, the βH model favours a FPSA of 0.29-0.33 whereas the parasite model prefers a lower range of 0.13-0.17. This analysis demonstrates the balance between these two features which needs to be achieved for a βH inhibiting antimalarial. However, both features had a low priority when calculating the Bayesian score, since they were ranked at or near the bottom of the probability weightings for both models. On the other hand, the features which agree between the models are more important in terms of calculating a probability for βH and parasite activity, suggesting that by optimising these features for βH activity, the likelihood of creating a βH inhibiting antimalarial is also improved.
Table 3.
Optimal feature ranges for the two activity models with the probability score rank for each feature. The word in brackets refers to the range values relative to the less favourable ranges. Those in italics exhibit contrary preferences.
| Feature | Rank in βH model | Preferable value/range in βH model | Rank in parasite model | Preferable value/range in parasite model |
|---|---|---|---|---|
| #HBD | 2 | 3-7 (More) | 4 | 3-8 (More) |
| #AR | 3 | 4-7 (More) | 2 | 5-8 (More) |
| MW | 4 | 460-719 (Larger) | 5 | 459-911 (Larger) |
| logP | 5 | 5-11 (Larger) | 7 | 4-11 (Larger) |
| #R | 6 | 5 (More) | 3 | 5-8 (More) |
| #HBA | 7 | 6 (More) | 9 | 7-13 (More) |
| #RB | 8 | 0-2 (Fewer) | 6 | 9-20 (More) |
| FPSA | 9 | 0.29-0.33 (Larger) | 8 | 0.13-0.17 (Smaller) |
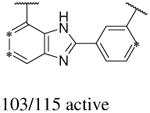
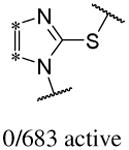
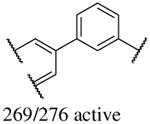
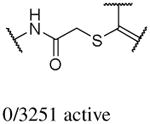
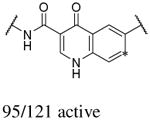
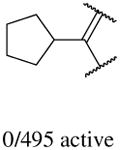
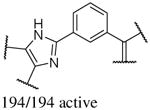
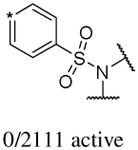
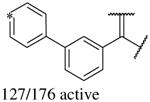
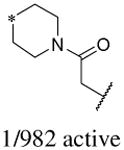
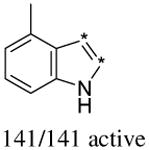
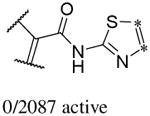
In addition to the molecular descriptors in Table 3, a large number of extended-connectivity fingerprints of depth 6 (ECFP_6) were used to create the model. These were invariably the highest ranking descriptors. The good ECFP_6 features for βH inhibition were 2-aryl benzimidazoles, indoles and quinolin-4(1H)-ones, while bad features included 2-thiolimidazoles and a variety of non-aromatic rings and heteroalkyl chains (Table 4). This result was consistent with the other feature observations which revealed greater #AR and fewer #RB for βH inhibition activity. Similarly, for parasite activity, fingerprints such as imidazoles, benzimidazoles and indoles dominated the good features. Interestingly, almost all the bad ECFP_6 features for parasite activity contained sulfur, either in an alkyl chain, as a sulfonamide or within a five-membered heteroaromatic ring. A selection of the dominant fingerprints is shown in Table 4 and in Supplementary Data Figure S2.
Table 4.
Examples of some of the most important extended-connectivity fingerprints of depth 6 (ECFP_6) for (a) the βH inhibition model (cut-off of 100 μM) and (b) the parasite growth inhibition model (cut-off of 2 μM). See Supplementary Data Figure S2 for more fingerprints.
| (a) βH inhibition model | (b) Parasite growth inhibition model | ||
|---|---|---|---|
| Good ECFP_6 | Bad ECFP_6 | Good ECFP_6 | Bad ECFP_6 |
|
|
|
|
|
|
|
|
|
|
|
|
2.2 Chemical space analysis
Spitzmüller et al.31 predicted the target space for the St Jude's and TCAMS whole-cell hit compounds and found over 200 P. falciparum hit proteins for 20,000 compounds. However, until recently, data for βH inhibitors has been largely unavailable. Analysis of the principle components of the TCAMS compounds used in the training set (Figure 1) demonstrates a distinct difference in the chemical space between those that inhibit βH formation by at least 60 % (red) at 19 μM and those with <40% inhibition (blue). The βH inhibitors are shifted in space such that they have a greater first and third principle component relative to the non-βH inhibitors. This shift corresponds to a lower #RB and larger FPSA, #AR, #R, #HBD, #HBA and MW. There were no significant differences in logP (Supplementary Table S2). Furthermore, 1029 assembly fragments were present in the TCAMS actives and only 50 were found to be common between the two sets, resulting in a low similarity score (Tanimoto distance) of 0.0486. This agrees with the Bayesian model comparison method where a large Bayesian distance of 72.3 was found (see Supplementary Figure S3), indicating that a training set consisting of only βH inhibitors may be more specific towards predicting Hz inhibiting antimalarials than one incorporating all 13,533 TCAMS actives. The VU βH hits which were incorporated into the training set cover a more confined chemical space, shifted relative to the TCAMS compounds by lower PC1 (Figure 1b). This indicates a lower MW and #AR or #R based on feature weighting for PC1 (Supplementary Table S2b). The OU compounds are largely scattered between the TCAMS and VU chemical space with several molecules possessing high MW, larger #R and #RB (long amine side chains) shifted into the higher PC1 range. The analysis demonstrates the relatively large chemical space covered in the training set by βH inhibitors from the different libraries.
Figure 1.
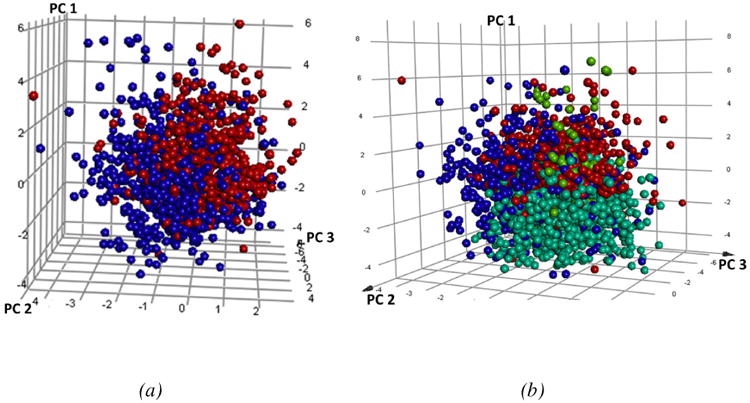
(a) Plot of the three principle components for the TCAMS βH inhibitors (red-larger PC1 and PC3) vs non-βH inhibitors (blue). (b) The VU (cyan) and OU (lime green) βH inhibitors relative to the TCAMS βH inhibitors (red) and non-βH inhibitors (blue).
With the chemical space of the training set identified, the validation sets were plotted in the same principle component space in order to determine how closely related the libraries are (Figure 2). As expected, the purchasable AldrichCPR drug-like compounds are contained within the space of the FDA approved drugs which are themselves more dispersed relative to the other sets. The VU compounds lie closest to the known drugs and the TCAMS and OU compounds with the largest PC1 are furthest in space from the validation sets. This diversity is important for training set verification as it demonstrates the degree of model versatility for predicting test sets which differ from the training sets.
Figure 2.
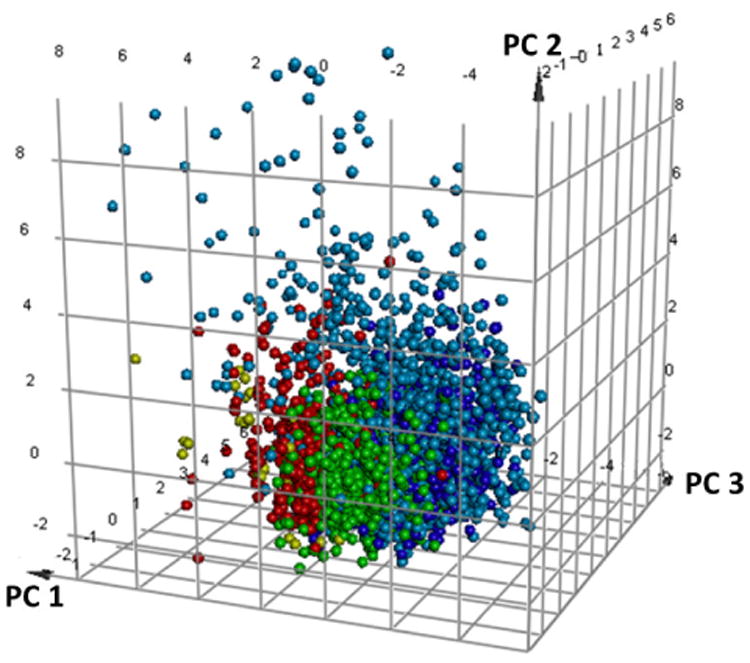
Validation sets including the FDA approved (light blue) and 1000 randomly selected molecules from the AldrichCPR drug-like compounds (dark blue) in relation to the TCAMS (red), OU (gold) and VU (green) βH inhibitors from the training set.
2.3 FDA approved compounds for model validation
For the purposes of validation, the optimised Bayesian model was applied to known drugs. Although βH inhibition is mostly unknown for FDA approved compounds, in vitro antimalarial activity is often available through PubChem (https://pubchem.ncbi.nlm.nih.gov/), even if they are not clinical antimalarials. The parasite bioactivity was predicted (using the 2 μM cut-off model) for 1510 molecules and ranked by likelihood of being bioactive from highest to lowest Bayesian score (selected portions shown in Supplementary Table S3). In the sorted list, all six of the known βH inhibiting drugs that are clinical antimalarials (as well as quinidine barbiturate and hydroxychloroquine) were found in the top 2.1% of the 1510 compounds. The clinical antimalarials were amodiaquine, quinine, quinidine, chloroquine, quinacrine and halofantrine. Mefloquine was also found within the top 4%. Additionally, of the 24 compounds that are not clinical antimalarials in the top 2.1%, nine have reported in vitro antimalarial activity in PubChem, ten have not been tested on P. falciparum and only three are reported inactive below 10 μM (Figure 3). Thus, among the 14 compounds for which antimalarial activity has been reported, this represents a hit rate of 81%. On the other hand, in the bottom 2.1%, 24 are reported as inactive (below 10 μM), seven have not been determined and only two compounds are reported as having in vitro antimalarial activity (in one case with contradicting evidence), representing a hit rate of 8% among those tested. However, finding active compounds in the bottom set does not negate the model since the active training set compounds were specifically βH inhibiting antimalarials. Thus, for example, the clinical antimalarials that are known to have a different mechanism of therapeutic action were also predicted at least 23 Bayesian score units lower than the βH inhibiting ones. These included the antifolates proguanil, pyrimethamine and sulfadoxine;32 primaquine which causes redox cycling33, the apicoplast inhibitor, doxycycline;34 and atovaquone, which disrupts the mitochondrial electron transport chain.35 This demonstrates the power of the model for specifically prioritising antimalarials that inhibit βH and are therefore likely to be Hz inhibitors. The 0.5 μM cut-off model was also tested and performed even better, finding the βH inhibiting antimalarials within top 1.8% of sorted compounds. Besides primaquine which went from rank #317 using the 2 μM model to #767 with the 0.5 μM model, only minor changes to the ranking of the other compounds was observed. The βH model was also applied to the FDA compounds. Amodiaquine, quinacrine and halofantrine were predicted correctly to be βH inhibitors while quinidine, quinine and chloroquine were falsely predicted negative. The reason for this is most likely the presence of the quinuclidine or alkyl amino side chains, absent in amodiaquine, which are predicted to be unfavourable for βH inhibitory activity, possibly because they add too many rotatable bonds (Table 3). Although quinacrine and halofantrine contain alkyl side chains, they also have an extra aromatic ring which contributes favourably to the βH inhibition score. This reveals a shortcoming of the βH model for recognising inhibitors that contain these functional groups.
Figure 3.
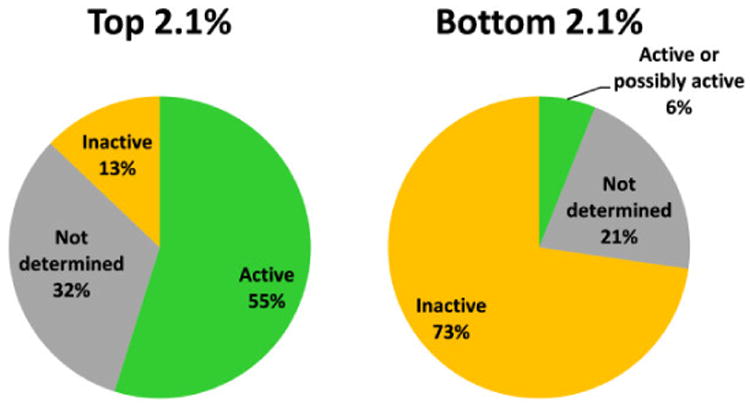
Graphical representation of the 2.1% of 1510 FDA approved drugs with highest and lowest Bayesian scores for activity against P. falciparum based on training sets of β-haematin inhibiting compounds using activity data against the parasite. Active compounds consist of clinical antimalarials as well as other drugs with proven activity against P. falciparum reported in PubChem.
2.4 Prioritization of a commercial library
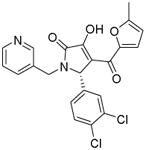
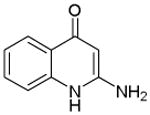
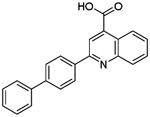
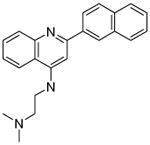
In order to test how the models would perform if used to prioritise compounds for HTS, 4,998 purchasable compounds were virtually screened (Figure 4). After calculating the Bayesian score using the βH model and selecting only those predicted active, about 900 compounds remained. The top 650 were chosen to screen using the whole-cell parasite model (2 μM cut-off) which predicted 178 compounds to be active. Compounds were then selected for purchase (Supplementary Table S4) according to the criteria specified in the methods section. By applying the βH model and only selecting predicted actives from this dataset, the bio-active and bio-inactive subsets were nested within the βH active subset (Table 5). This allowed for the most efficient and cost-effective way of validating the model.
Figure 4.
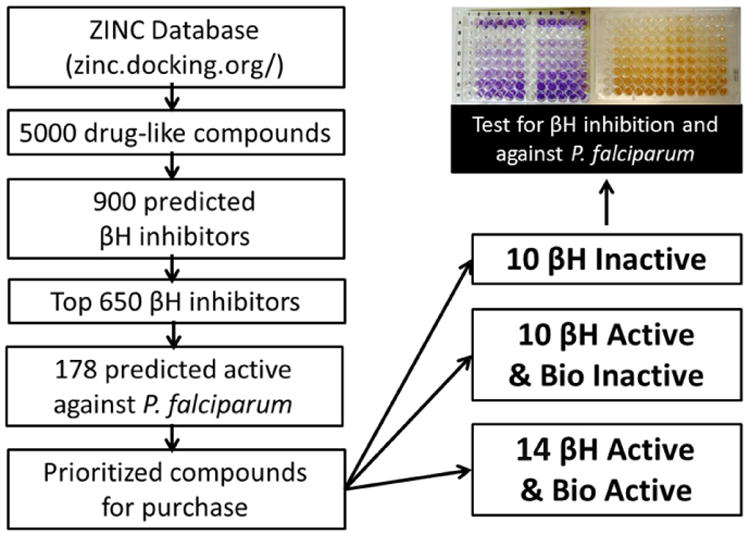
Flow chart of the strategy used to purchase and screen a small commercial library.
Table 5.
Experimentally active βH inhibitors from the purchased AldrichCPR compounds, prioritised using Bayesian models.
| Compound code | Structure | βH activity Bayesian prediction score | Parasite activity Bayesian prediction score | Measured βH IC50 (μM) | Measured NF54 IC50 (μM) |
|---|---|---|---|---|---|
| P18 |
|
23.0983 | -29.0591a -24.8557b |
88 | >10 |
| P23 |

|
43.3948 | 17.5493a 21.2006b |
22 | >10 |
| P27 Original structure from ZINC (top) |

|
-3.58476 | 5.73788a 5.74298b |
N/A | N/A |
| Corrected Structure confirmed by NMR and MS (bottom) |

|
-0.91 | 18.6400a 19.1900b |
66 | 0.082 ± 0.014 |
| P29 |
|
18.4158 | 4.76898a 54.6788b |
85 | >10 |
| P33 |
|
-2.52201 | 1.07767a 3.6050b |
46 | >10 |
| P34 |
|
11.5085 | -0.553378a 1.13127b |
26 | 0.079 ± 0.026 |
0.5 μM cut-off model
2 μM cut-off model
All of the ten purchased compounds predicted to be inactive against βH formation below 100 μM were indeed found to be inactive, even up to 500 μM. Of the 24 predicted βH inhibiting compounds, six showed IC50 values below 100 μM and two between 200-500 μM. This gave a hit rate for βH activity of 25%, a >25-fold enrichment over random screening for βH inhibitors at a cut-off of 100 μM (based on the hit-rate in the VU screen).25 Of these six compounds, five were also predicted to be bioactive (P23, P27, P29, P33 and P34). Two were found to have whole-cell IC50 values below 2 μM in the CQ-sensitive NF54 strain of P. falciparum (P27: 82 nM and P34: 79 nM). Interestingly, both of these compounds were quinolines bearing structural similarities to known antimalarials quinine/quinidine (QN/QD) and chloroquine respectively, despite the drug molecules being absent from the training set. The QN/QD derivative (P27) was represented in the ZINC database and sold by Sigma-Aldrich as an analogue lacking both the 9-hydroxy and 6-methoxy groups. However, Roepe and co-workers have previously shown the importance of the hydroxyl moiety for β-haematin and parasite activity in QN.36 This was consistent with crystal structures reported by de Villiers et al.37 which demonstrated coordination of the QN and QD hydroxyl oxygen atoms to the Fe(III) centre of haem, an interaction deemed critical for inhibition of Hz formation. In light of this previous research, which seemed to contradict our finding, nuclear magnetic resonance (NMR) and mass spectrometry (MS) experiments were carried out in order to confirm the structure of P27. As anticipated, the spectra confirmed that the major structure of the QN/QD derivative (>90%) did indeed possess the hydroxyl moiety after all, revealing that P27 is either cinchonine (CN) or cinchonidine (CD). Furthermore, there was evidence of an impurity (<10%) containing the quinoline methoxy group, possibly corresponding to QN or QD (See Supplementary Figure S4 for spectra). This finding reemphasises the importance of proving the composition of hit compounds obtained from HTS, particularly those in milligram quantities for which structural and purity information is often not supplied by the distributor. Additional identity proof was evident from the parasite activity (NF54) for P27 of 82 nM found in this study which corresponds closely to the activity of CN against the Dd2 strain.36 We retrospectively calculated the Bayesian probability score for the actual structure of P27 with the hydroxyl group in place (Table 5) which showed that CN/CD was in fact more likely to be active both against βH formation (Bayesian score of -0.91 vs -3.58) and parasite growth (19.19 vs 5.74) than the 9-dehydroxy derivative.
As expected, none of the other compounds were potent parasite growth inhibitors, either because they were predicted bio-inactive or because they were false positives for βH inhibition activity. Since two of the 14 testable bioactive compounds were actually active, the hit rate was 14%, a 140-fold enrichment over random screening for compounds targeting Hz inhibition (based on the hit rate from the VU screen for β-haematin inhibiting antimalarials).25 However, in a HTS protocol for discovery of βH actives, only this subset would have been tested against the parasite, resulting in a 33% hit rate.
The parasite model built on βH inhibitors successfully identified the Hz inhibiting FDA approved antimalarials without first filtering out those predicted to be inactive against βH formation. The same approach was retrospectively applied to the AldrichCPR compounds to compare the procedures for prioritisation. At a cut-off of 0.5 μM (which performed best when predicting the FDA compounds), there were few differences in the prioritised compounds that would have been purchased for bioactivity (aside from small changes in the order of their probability scores). In fact, an additional derivative of quinidine (a 6-ethoxyquinoline with a quinuclidine ethyl instead of a 6-methoxyquinoline with a quinuclidine vinyl group) appeared in the top three predicted bioactives which had previously been filtered out as a non-βH inhibitor. Overall, 13 of the 14 molecules purchased were also predicted active when filtering only for bioactivity.
3. Conclusions
Although HTS has become a vital tool for drug discovery, it remains an expensive, time consuming and extremely specialised process. The implementation of machine learning approaches such as Bayesian modelling is able to prioritise compounds for HTS resulting in improved hit rates using fewer test compounds. This is especially important for combating neglected tropical diseases such as malaria, where resources and capacities for research are limited. Creating in silico models from data contributed by previous HTS efforts is not only useful for future HTS prioritisation, but is an effective way to make use of the all the available data, including inactives, from previous screens. The results of this work have shown that Bayesian models can be applied to antimalarial compounds which are βH inhibitors with impressive enrichment rates relative to random screening. The validation sets strongly suggest that the chemical space of the active compounds in the parasite model is specific for Hz inhibiting antimalarials. This finding also raises the intriguing possibility that models trained from compounds with other known targets may be able to be similarly used in antimalarial drug discovery. When combined with in silico techniques for prioritising ADMET properties, this approach may have a role in the future identification of novel antimalarials.
4. Experimental and computational methods
4.1 Training set data
GSK (TCAMS) and St Jude's whole-cell screening data were downloaded from the ChEMBL database (www.ebi.ac.uk/chemblntd). The βH activity data were sourced from previous HTS collaborations between Vanderbilt University (VU), the University of Cape Town (UCT) and Okayama University (OU), most of which are publically available.25,26,27,28,29,30
4.2 Comparing the chemical space of libraries
Principle component analysis (PCA) was carried out in Discovery Studio38 using the following descriptors: logP, MW, #RB, #R, #AR, #HBA and #HBD. The assembly method for comparing libraries decomposed the molecules into unique occurrences of ring, bridge or chain assemblies.39 The libraries were then compared using Tanimoto similarity of the assemblies. The βH hits (taken at >60% inhibition at 19 μM) were compared to the non-hits (<40%) using two Bayesian classification models and a Bayesian distance based on the Bayesian scores of each sample in the set (see Supplementary Data Figure S3).
4.3 Building Bayesian models
All data were modelled using Discovery Studio's38 built-in Bayesian categorization, based on Bayes' theorem (eq. 1):
| (1) |
where p(h|d) is the probability that a molecular feature (d) contributes to activity (h) in a test molecule, p(d|h) is the prior probability of the feature being present in an active compound in the training set, p(h) is the probability of any compound in the training set being active and p(d) is the probability of the feature being present in any molecule in the training set.
Input structure data files (SDFs) containing structural and activity data were imported into Discovery Studio and the sample data marked as active or inactive based on a user-defined IC50 cut-off. In the case of the βH inhibiting model, the samples were represented at pH 5 to match the conditions of the acidic DV. Default input descriptors from which the program can learn to distinguish active from inactive compounds were chosen. These 2D parameters were calculated by the program during the simulation: logP, MW, #RB, #R, #AR, #HBA, #HBD and ECFP_6. The model allocated each feature a probability score, weighted by a Laplacian-corrected estimator based on the frequency of occurrence of that feature in the active and inactive sets. In order to predict the likelihood of activity for a test compound, weights for the different features were summed to give a probability estimate.
Internal validation of the generated models was determined by the ROC score, based on the area under the plot of true positive rate vs false positive rate (ROC curve). These rates were calculated by leaving each molecule out of the training set one at a time (leave-one-out cross validation), or by leaving one fifth of the training set out (5-fold cross validation) and predicting their activities with those remaining. A score of 1 represents a perfect prediction with no false positives while 0.5 represents no enrichment. The ROC score was optimised by combining several datasets and generating models with different IC50 cut-offs for activity input. Training sets excluded several compounds for use as external test sets.
4.4 Model validation using external datasets
The DrugBank database (http://www.drugbank.ca/) contains 1510 FDA approved small molecule drugs.40,41 These compounds were used as a test set to measure the accuracy of the Bayesian models since many have reported antimalarial activity data in PubChem (https://pubchem.ncbi.nlm.nih.gov/). In addition to this validation method, the ZINC database (http://zinc.docking.org/), a free collection of commercially available compounds for virtual screening was employed.42 Purchasable samples from the AldrichCPR catalogue in ZINC were filtered through the models, listed according to predicted activity probabilities and where similar structures occurred; only one analogue was selected. Compounds were also excluded if they were currently unavailable or if they were expensive. Three sets of compounds were then purchased from Sigma-Aldrich; ten molecules predicted to be inactive for βH inhibition, ten with high probability of being βH inhibitors and fourteen predicted to be both βH inhibitors and biologically active. These compounds were then tested for βH inhibition using the NP-40 method described previously43 and against the NF54 strain of P. falciparum.44,45,46
Supplementary Material
Acknowledgments
Research reported in this publication was supported by the National Institute of Allergy and Infectious Diseases of the National Institutes of Health under Award Number R01AI110329. The content is solely the responsibility of the authors and does not necessarily represent the official views of the National Institutes of Health. We thank the Centre for High Performance Computing (CHPC) for use of Discovery Studio. We thank David W. Wright, Rebecca D. Sandlin and Kim Y. Fong, Department of Chemistry, Vanderbilt University, Nashville, Tennessee and Aneesa Omar, Roger Hunter and Fabrizio L'abbate, Department of Chemistry, University of Cape Town for as yet unpublished data incorporated in the training sets.
Footnotes
Supplementary data: Supplementary data associated with this article can be found in the online version at http://…
Publisher's Disclaimer: This is a PDF file of an unedited manuscript that has been accepted for publication. As a service to our customers we are providing this early version of the manuscript. The manuscript will undergo copyediting, typesetting, and review of the resulting proof before it is published in its final citable form. Please note that during the production process errors may be discovered which could affect the content, and all legal disclaimers that apply to the journal pertain.
References
- 1.Ariey F, Witkowski B, Amaratunga C, Beghain J, Langlois A, Khim N, Kim S, Duru V, Bouchier C, Ma L, Lim P, Leang R, Duong S, Sreng S, Suon S, Chuor CM, Bout DM, Menard S, Rogers WO, Genton B, Fandeur T, Miotto O, Ringwald P, Le Bras J, Berry A, Barale J, Fairhurst RM, Benoit-Vical F, Mercereau-Puijalon O, Menard D. Nature. 2014;505:50. doi: 10.1038/nature12876. [DOI] [PMC free article] [PubMed] [Google Scholar]
- 2.Global Report on Antimalarial Drug Efficacy and Drug Resistance: 2000–2010. WHO Press; Switzerland: 2010. [Google Scholar]
- 3.Dondorp AM, Nosten F, Yi P, Das D, Phyo AP, Tarning J, Lwin KM, Ariey F, Hanpithakpong W, Lee SJ, Ringwald P, Silamut K, Imwong M, Chotivanich K, Lim P, Herdman T, An SS, Yeung S, Singhasivanon P, Day NPJ, Lindegardh N, Socheat D, White NJ. New Engl J Med. 2009;361:455. doi: 10.1056/NEJMoa0808859. [DOI] [PMC free article] [PubMed] [Google Scholar]
- 4.Martis EA, Radhakrishnan R, Badve RR. J Appl Pharm Sci. 2011;1:2. [Google Scholar]
- 5.Bender A. Bayesian Methods in Virtual Screening and Chemical Biology. In: Bajorath J, editor. Chemoinformatics and Computational Chemical Biology, Methods in Molecular Biology. Vol. 672. Springer; 2011. pp. 175–195. [DOI] [PubMed] [Google Scholar]
- 6.Bayes T. Philos Trans R Soc London. 1763;53:370. [Google Scholar]
- 7.Balfer J, Bajorath J. J Chem Inf Model. 2014;54:2451. doi: 10.1021/ci500410g. [DOI] [PubMed] [Google Scholar]
- 8.Xia X, Maliski EG, Gallant P, Rogers D. J Med Chem. 2004;47:4463. doi: 10.1021/jm0303195. [DOI] [PubMed] [Google Scholar]
- 9.Klon AE, Glick M, Thoma M, Acklin P, Davies JW. J Med Chem. 2004;47:2743. doi: 10.1021/jm030363k. [DOI] [PubMed] [Google Scholar]
- 10.Diller DJ, Hobbs DW. J Med Chem. 2004;47:6373. doi: 10.1021/jm049902r. [DOI] [PubMed] [Google Scholar]
- 11.Bender A, Mussa HY, Glen RC. J Biomol Screen. 2005;10:658. doi: 10.1177/1087057105281048. [DOI] [PubMed] [Google Scholar]
- 12.Renault N, Laurent X, Farce A, Bakali JE, Mansouri R, Gervois P, Millet R, Desreumaux P, Furman C, Chavatte P. Chem Biol Drug Des. 2013;81:442. doi: 10.1111/cbdd.12095. [DOI] [PubMed] [Google Scholar]
- 13.Crisman TJ, Bender A, Milik M, Jenkins JL, Scheiber J, Sukuru SCK, Fejzo J, Hommel U, Davies JW, Glick M. J Med Chem. 2008;51:2481. doi: 10.1021/jm701314u. [DOI] [PubMed] [Google Scholar]
- 14.Fang J, Yang R, Gao L, Zhou D, Yang S, Liu AL, Du G. J Chem Inf Model. 2013;53:3009. doi: 10.1021/ci400331p. [DOI] [PubMed] [Google Scholar]
- 15.Ekins S, Reynolds RC, Kim H, Koo MS, Ekonomidis M, Talaue M, Paget SD, Woolhiser LK, Lenaerts AJ, Bunin BA, Connell N, Freundlich JS. Chem Biol. 2013;20:370. doi: 10.1016/j.chembiol.2013.01.011. [DOI] [PMC free article] [PubMed] [Google Scholar]
- 16.Ekins S, Freundlich JS, Hobrath JV, White EL, Reynolds RC. Pharm Res. 2014;31:414. doi: 10.1007/s11095-013-1172-7. [DOI] [PMC free article] [PubMed] [Google Scholar]
- 17.Gamo FJ, Sanz LM, Vidal J, Cozar Cd, Alvarez E, Lavandera JL, Vanderwall DE, Green DVS, Kumar V, Hasan S, Brown JR, Peishoff CE, Cardon LR, Garcia-Bustos JF. Nature. 2010;465:305. doi: 10.1038/nature09107. [DOI] [PubMed] [Google Scholar]
- 18.Guiguemde WA, Shelat AA, Bouck D, Duffy S, Crowther GJ, Davis PH, Smithson DC, Connelly M, Clark J, Zhu F, Jiménez-Díaz MB, Martinez MS, Wilson EB, Tripathi AK, Gut J, Sharlow ER, Bathurst I, Mazouni FE, Fowble JW, Forquer I, McGinley PL, Castro S, Angulo-Barturen I, Ferrer S, Rosenthal PJ, DeRisi JL, Sullivan DJ, Jr, Lazo JS, Roos DS, Riscoe MK, Phillips MA, Rathod PK, Van Voorhis WC, Avery VM, Guy RK. Nature. 2010;465:311. doi: 10.1038/nature09099. [DOI] [PMC free article] [PubMed] [Google Scholar]
- 19.Egan TJ, Ross DC, Adams PA. FEBS Lett. 1994;352:54. doi: 10.1016/0014-5793(94)00921-x. [DOI] [PubMed] [Google Scholar]
- 20.Combrinck JM, Mabotha TE, Ncokazi KK, Ambele MA, Taylor D, Smith PJ, Hoppe HC, Egan TJ. ACS Chem Biol. 2013;8:133. doi: 10.1021/cb300454t. [DOI] [PMC free article] [PubMed] [Google Scholar]
- 21.Fidock DA, Nomura T, Talley AK, Cooper RA, Dzekunov SM, Ferdig MT, Ursos LMB, Sidhu AS, Naude B, Deitsch KW, Su X, Wootton JC, Roepe PD, Wellems TE. Mol Cell. 2000;6:861. doi: 10.1016/s1097-2765(05)00077-8. [DOI] [PMC free article] [PubMed] [Google Scholar]
- 22.Carter MD, Phelan VV, Sandlin RD, Bachmann BO, Wright DW. Comb Chem High T Scr. 2010;3:285. doi: 10.2174/138620710790980496. [DOI] [PMC free article] [PubMed] [Google Scholar]
- 23.Ncokazi KK, Egan TJ. Anal Biochem. 2005;338:306. doi: 10.1016/j.ab.2004.11.022. [DOI] [PubMed] [Google Scholar]
- 24.Sandlin RD, Carter MD, Lee PJ, Auschwitz JM, Leed SE, Johnson JD, Wright DW. Antimicrob Agents Chemother. 2011;55:3363. doi: 10.1128/AAC.00121-11. [DOI] [PMC free article] [PubMed] [Google Scholar]
- 25.Sandlin RD, Fong KY, Wicht KJ, Carrell HM, Egan TJ, Wright DW. Int J Parasitol Drugs Drug Resist. 2014;4:316. doi: 10.1016/j.ijpddr.2014.08.002. [DOI] [PMC free article] [PubMed] [Google Scholar]
- 26.Lu WJ, Wicht KJ, Wang L, Imai K, Mei ZW, Kaiser M, Sayed IETE, Egan TJ, Inokuchi T. Eur J Med Chem. 2013;64:498. doi: 10.1016/j.ejmech.2013.03.072. [DOI] [PubMed] [Google Scholar]
- 27.Wang N, Wicht KJ, Wang L, Lu WJ, Misumi R, Wang MQ, Gokha AAAE, Kaiser M, El Sayed IET, Egan TJ, Inokuchi T. Chem Pharm Bull. 2013;61:1282. doi: 10.1248/cpb.c13-00639. [DOI] [PubMed] [Google Scholar]
- 28.Shaban E, Wicht KJ, Wang N, Mei ZW, Hayashi I, Aleem AA, Gokha E, Kaiser M, El Sayed IET, Egan TJ, Inokuchi T. Heterocycles. 2014;89:1055. [Google Scholar]
- 29.Wang N, Wicht KJ, Imai K, Ngoc TA, Wang MQ, Kaiser M, Egan TJ, Inokuchi T. Bioorg Med Chem. 2014;22:2629. doi: 10.1016/j.bmc.2014.03.030. [DOI] [PubMed] [Google Scholar]
- 30.Wang N, Wicht KJ, Shaban E, Ngoc TA, Wang MQ, Hayashi I, Hossain MI, Takemasa Y, Kaiser M, El Sayed IET, Egan TJ, Inokuchi T. Med Chem Commun. 2014;5:927. [Google Scholar]
- 31.Spitzmüller A, Mestres J. PLoS Comput Biol. 2013;9:e1003257. doi: 10.1371/journal.pcbi.1003257. [DOI] [PMC free article] [PubMed] [Google Scholar]
- 32.Nzila A. J Antimicr Chemother. 2006;57:1043. doi: 10.1093/jac/dkl104. [DOI] [PubMed] [Google Scholar]
- 33.Vásquez-Vivar J, Augusto O. J Biol Chem. 1992;267:6848. [PubMed] [Google Scholar]
- 34.Dahl EL, Shock JL, Shenai BR, Gut J, DeRisi JL, Rosenthal PJ. Antimicrob Agents Chemother. 2006;50:3124. doi: 10.1128/AAC.00394-06. [DOI] [PMC free article] [PubMed] [Google Scholar]
- 35.Baggish AL, Hill DR. Antimicrob Agents Chemother. 2002;46:1163. doi: 10.1128/AAC.46.5.1163-1173.2002. [DOI] [PMC free article] [PubMed] [Google Scholar]
- 36.Alumasa JN, Gorka AP, Casabianca LB, Comstock E, de Dios AC, Roepe PD. J Inorg Bio. 2011;105:467. doi: 10.1016/j.jinorgbio.2010.08.011. [DOI] [PMC free article] [PubMed] [Google Scholar]
- 37.de Villiers KA, Gildenhuys J, Roex Tl. ACS Chem Biol. 2012;7:666. doi: 10.1021/cb200528z. [DOI] [PubMed] [Google Scholar]
- 38.Discovery Studio Modeling Environment, v4.0. Accelrys Software Inc.; San Diego: 2013. [Google Scholar]
- 39.Bemis GW, Murcko MA. J Med Chem. 1996;39:2887. doi: 10.1021/jm9602928. [DOI] [PubMed] [Google Scholar]
- 40.Wishart DS, Knox C, Guo AC, Shrivastava S, Hassanali M, Stothard P, Chang Z, Woolsey J. Nucleic Acids Res. 2006;34:668. doi: 10.1093/nar/gkj067. [DOI] [PMC free article] [PubMed] [Google Scholar]
- 41.Wishart DS, Knox C, Guo AC, Cheng D, Shrivastava S, Tzur D, Gautam B, Hassanali M. Nucleic Acids Res. 2008;36:901. doi: 10.1093/nar/gkm958. [DOI] [PMC free article] [PubMed] [Google Scholar]
- 42.Irwin JJ, Sterling T, Mysinger MM, Bolstad ES, Coleman RG. J Chem Inf Model. 2012;52:1757. doi: 10.1021/ci3001277. [DOI] [PMC free article] [PubMed] [Google Scholar]
- 43.Raj R, Mehra V, Gut J, Rosenthal PJ, Wicht KJ, Egan TJ, Hopper M, Wrischnik LA, Land KM, Kumar V. Euro J of Med Chem. 2014;84:425. doi: 10.1016/j.ejmech.2014.07.048. [DOI] [PubMed] [Google Scholar]
- 44.Makler MT, Ries JM, Williams JA, Bancroft JE, Piper RC, Gibbins BL, Hinrichs DJ. Am J Trop Med Hyg. 1993;48:739. doi: 10.4269/ajtmh.1993.48.739. [DOI] [PubMed] [Google Scholar]
- 45.Trager W, Jensen JB. Science. 1976;193:673. doi: 10.1126/science.781840. [DOI] [PubMed] [Google Scholar]
- 46.Joshi MC, Wicht KJ, Taylor D, Hunter R, Smith PJ, Egan TJ. Eur J Med Chem. 2013;69:338. doi: 10.1016/j.ejmech.2013.08.046. [DOI] [PubMed] [Google Scholar]
Associated Data
This section collects any data citations, data availability statements, or supplementary materials included in this article.


