

Abstract
Background
Inequities in health need to be monitored and necessary actions should be taken to reduce them. This study aimed to determine the socioeconomic distribution of self-reported chronic diseases and self-assessed health (SAH) in Turkey and try to evaluate the determinants of such inequalities in terms of their contributions.
Methods
Cross-sectional data from the Turkish Health Survey conducted during year 2008, covering 14,655 adults aged 15 or older were analyzed for the first time to assess socioeconomic inequalities in chronic disease and suboptimal SAH prevalence by calculating concentration index (CI), which ranges from -1 to +1 (concentration of disease among lower and higher socioeconomic groups) and the relative index of inequality (RII), reflecting the prevalence ratio between the two extremes of wealth.
Results
Several diseases and sub-optimal SAH were more concentrated among those with lower incomes. The concentration indices of chronic obstructive pulmonary disease (COPD), arthritis, chronic bronchitis, migraine and poor SAH were -0.180 (95% CI = -0.241,-0.111), -0.126 (95% CI = -0.148,-0.105),-0.118 (95%CI = -0.149,-0.079), -0.248(95%CI = (-0.278,-0.219) respectively. Of all chronic diseases, COPD demonstrated the highest relative inequality with a RII value of 2.51 (95%CI: 1.57-4.01). Income was the major contributor to inequality in occurrence of COPD (88.2%), migraine (80.4%) and arthritis (77.7%).
Conclusion
The findings indicate that majority of chronic diseases were more concentrated among less wealthy individuals in Turkey. Wealth and education had the largest contributions to observed inequalities. These inequalities need to be explicitly addressed and vulnerable subgroups should be targeted to reduce these socioeconomic disparities.
Keywords: Chronic disease, Self assessed health, Inequality, Decomposition method
Introduction
Burden of non-communicable diseases (NCDs) are increasing worldwide and global disease burden is shifting away from communicable to non-communicable diseases in terms of disability adjusted life years for the last two decades (1). In 2008, of the 57 million global deaths, 63% percent were due to NCDs and 80% of all these deaths occurred in low and middle income countries where most of the world’s population also live there (2). Turkey is experiencing an epidemi-ological transition like many developing countries and burden of NCDs and its risk factors are increasing in recent years. As a result, Ministry of Health started to pay more attention to reduce the burden of NCDs and prepared action plans to tackle with them (3). Hence, the surveillance of NCDs, their determinants and collecting data on other health related measures became an important task for Turkey. Self-reported morb-idity and self-assessed health are measures that are widely used in epidemiological studies which are closely related with morbidity, mortality, health services utilization and socioeconomic status (4, 5) Even there is a universal health insurance and there are some improvements in access to health care during last decade, some disparities in health outcomes still exist between geographical regions, education status and income groups in terms of infant mortality and self-assessed health in Turkey (6, 7). Reducing inequity in health outcomes is a major challenge in every country. Studies that evaluate the socioeconomic determinants of health may inform policy makers on effective measures to reduce inequities in health outcomes (8). Even there are some reports and studies on burden of NCDs and poor SAH in Turkey; few have assessed the socioeconomic determinants of these conditions (9).
Recent health economics literature from various settings provided tools for quantifying contributions of determinants to observed inequalities (10, 11). Being able to differentiate and grade the determinants of health inequalities enables prio-ritizing and targeting equitable health interventions. A recent study decomposed inequalities in SAH in Turkey for year 2003 however there is a lack of knowledge in composition of socioeco-nomic inequalities in chronic diseases using inequ-ality measures in our setting (12).
The aim of this study was to use a concentration index (CI) to quantify the socioeconomic distribution of not only SAH but also self-reported chronic conditions and to decompose these inequalities by quantifying the contributions of potential determinants such as age, gender, wealth, education level, marital status and geographical area lived in in Turkey for the first time using data from the Turkish Health Survey 2008.
Methods
Source of data and study design
Cross-sectional data from the national Turkish Health Survey conducted by Turkish Statistical Institute (TURKSTAT) during year 2008, covering 14,655 adults aged 15 or older were analyzed. All settlements in the territory of Republic of Turkey were covered in sample selection. Sample size of the survey is calculated to do estimations on the base of total of Turkey, urban and rural. Thus, the total sample size necessary was found to be 7 910 households. Since non-response is also taken into account when calculating the sample size, substitution for household or individual were not used in the survey. The sampling method of the survey was two staged stratified cluster sampling method. Clusters were selected in the first stage, households were selected within each selected clusters in the second stage. For urban areas and rural areas with municipal organization clustering was applied where a cluster included approximately 100 addresses. In the final stage, households were selected systematically within each selected cluster. These were selected with equal probability using systematic sampling method. The sampling frame used for this survey was the National Address Based Population Registry System (dated March 2008). The small villages with less than %1 of the country population are not covered in the sampling frame as they do not allow reaching the sufficient cluster size. Weighting procedures were carried out to obtain parameters from the data set resulting from sampling to represent the universe. Firstly, base weights which are inversely proportional to the overall selection probabilities were calculated for each sample respondent. In this stage, probabilities of selection of clusters, selection of households and then base weights were calculated by using these probabilities based on household and individual. In the second stage of weighting, base weights were adjusted to compensate the losses in the sample outcome due to non-response. In the final stage the weights are calibrated to the projected population distributions, using integrated calibration ratio method. The calibration is iterated and trimmed until any relative changes in the weights are within a pre-specified range. The final weights are then inflated by an overall inflation factor (13).
TURKSTAT made the ethical clearance and informed consent was obtained from each respondent prior to interview. In this study we used dataset with no identifiable information on the survey participant from Health Survey which is publicly available upon request from TURKSTAT (13).
Dependent variables
The dependent variables were the commonly reported morbidities and self-assessed health. Self-assessed health was evaluated by asking about the current health state of respondents, with the possible answers being “very good” 1), “good” 2), “moderate” 3), “bad” 4) or “very bad” 5). Responses were classified as a dichotomous measure: “very good”, “good” or “moderate” were coded as optimal SAH, and “bad” or “very bad” as poor health status (6, 14). Previous medical diagnosis of any of the following conditions: asthma, chronic bronchitis, chronic obstructive pulmonary disease, myocardial infarction, coronary artery disease, heart failure, hypertension, stroke, osteoporosis, diabetes mellitus(DM), cancer, depression, gastritis, allergy, migraine formed the morbidities. All chronic diseases were coded as dummy variables (yes/no).
Independent variables
The independent variables used in this survey were age, gender, level of education, marital status, location of residence, household size, work status, having an insurance and wealth. Participants’ age was categorized in to 7 age groups (15—24 years, 25-34 years, 35—44 years, 45—54 years, 55—64 years, 65-74 years, 75 years or more). Marital status was classified as married, divorced, widowed or never married). Education was ranked according to three categories: no formal schooling and less than primary school, primary school and secondary/high school completed, and university completed or above. Area of residence (rural or urban), household size (number of household≥5 or below 5) and work status (yes/no) formed other independent variables.
Wealth variable was constructed by using adult-equivalent household income per household member which was calculated by dividing the income for last month by the square root of the household size. Wealth was then divided into five quintiles, with first quintile representing the poorest wealth quintile and fifth quintile the richest (15).
Statistical analysis Concentration index
Socioeconomic inequality in self-reported chronic diseases and poor SAH prevalence was measured using the concentration index and relative index of inequality (RII). These measures take into account the distribution of the population across wealth quintiles. Concentration index (CI) is derived from the concentration curve (CC). The concentration curve plots the cumulative share of health variable against the cumulative share of the sample population, ranked by income, starting with the most disadvantaged person on the x-axis. If everyone, irrespective of socioeconomic status, has exactly the same value on the health variable, the CC will be a 45-degree line, which is also called the “line of equality”. The CI is computed as twice the area between the CC and the line of equality and (weighted) covariance of the health variable and a person’s relative rank in terms of economic status, divided by the variable mean. The concentration index value can vary between -1 and 1. If the health variable (i.e. asthma) is more concentrated amongst the poor, the CC would lie above the line of equality and CI will have negative values (16). In other words if the variable of interest is more concentrated at a lower (or higher) socioeconomic level, the concentration index will take negative (or positive) values. Multiplying the CI value by 75 gives an estimation of the percentage of the variable of interest to be redistributed from the richer half to the poorer half to reach a distribution of perfect equity. For example a CI value of 0.2 implies that equity can be achieved by redistributing 15% (0.2*75) of health from the rich to the poor (17). Finally, the contribution of the independent variables to economic-related inequality in SAH and selected chronic diseases were calculated via decomposition analysis. The concentration indexes were decomposed by the help of logit models. The method is explained in detail elsewhere (6).
Relative index of inequality
RII is the prevalence rate ratio between those at top rank (the lowest level of wealth) and those at rank zero(highest level of wealth) in other means it is the ratio of reported chronic illness of the most deprived relative to the most advantaged. RII is derived by cumulatively ranking the subjects by wealth then dividing the resulting ranks by the sample size of each category which gives a ridit score that varies between 0 and 1. Each of the outcomes was then regressed on these ridit scores, with the regression coefficients representing the relative index of inequality (RII) for binary outcomes (18). Log-binomial regression model was used to estimate RII (19). A RII value larger than one indicates that prevalence was higher among populations of lower socioeconomic status measured as wealth. RII values were adjusted for age, gender, household size, marital status, working status, urban/rural area, social insurance and education level. The data were analyzed with STATA/SE 11.0 software (Stata Corp, College Station, TX, USA). In order to avoid biasing effects, we took into account the unequal sampling weights from the Health Survey 2008 and we used the survey estimation techniques provided by STATA 11.0. Weights were used during descriptive statistics, multivariate analysis and decomposition of concentration indices.
The level of statistical significance was set to 0.05.
Results
In 2008, a total of 14,655 people from 5668 households participated in the study. The mean age of the participants of the study was 39.08 years (SD=14.37) and 50.9% were female. After excluding cases with missing values, analyses were conducted for 14,443(98.5%) individuals in total.
Table 1 presents the prevalence and concentration indices for each health outcome and sociodemo-graphic characteristic. Overall, arthritis showed the highest prevalence rate (17.7%) followed by gastritis (15.3%), migraine (15.3%) and hypertension (14.8%). Several diseases, such as Chronic Obstructive Pulmonary Disease (CI= -0.180), arthritis (CI= -0.126), chronic bronchitis (CI = -0.118), migraine (CI= -0.111), asthma (CI= -0.104), stroke (CI=-0.096), depression (CI=-0.072), and coronary heart disease (CI=-0.067), were more concentrated among those with lower incomes. Three conditions with positive concentration indices, such as cancer (CI= 0.058) allergic conditions (CI = 0.052) and diabetes mellitus (CI=0.023) were disproportionately reported by the greater income groups. Overall, 10.1% of participants rated their health status as bad or very bad. The CI for poor SAH was -0.248. Figure 1 presents the concentration curves of arthritis, COPD, poor SAH and cancer.
Table 1.
Occurrence and concentration indices of the 16 most commonly reported diseases and their socioeconomic determinants in Turkey, 2008
| Reported Diseases and conditions | Prevalence (%)* | Concentration Index (95% Confidence interval) |
|---|---|---|
| Chronic Obstructive Pulmonary Disease | 2.2 | -0.180(-0.241,-0.111) |
| Arthritis | 17.7 | -0.126(-0.148,-0.105) |
| Chronic Bronchitis | 8.0 | -0.118 (-0.149, -0.079) |
| Migraine | 15.3 | -0.111(-0.134,-0.086) |
| Asthma | 4.8 | -0.104(-0.145,-0.052) |
| Gastritis | 15.3 | -0.102(-0.109,-0.060) |
| Stroke | 1.1 | -0.096(-0.180,-0.007) |
| Depression | 4.1 | -0.072(-0.117,-0.016) |
| Coronary Heart Disease(Angina) | 6.3 | -0.067(-0.105,-0.028) |
| Heart Failure | 2.3 | -0.059(-0.122,-0.001) |
| Myocardial Infarction | 1.9 | -0.057(-0.132,0.008) |
| Osteoporosis | 12.5 | -0.045(-0.069,-0.016) |
| Hypertension | 14.8 | -0.010(-0.033,0.015) |
| Cancer | 0.8 | 0.058(-0.034,0.177) |
| Allergy | 7.8 | 0.052(0.018,0.088) |
| Diabetes Mellitus | 5.9 | 0.023(-0.017,0.062) |
| Self Assessed Health | ||
| Suboptimal SAH | 10.1 | -0.248(-0.222,-0.219) |
| Gender | ||
| Male | 49.1 | 0.029(0.016,0.038) |
| Female | 50.9 | -0.026(-0.036,-0.015) |
| Age | ||
| 15-24 | 22.7 | -0.059(-0.077,-0.038) |
| 25-34 | 23.6 | 0.026(0.009,0.047) |
| 35-44 | 19.4 | -0.026(-0.0481,-0.006) |
| 45-54 | 15.2 | 0.094(0.070,0.118) |
| 55-64 | 9.6 | 0.062(0.029,0.090) |
| 65-74 | 5.7 | -0.024(-0.066,0.010) |
| ≥75 | 3.7 | -0.184(-0.234,-0.132) |
| Household size | ||
| ≥5 | 38.6 | -0.230(-0.241,0.217) |
| 5< | 61.4 | 0.142(0.136,0.152) |
| Marital status | ||
| Single | 24.3 | 0.015(-0.004,0.034) |
| Widowed | 5.3 | -0.086(-0.131,-0.048) |
| Divorced | 1.3 | 0.146(0.078,0.233) |
| Married | 69.1 | -0.007(-0.008,0.005) |
| Working Status | ||
| Yes | 60.9 | 0.098(0.083,0.109) |
| No | 39.1 | -0.063(-0.070,0.053) |
| Geographical area | ||
| Urban | 69.9 | 0.124(0.116,0.131) |
| Rural | 30.1 | -0.286(-0.301,-0.271) |
| Wealth | ||
| Quintile 1(Poorest) | 22.5 | -0.772(-0.783,-0.767) |
| Quintile 2 | 17.5 | -0.363(-0.390,-0.360) |
| Quintile 3 | 20.5 | 0.017(-0.010,0.022) |
| Quintile 4 | 19.0 | 0.405(0.397,0.426) |
| Quintile 5(Richest) | 19.9 | 0.788(0.793,0.808) |
| Social insurance | ||
| Yes | 84.8 | 0.048(0.042,0.052) |
| No | 15.2 | -0.267(-0.288,-0.240) |
| Education | ||
| University | 18.3 | 0.375(0.359,0.389) |
| Primary+high school | 55.8 | -0.067(-0.078,-0.059) |
| Less than primary school | 25.9 | -0.326(-0.342,-0.302) |
* The numbers represent “population-weighted” percentages.
Fig. 1.
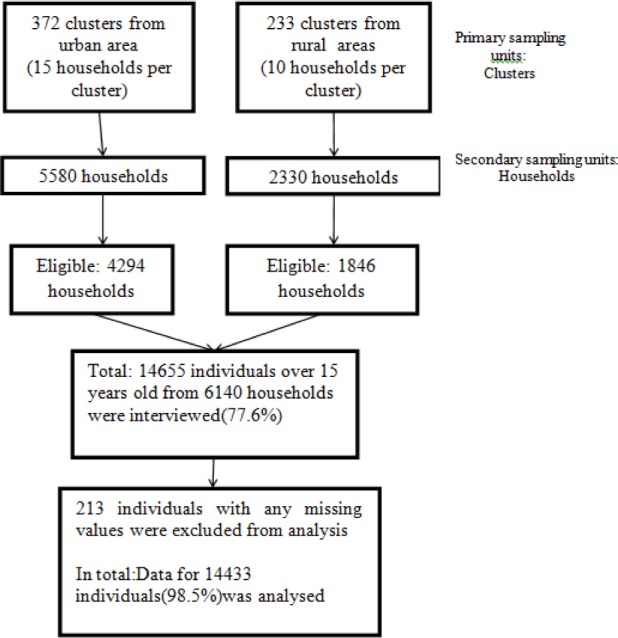
The study flowchart for sampling procedure
Concentration indices for potential determinants of health inequalities summarize the distributions of explanatory variables in the sample. They show that the elderly, aged >75 years, were commonly poor (CI=-0.184) whereas those of mid age (45–54) were mildly concentrated among the better off (CI = 0.094). Small households with less than 5 individuals living tended to be relatively well off economically (CI =0.142), whereas the opposite was true of with large households (CI = -0.230). Households with less than primary education level were generally poorer households (CI= -0.326) (Fig. 2).
Fig. 2.

Concentration curves for selected chronic diseases and self-assessed health
Table 2 presents morbidity rates for chronic diseases and SAH across income quintile groups. Upper bounds for first, second, third and fourth wealth quintiles were as follows; 213Turkish Liras (TL), 342 TL, 489 TL and 721 TL in 2008. The corresponding values expressed in US Dollars could be obtained by taking into account the average exchange rate at the 2008 in US Dollars (1 USD = 1.293 TL-2008 average) and in Euros (1 Euro=1.926 TL-2008 average) (20). Most of the chronic disease prevalence was higher in lowest income quintile compared to the prevalences at the highest income quintile except DM, allergic conditions and cancer. We generally found regular inequality in prevalence values of chronic diseases and self-assessed health in relative terms after controlling for other determinants such as respondents’ age, gender, and education level. Of all NCDs, chronic obstructive pulmonary disease demonstrated the highest relative inequality with a RII value of 2.51 (95%CI:1.57-4.01). There were also wide inequalities across wealth quintiles for poor SAH (RII 2.66 95% CI 2.21-3.20).
Table 2.
Chronic disease and poor self-assessed health prevalence (%) by wealth quintile, and wealth-related inequality among adults in Turkey
| Reported Diseases and conditions | Wealth Quintile 1 % | Wealth Quintile 2 % | Wealth Quintile 3 % | Wealth Quintile 4 % | Wealth Quintile 5 % | Relative index of inequality* RII (95% CI) |
|---|---|---|---|---|---|---|
| Chronic Obstructive Pulmonary Disease | 3.2 | 2.8 | 1.9 | 1.8 | 1.1 | 2.51(1.57-4.01) |
| Arthritis | 23.7 | 19.6 | 17.0 | 16.2 | 11.4 | 1.36(1.20-1.54) |
| Chronic Bronchitis | 11.5 | 8.1 | 7.1 | 7.1 | 5.8 | 1.88(1.49-2.38) |
| Migraine | 20.3 | 17.2 | 13.5 | 13.5 | 11.6 | 1.56(1.33-1.82) |
| Asthma | 30.3 | 18.0 | 19.1 | 17.1 | 15.6 | 1.81(1.34-2.44) |
| Gastritis | 19.9 | 15.8 | 14.0 | 12.9 | 13.4 | 1.49(1.28-1.74) |
| Stroke | 1.2 | 1.3 | 1.2 | 0.9 | 0.7 | 1.62(0.87-2.99) |
| Depression | 28.4 | 18.0 | 18.9 | 18.7 | 16.1 | 1.99(1.44-2.75) |
| Coronary Heart Disease | 7.4 | 6.3 | 6.4 | 6.4 | 4.7 | 1.19(0.93-1.54) |
| Heart Failure | 2.4 | 2.7 | 2.7 | 2.4 | 1.6 | 1.00(0.65-1.54) |
| Myocardial Infarction | 2.0 | 2.1 | 2.2 | 2.0 | 1.2 | 0.92(0.57-1.48) |
| Osteoporosis | 14.1 | 13.0 | 12.6 | 12.3 | 10.4 | 0.98(0.85-1.13) |
| Hypertension | 15.6 | 14.4 | 15.4 | 14.4 | 13.9 | 0.94(0.84-1.04) |
| Cancer | 0.6 | 1.0 | 0.8 | 0.7 | 1.0 | 0.65(0.31-1.37) |
| Allergy | 7.4 | 6.9 | 7.4 | 8.7 | 8.5 | 0.87(0.68-1.10) |
| Diabetes Mellitus | 5.9 | 5.5 | 6.4 | 5.5 | 6.1 | 0.81(0.64-1.03) |
| Self Assessed Health | 17.9 | 11.1 | 9.3 | 6.5 | 4.9 | 2.66(2.21-3.20) |
*RII values are adjusted for age, gender, household size, marital status, working status, urban/rural area, social insurance and education level
Table 3 presents adjusted odds ratios between self-assessed health (SAH), selected chronic conditions and determining factors. Older age, low level of education, being less wealthy and having any chronic disease was significantly associated with poor SAH in the multivariate analyses. However, no significant association was found between SAH and marital status, place of residence and gender. The probability of reporting COPD, migraine, arthritis, CHD and chronic bronchitis got higher with decreasing wealth status and increasing age after controlling for other explanatory factors. Individuals with single marital status reported less COPD, migraine, arthritis compared to married. Table 4 presents a decomposition analysis of concentration indices for chronic diseases with largest negative CI values including chronic obstructive pulmonary disease, arthritis, chronic bronchitis, migraine and self-assessed health. The main contributors to inequality in SAH were; wealth (52.5%), level of education (18.4%), and age (11.3%). Gender, marital status and area of residence played a less important role in terms of inequalities in SAH. Wealth and education level played major explanatory roles across the four diseases, being particularly important for COPD (88.2% of the explained component due to wealth and 9.0% due to education level), arthritis (77.7% of the explained component due to wealth and 20.9% due to education level), and migraine (80.4% of the explained component due to wealth and 17.7% due to education level). However for CHD, while education had a contribution of 54.8%, wealth contributed for 38.1% to the observed inequalities Age, gender, working status and presence of health insurance did not have major impact on inequalities in chronic diseases evaluated. Geographic determinants also made contribution to inequalities; holding everything else constant with urban area as the reference category living in rural area contributed to inequality in occurrence of chronic bronchitis (11.1%), migraine (5.9%) and arthritis (5.5%).
Table 3.
Adjusted odds ratios between chronic diseases, self-assessed health (SAH) and determining factors
| Variables | COPD AOR (95%CI) | Arthritis AOR (95%CI) | Migraine AOR(95% CI) | Chronic Bronchitis AOR(95% CI) | CHD* AOR(95% CI) | SAH AOR (95%CI) |
|---|---|---|---|---|---|---|
| Gender | ||||||
| Male | 1 | 1 | 1 | 1 | 1 | 1 |
| Female | 0.79(0.59-1.08) | 2.15(1.90-2.44) | 1.03(0.87-1.21) | 1.07(0.91-1.26) | 0.94(0.79-1.11) | 1.10(0.93-1.31) |
| Age | ||||||
| 15-24 | 1 | 1 | 1 | 1 | 1 | 1 |
| 25-34 | 1.47(0.80-2.71) | 1.94(1.49-2.53) | 1.67(1.33-2.09) | 1.21(0.90-1.61) | 2.20(1.39-3.49) | 1.61(1.10-2.37) |
| 35-44 | 1.81(0.99-3.29) | 3.50(2.69-4.57) | 1.90(1.51-2.42) | 1.77(1.29-2.41) | 3.23(2.02-5.17) | 2.76(1.86-4.08) |
| 45-54 | 2.86(1.58-5.16) | 6.29(4.81-8.24) | 2.17(1.69-2.78) | 2.04(1.49-2.81) | 6.19(3.87-9.93) | 4.18(2.82-6.19) |
| 55-64 | 3.45(1.88-6.34) | 9.09(6.90-11.98) | 1.74(1.33-2.27) | 2.74(1.98-3.80) | 8.69(2.92-7.64) | 4.96(3.32-7.41) |
| 65-74 | 6.93(3.78-12.70) | 12.34(9.17-16.59) | 1.46(1.06-1.99) | 3.66(2.56-5.25) | 15.79(9.73-25.61) | 5.81(3.83-8.83) |
| ≥75 | 4.91(2.39-10.09) | 12.83(9.17-17.94) | 1.33(0.93-1.91) | 2.60(1.71-3.94) | 12.39(7.33-20.89) | 6.62(4.20-10.45) |
| Wealth quintiles | ||||||
| 5th | 1 | 1 | 1 | 1 | 1 | 1 |
| 4th | 1.47(0.89-2.43) | 1.44(1.21-1.73) | 1.15(0.96-1.38) | 1.27(0.90-1.62) | 1.28(1.01-1.62) | 1.13(0.87-1.48) |
| 3rd | 1.46(1.34-3.68) | 1.39(1.16-1.66) | 1.12(0.94-1.34) | 1.23(0.96-1.57) | 1.16(0.91-1.45) | 1.48(1.16-1.89) |
| 2nd | 2.21(1.34-3.67) | 1.70(1.40-2.06) | 1.46(1.21-1.77) | 1.48(1.13-1.92) | 1.18(0.91-1.54) | 1.80(1.38-2.34) |
| 1st | 2.48(1.51-4.10) | 2.07(1.71-2.50) | 1.71(1.41-2.06) | 2.12(1.62-2.76) | 1.26(0.98-1.62) | 2.85(2.21-3.68) |
| Household size | ||||||
| 5< | 1 | 1 | 1 | 1 | 1 | 1 |
| ≥5 | 1.27(0.97-1.67) | 1.05(0.85-1.01) | 1.03(0.92-1.15) | 0.88(0.78-1.03) | 1.15(0.99-1.34) | 0.96(0.83-1.12) |
| Setting | ||||||
| Urban | 1 | 1 | 1 | 1 | 1 | 1 |
| Rural | 1.12(0.85-1.48) | 0.79(0.71-0.87) | 0.91(0.80-1.02) | 0.83(0.71-0.97) | 1.01(0.87-1.19) | 0.90(0.78-1.04) |
| Education | ||||||
| University | 1 | 1 | 1 | 1 | 1 | 1 |
| Primary+High | 1.07(0.70-1.64) | 1.21(1.03-1.43) | 1.03(0.89-1.19) | 0.91(0.75-1.10) | 1.41(1.12-1.76) | 1.48(1.14-1.90) |
| Less than primary | 1.39(0.83-2.31) | 1.65(1.36-2.01) | 1.44(1.19-1.74) | 0.98(0.76-1.26) | 1.66(1.25-2.18) | 2.70(2.03-3.59) |
| Working | ||||||
| Yes | 1 | 1 | 1 | 1 | 1 | 1 |
| No | 1.29(0.92-1.79) | 1.24(1.12-1.37) | 0.98(0.85-1.12) | 1.18(0.99-1.41) | 1.39(1.15-1.69) | 1.63(1.35-1.98) |
| Health insurance | ||||||
| Yes | 1 | 1 | 1 | 1 | 1 | 1 |
| No | 1.40(0.93-2.12) | 3.14(2.64-3.74) | 1.14(0.97-1.33) | 1.16(0.94-1.44) | 1.02(0.81-1.29) | 0.96 (0.78-1.17) |
| Marital status | ||||||
| Married | 1 | 1 | 1 | 1 | 1 | 1 |
| Divorced | 0.32(0.77-1.36) | 1.05(0.76-1.45) | 1.06(0.73-1.55) | 1.22(0.75-2.01) | 0.80(0.46-1.37) | 1.23(0.80-1.88) |
| Single | 0.32(0.18-0.56) | 0.65(0.56-0.74) | 0.72(0.59-0.89) | 1.16(0.89-1.52) | 0.72(0.49-1.06) | 1.01(0.73-1.41) |
| Widowed | 1.01(0.66-1.55) | 0.89(0.72-1.12) | 0.91(0.72-1.15) | 0.99(0.77-1.30) | 1.17(0.93-1.49) | 1.24(0.99-1.56) |
| Chronic Disease | ||||||
| No | - | - | - | - | - | 1 |
| Yes | - | - | - | - | - | 7.23(5.58-9.35) |
COPD:Chronic Obstructive Pulmonary Disease CHD:Coronary Heart Disease SAH:Self assessed health AOR:Adjusted odds ratios /*CHD includes history of coronary heart disease, heart failure or myocardial infarction
Table 4.
Decomposition results for four selected chronic diseases and self assessed health
| Variables | COPD | Arthritis | Migraine | Chronic Bronchitis | CHD | Self assessed Health | ||||||
|---|---|---|---|---|---|---|---|---|---|---|---|---|
| CCI | % | CCI | % | CCI | % | CCI | % | CCI | % | CCI | % | |
| Gender | ||||||||||||
| Female | 0.002 | -1.1 | -0.006 | 5.3 | -0.009 | 5.9 | -0.001 | 0.6 | 0.001 | -1.0 | 0.000 | 0.2 |
| Age | ||||||||||||
| 25-34 | 0.002 | -1.0 | 0.003 | -2.4 | 0.003 | -2.4 | 0.001 | -0.8 | 0.004 | -6.9 | 0.002 | -0.9 |
| 35-44 | -0.002 | 1.3 | -0.005 | 4.2 | -0.003 | 2.5 | -0.003 | 2.2 | -0.005 | 9.5 | 0.000 | -0.2 |
| 45-54 | 0.013 | -8.3 | 0.024 | -20.4 | 0.010 | -9.2 | 0.010 | -8.4 | 0.028 | -55.2 | 0.011 | -6.0 |
| 55-64 | 0.008 | -4.7 | 0.013 | -11.2 | 0.003 | -2.6 | 0.007 | -5.6 | 0.017 | -32.7 | -0.003 | 1.8 |
| 65-74 | -0.004 | 2.5 | -0.004 | 3.1 | 0.000 | 0.4 | -0.002 | 1.9 | -0.006 | 11.9 | -0.012 | 6.6 |
| ≥75 | -0.014 | 8.9 | -0.019 | 16.0 | -0.002 | 1.5 | -0.008 | 6.3 | -0.027 | 52.9 | -0.019 | 10.0 |
| Household size | ||||||||||||
| ≥5 | -0.013 | 8.1 | -0.003 | 2.5 | -0.002 | 1.7 | 0.009 | -7.1 | 0.009 | -7.1 | 0.000 | -0.1 |
| Marital status | ||||||||||||
| Single | -0.002 | 1.2 | -0.001 | 0.5 | -0.001 | 0.8 | 0.000 | -0.9 | -0.001 | 1.3 | 0.000 | -0.1 |
| Widowed | 0.000 | 0.0 | 0.000 | 0.4 | 0.000 | -0.3 | 0.006 | -2.4 | 0.000 | 0.9 | -0.001 | 0.6 |
| Divorced | -0.001 | 0.5 | 0.000 | 0.2 | 0.000 | -0.1 | 0.000 | -0.9 | 0.000 | 0.4 | 0.000 | 0.0 |
| Working Status | ||||||||||||
| No | -0.006 | 3.5 | 0.000 | -0.2 | 0.001 | -0.6 | -0.005 | 4.1 | -0.007 | 14.4 | -0.007 | 3.6 |
| Geographical Area | ||||||||||||
| Rural | 0.006 | -3.7 | -0.006 | 5.5 | -0.006 | 5.9 | -0.014 | 11.1 | 0.001 | -1.7 | -0.004 | 1.9 |
| Wealth | ||||||||||||
| Quintile 4 | 0.020 | -12.5 | -0.087 | -15.8 | 0.008 | -7.6 | 0.016 | -12.8 | 0.000 | -23.8 | 0.004 | -1.9 |
| Quintile 3 | 0.001 | -0.6 | -0.023 | -0.6 | 0.000 | -0.3 | 0.001 | -0.5 | -0.007 | -0.6 | 0.000 | -0.1 |
| Quintile 2 | -0.040 | 24.6 | 0.001 | 19.5 | -0.019 | 18.0 | -0.022 | 18.2 | -0.025 | 49.4 | -0.015 | 8.1 |
| Quintile 1 | -0.124 | 76.7 | 0.018 | 74.6 | -0.075 | 70.3 | -0.127 | 103.4 | -0.007 | 13.1 | -0.088 | 46.4 |
| Social insurance | ||||||||||||
| Yes | 0.007 | -4.6 | 0.002 | -1.8 | 0.004 | -3.4 | 0.005 | -3.8 | 0.001 | -1.1 | -0.001 | 0.3 |
| Education | ||||||||||||
| Less than primary | -0.013 | 8.0 | -0.020 | 17.2 | -0.017 | 16.1 | 0.001 | -0.9 | 0.021 | 40.3 | -0.030 | 15.7 |
| Primary+High | -0.002 | 1.0 | -0.004 | 3.7 | -0.001 | 0.7 | 0.003 | -2.4 | 0.007 | 14.5 | -0.005 | 2.7 |
| Chronic Disease | ||||||||||||
| Yes | - | - | - | - | - | - | - | - | - | - | -0.021 | 11.2 |
| Total | -0.123 | 100.0 | -0.116 | 100.0 | -0.107 | 100.0 | -0.162 | 100.0 | -0.051 | 100.0 | -0.189 | 100.0 |
| Residual | -0.057 | -0.010 | 0.004 | -0.044 | -0.015 | -0.059 | ||||||
CCI:Contribution to concentration index COPD:Chronic Obstructive Pulmonary Disease CHD:Coronary Heart Disease
Discussion
The results of the current study revealed the extent and determinants of socioeconomic inequalities in self-assessed health and self-reported chronic diseases in Turkey. We also quantified the contributions of specific determinants to observed inequalities in selected self-reported conditions by using decomposition method.
Total CIs’ for poor SAH and majority of chronic diseases were negative, which implies that these conditions were more common among the less wealthy groups. The results also show an increase in poor SAH with older age, and an inverse significant relationship was found with level of education. Individuals who do not work and those with chronic diseases also had significantly worse SAH values where these results are in line with other research findings from Iran and Turkey (6, 21).
In Turkey, majority of the chronic diseases were mostly concentrated among the poor and particularly associated with lower wealth and lower education level according to multivariate analysis findings. Increasing age was also associated with presence of chronic diseases. Among the chronic diseases evaluated, presence of arthritis was associated with female gender where this finding is in accordance with epidemiological study findings (22, 23). Individuals with low education level reported arthritis more and the ones living in rural area significantly reported arthritis less and these findings are consistent with studies conducted at different settings (24). Chronic diseases such as migraine, COPD, and arthritis were significantly reported less by individuals with single marital status compared to ones who were married and similar finding was highlighted by a studies conducted in Ghana and Denmark (25, 26). We found that many chronic diseases were inversely associated with decreasing wealth level and our findings are in accordance with previous reports from a variety of settings such as presence of angina (27, 28), arthritis (29, 30), asthma (31), depression (32), gastritis and migraine (33). However cancer, allergy and diabetes mellitus were slightly more concentrated among the wealthy. A recent study using World Health Survey 2003 data that included information from 41 low-middle income country population reported that; DM was associated with higher wealth levels, but RII value for DM loss its significance after adjusting for other variables such as age, gender, education status and marital status (18). DM is a highly prevalent chronic disease in Turkey and a recent nationwide study named TURDEP reported its prevalence as 13.4% for age over 18 (34). DM prevalence based on Turkish Health Survey (5.9%) is much lower than TURDEP Study findings. It is possible that our findings may be subjected to bias stemming from methodological issues. First of all, prevalences in Health Survey are self-reported so the clinical tests such as oral glucose challenge test was not applied. Second, it is possible that individuals with higher level of education are more aware of their health conditions and have better access to health care services (35). As a result the cases with a lower wealth or education level could more likely to be underdiagnosed and therefore prevalence rates might be underestimated. TURDEP-II study revealed that, 45% of the individuals diagnosed with DM were new cases (34). We believe this limitation might result with underestimation of CI and RII values.
We assessed inequality through decomposition analysis, which takes into account both unequal distribution of the determinant and effect of the determinant on poor SAH and chronic diseases. Decomposition results revealed that household economic status and education level contributed around 71 percent of the total socioeconomic inequalities in having poor SAH. However, gender, marital status, living in a rural area, household size and working status did not have high impact on inequalities in SAH. According to a study on socioeconomic inequalities in SAH in Turkey, the largest contributions to inequality were attributed to education level (70.7%) and household economic status (9.7%) and this finding revealed that education and household wealth were the greatest contributing factors to observed inequalities in poor SAH. However, low income made the largest contribution in Iran (6, 21). Geographically, residing in the rural areas did not have an important contribution to inequalities in reported chronic diseases and self-assessed health however other studies from Turkey and other countries reported that regional area lived might have an impact on these conditions(6, 36, 37). Similarity of urban and rural places in terms of inequalities could be due to the TURKSTAT definition of urban and rural area which is based on population size in a given settlement. Urban area is defined as a population over 20,000. However this definition may not capture differences in socioeconomic social, economic, access to health care or other epidemiologic aspects of health outcomes (38). The differences in contribution levels to inequalities in our study and former surveys could be due to differences in assessment of wealth variable and number of chronic diseases and other variables used in multivariate analysis. Low income level was the major contributor to the observed inequalities in reporting chronic diseases except CHD where education contributed more than other variables. Being in the lowest income quin-tile and having less than primary level education; contributed strongly to inequalities in reported chronic diseases such as CHD, COPD, arthritis and migraine. RII values were statistically significant in majority of the chronic diseases indicating that these diseases were unequally distributed in Turkey to the detriment of those with lower wealth. Even there is an universal coverage for health insurance in Turkey possibility of restricted access to health care due low income and education might also be factors limiting awareness of chronic conditions and this possibility might be evaluated with further studies.
Limitations
There are some limitations to this study. Interpreting causal conclusions requires caution because of its cross-sectional design. Longitudinal data might better explain the changes in socioeconomic status and their impact self-assessed health and chronic diseases. The decomposition approach is deterministic, and only includes measured explanatory variables, so there might be other factors that might have impact on inequalities but could not be assessed here because of the limitation of number of variables in the data set. Another limitation is the data is self-reported which is subject to recall bias. According to literature, individuals with lower socioeconomic status tend to under report symptoms which might resulted with an underestimation of presence of NCDs and poor SAH (39). It was also indicated that using standardized objective diagnostic criteria rather than self-reported assessment of NCDs led to a significant increase in prevalence of NCDs among the poor compared to wealthy (40). These two conditions possibly led to a weaker than actual inverse associations between socioeconomic status and NCD rates. We could not evaluate the geographical differences between western and eastern regions of Turkey in terms of inequalities in SAH and NCDs because the dataset did not involve this parameter. However there are evidence that health disparities exist between east and western part of Turkey (9, 12). The dataset also did not involve information on sampling units such as clusters; as a result we could not perform analysis with multilevel mixed effect models taking both the design effect into account however we used survey weights in every statistical analysis to reduce the impact of non-coverage and non-response. The participation rate based on number of households was (77.6%), which might slightly limit the generalization of our findings. Even, low participation is typical of surveys, participation rate in this study is higher than other epidemiological studies conducted on NCDs in Turkey(9, 41). It was also reported that the magnitude of the nonparticipation bias is not proportional to the percentage of nonparticipants (42) and a study on representativeness observed that people with risky behaviors participated in the same proportions as people without risk factors (43). Lastly, although missing data can bias outcome measures, we estimated the effects of bias to be minimal in the present study because the percentage of subjects with missing values were small and there was no statistically significant difference in the distribution of key parameters such as age, gender, education, income amongst individuals with and without complete information.
Policy implications
Even there have been socioeconomic improvements during last decade in Turkey, inequalities in health still exist across regions and income quin-tiles. For example, according to the 2010 OECD data, the top 20% income quintile of the adult population in Turkey rated their health as ‘good’ or ‘very good’, compared to 59% for the bottom 20% and sub-optimal SAH was 2 times more prevalent in Eastern region compared to Mediterranean region of Turkey (12, 44). Prevalence of NCDs also show wide regional disparities according to a recent survey conducted in Turkey (9). Turkish Ministry of Health (MoH) prepared and started to implement action plans targeting NCDs and its risk factors however these programs mainly involve mass media campaigns for increasing awareness and screening people for certain risk factors during health awareness days(3, 45). Our results indicate that socioeconomic inequalities in SAH and NCDs are mainly determined by factors such as education, household wealth and in geographical area lived in. Hence, in addition to controlling potential risk factors that have a negative impact on health such as obesity, smoking, alcohol, unhealthy nutrition, physical inactivity, the policy makers should also focus on causes of causes that creates socioeconomic inequalities in health. Effective actions to reduce these inequalities include equitable implementation of health programmes and education starting from childhood, secure employment in disadvantaged groups, comprehensive strategies for risk factor controls targeting low socioeconomic status groups (46). Because of possibility for under-diagnosis and under-reporting of NCDs due to limited access to healthcare among the poor, any barrier accessing to these services should be removed and delivery of preventive interventions for early detection and treatment of NCDs starting from primary care should be provided (40).
The present study has shown that NCDs and poor SAH demonstrated unequal distribution across socioeconomic groups. Further studies using longitudinal data can explore the impact of changes in socioeconomic conditions to changes in SAH and NCDs. Instead of using only self-reported diagnosis, surveys with more extensive symptom and medical examinations should be conducted to deal with under diagnosis of morbidities among vulnerable population groups.
Conclusions
The findings indicate that poor SAH and majority of chronic diseases were more concentrated among less wealthy individuals in Turkey. Household wealth and education level had the largest contributions to inequalities in poor SAH and chronic diseases. These inequalities need to be explicitly addressed and vulnerable subgroups should be targeted to reduce these socioeconomic disparities.
Ethical considerations
Ethical issues (Including plagiarism, Informed Consent, misconduct, data fabrication and/or falsification, double publication and/or submission, redundancy, etc.) have been completely observed by the authors.
Acknowledgements
A statement concerning the use of data from Turkish Health Survey 2008 was completed and signed by the author. This paper used data from the Turkish Health Survey, where appropriate. The authors declare that there is no conflict of interests.
References
- Murray CJ, Vos T, Lozano R, et al. (2012). Disability-adjusted life years (DALYs) for 291 diseases and injuries in 21 regions, 1990–2010: a systematic analysis for the Global Burden of Disease Study 2010. Lancet, 380: 2197–2223. [DOI] [PubMed] [Google Scholar]
- WHO (2011). Global status report on noncommunicable diseases 2010. World Health Organization, Geneva. [Google Scholar]
- MoH (2010). Obesity prevention and control program of Turkey (2010–2014). Ministry of Health of Turkey, Ankara. [Google Scholar]
- Jylha M (2009). What is self-rated health and why does it predict mortality? Towards a unified conceptual model. Soc Sci Med, 69: 307–316. [DOI] [PubMed] [Google Scholar]
- Nielsen AB, Siersma V, Hiort LC, Drivsholm T, Kreiner S, Hollnagel H (2008). Self-rated general health among 40-year-old Danes and its association with all-cause mortality at 10-, 20-, and 29 years’ follow-up. Scand J Public Health, 36: 3–11. [DOI] [PubMed] [Google Scholar]
- Sozmen K, Baydur H, Simsek H, Unal B (2012). Decomposing socioeconomic inequalities in self assessed health in Turkey. Int J Equity Health, 11: 73. [DOI] [PMC free article] [PubMed] [Google Scholar]
- Atun R, Aydin S, Chakraborty S, Sumer S, Aran M, Gurol I, Nazlioglu S, Ozgulcu S, Aydogan U, Ayar B, Dilmen U, Akdag R (2013). Universal health coverage in Turkey: enhancement of equity. Lancet, 382: 65–99. [DOI] [PubMed] [Google Scholar]
- Braveman P, Gruskin S (2003). Defining equity in health. J Epidemiol Community Health, 57: 254–258. [DOI] [PMC free article] [PubMed] [Google Scholar]
- MoH (2013). Chronic Diseases and Risk Factors Survey in Turkey. Republic of Turkey Ministry of Health, Ankara [Google Scholar]
- van Doorslaer E, Koolman X (2004). Explaining the differences in income-related health inequalities across European countries. Health Econ, 13: 609–628. [DOI] [PubMed] [Google Scholar]
- Lauridsen J, Christiansen T, Gundgaard J, Hakkinen U, Sintonen H (2007). Decomposition of health inequality by determinants and dimensions. Health Econ, 16: 97–102. [DOI] [PubMed] [Google Scholar]
- Sozmen K, Baydur H, Im Ek H, Unal B (2012). Decomposing socioeconomic inequalities in self assessed health in Turkey. Int J Equity Health, 11: 73. [DOI] [PMC free article] [PubMed] [Google Scholar]
- TURKSTAT (2010). Turkish Health Survey 2008 Report. Ankara. [Google Scholar]
- Demirchyan A, Thompson ME (2008). Determinants of self-rated health in women: a population-based study in Armavir Marz, Armenia, 2001 & 2004. Int J Equity Health, 7: 25. [DOI] [PMC free article] [PubMed] [Google Scholar]
- O OD (2007). Analyzing Health Equity Using Household Survey Data. ed. The World Bank, Washington DC:USA. [Google Scholar]
- Wagstaff A, van Doorslaer E, Paci P (1991). On the measurement of horizontal inequity in the delivery of health care. J Health Econ, 10: 169–205; discussion 247–249, 251–256. [DOI] [PubMed] [Google Scholar]
- Koolman X, van Doorslaer E (2004). On the interpretation of a concentration index of inequality. Health Econ, 13: 649–656. [DOI] [PubMed] [Google Scholar]
- Hosseinpoor AR, Bergen N, Mendis S, Harper S, Verdes E, Kunst A, Chatterji S (2012). Socioeconomic inequality in the prevalence of noncommunicable diseases in low- and middle-income countries: results from the World Health Survey. BMC Public Health, 12: 474. [DOI] [PMC free article] [PubMed] [Google Scholar]
- Sergeant JC, Firth D (2006). Relative index of inequality: definition, estimation, and inference. Biostatistics, 7: 213–224. [DOI] [PubMed] [Google Scholar]
- CB (2014). Central Bank of the Republic of Turkey Currency Exchange Rates. Available from: http://www.tcmb.gov.tr/yeni/kurlar/kurlar_tr.php [Google Scholar]
- Nedjat S, Hosseinpoor AR, Forouzanfar MH, Golestan B, Majdzadeh R (2012). Decomposing socioeconomic inequality in self-rated health in Tehran. J Epidemiol Community Health, 66: 495–500. [DOI] [PubMed] [Google Scholar]
- Kvien TK, Uhlig T, Odegard S, Heiberg MS (2006). Epidemiological aspects of rheumatoid arthritis: the sex ratio. Ann N Y Acad Sci, 1069: 212–222. [DOI] [PubMed] [Google Scholar]
- Sokka T, Toloza S, Cutolo M, et al. (2009). Women, men, and rheumatoid arthritis: analyses of disease activity, disease characteristics, and treatments in the QUEST-RA study. Arthritis Res Ther, 11:R7. [DOI] [PMC free article] [PubMed] [Google Scholar]
- Tobon GJ, Youinou P, Saraux A (2010). The environment, geo-epidemiology, and autoimmune disease: Rheumatoid arthritis. J Autoimmun, 35: 10–14. [DOI] [PubMed] [Google Scholar]
- Nimako BA, Baiden F, Sackey SO, Binka F (2013). Multimorbidity of chronic diseases among adult patients presenting to an inner-city clinic in Ghana. Global Health, 9: 61. [DOI] [PMC free article] [PubMed] [Google Scholar]
- Le H, Tfelt-Hansen P, Skytthe A, Kyvik KO, Olesen J (2011). Association between migraine, lifestyle and socioeconomic factors: a population-based cross-sectional study. J Headache Pain, 12: 157–172. [DOI] [PMC free article] [PubMed] [Google Scholar]
- Liu L, Ma J, Yin X, Kelepouris E, Eisen HJ (2011). Global variability in angina pectoris and its association with body mass index and poverty. Am J Cardiol, 107: 655–661. [DOI] [PubMed] [Google Scholar]
- Rose G, Marmot MG (1981). Social class and coronary heart disease. Br Heart J, 45: 13–19. [DOI] [PMC free article] [PubMed] [Google Scholar]
- Callahan LF, Shreffler J, Mielenz T, Schoster B, Kaufman JS, Xiao C, Randolph R, Sloane PD (2008). Arthritis in the family practice setting: associations with education and community poverty. Arthritis Rheum, 59: 1002–1008. [DOI] [PubMed] [Google Scholar]
- Canizares M, Power JD, Perruccio AV, Badley EM (2008). Association of regional racial/cultural context and socioeconomic status with arthritis in the population: a multilevel analysis. Arthritis Rheum, 59: 399–407. [DOI] [PubMed] [Google Scholar]
- Li X, Sundquist J, Sundquist K (2008). Socioeconomic and occupational groups and risk of asthma in Sweden. Occup Med (Lond), 58: 161–168. [DOI] [PubMed] [Google Scholar]
- Yunming L, Changsheng C, Haibo T, Wenjun C, Shanhong F, Yan M, Yongyong X, Qianzhen H (2012). Prevalence and risk factors for depression in older people in Xi'an China: a community-based study. Int J Geriatr Psychiatry, 27: 31–39. [DOI] [PubMed] [Google Scholar]
- Stewart WF, Roy J, Lipton RB (2013). Migraine prevalence, socioeconomic status, and social causation. Neurology, 81: 948–955. [DOI] [PMC free article] [PubMed] [Google Scholar]
- Satman I, Omer B, Tutuncu Y, Kalaca S, Gedik S, Dinccag N, Karsidag K, Genc S, Telci A, Canbaz B, Turker F, Yilmaz T, Cakir B, Tuomilehto J, Group T-IS (2013). Twelve-year trends in the prevalence and risk factors of diabetes and prediabetes in Turkish adults. Eur J Epidemiol, 28: 169–180. [DOI] [PMC free article] [PubMed] [Google Scholar]
- Seubsman SA, Kelly MJ, Yiengprugsawan V, Sleigh AC, Thai Cohort Study T (2011). Gender, socioeconomic status, and self-rated health in a transitional middle-income setting: evidence from Thailand. Asia Pac J Public Health, 23: 754–765. [DOI] [PMC free article] [PubMed] [Google Scholar]
- Yiengprugsawan V, Lim LL, Carmichael GA, Sidorenko A, Sleigh AC (2007). Measuring and decomposing inequity in self-reported morbidity and self-assessed health in Thailand. Int J Equity Health, 6: 23. [DOI] [PMC free article] [PubMed] [Google Scholar]
- Yiengprugsawan V, Lim LL, Carmichael GA, Seubsman SA, Sleigh AC (2009). Tracking and decomposing health and disease inequality in Thailand. Ann Epidemiol, 19: 800–807. [DOI] [PMC free article] [PubMed] [Google Scholar]
- Avci S (2004). Şehirsel Yerleşmelerin Belirlen-mesinde Kullanılan Kriterler ve Türkiye Örneği (The criterion of defining urban settlement and Turkey as an example). İstanbul Üniversitesi Edebiyat Fakültesi Sosyoloji Dergisi, 9: 9–28. [Google Scholar]
- Delpierre C, Lauwers-Cances V, Datta GD, Lang T, Berkman L (2009). Using self-rated health for analysing social inequalities in health: a risk for underestimating the gap between socioeconomic groups? J Epidemiol Community Health, 63: 426–432. [DOI] [PubMed] [Google Scholar]
- Vellakkal S, Subramanian SV, Millett C, Basu S, Stuckler D, Ebrahim S (2013). Socioeconomic inequalities in non-communicable diseases prevalence in India: disparities between self-reported diagnoses and standardized measures. PLoS One, 8:e68219. [DOI] [PMC free article] [PubMed] [Google Scholar]
- Ergor G, Soysal A, Sozmen K, et al. (2012). Balcova heart study: rationale and methodology of the Turkish cohort. Int J Public Health, 57: 535–542. [DOI] [PubMed] [Google Scholar]
- Galea S, Tracy M (2007). Participation rates in epidemiologic studies. Ann Epidemiol, 17: 643–653. [DOI] [PubMed] [Google Scholar]
- Taylor A, Grande E, Gill T, Chittleborough C, Wilson D, Adams R, Grant J, Phillips P, Ruffin R, Team tNWAHS (2006). Do people with risky behaviours participate in biomedical cohort studies? BMC Public Health, 6: 11. [DOI] [PMC free article] [PubMed] [Google Scholar]
- OECD(2014). Better Life Index for Turkey. Available from: http://www.oecdbetterlif-eindex.org/countries/turkey/ [Google Scholar]
- MoH (2011). Türkiye Diyabeti Önleme ve Kontrol Programı. Eylem Planı 2011–2014. Sağlık Bakanlığı, Ankara [Google Scholar]
- Di Cesare M, Khang YH, Asaria P, Blakely T, et al. (2013). Inequalities in non-communicable diseases and effective responses. Lancet, 381: 585–597. [DOI] [PubMed] [Google Scholar]