

Metastatic disease remains the primary cause of death for breast cancer patients. The different steps of the metastatic cascade rely on reciprocal interactions between cancer cells and their microenvironment. Within this local microenvironment and in distant organs, immune cells and their mediators are known to facilitate metastasis formation1,2. However, the precise contribution of tumor-induced systemic inflammation to metastasis and the mechanisms regulating systemic inflammation are poorly understood. Here, we show that tumors maximize their chance to metastasize by evoking a systemic inflammatory cascade in mouse models of spontaneous breast cancer metastasis. We mechanistically demonstrate that IL1β elicits IL17 expression from γδ T cells, resulting in systemic, G-CSF-dependent expansion and polarization of neutrophils in mammary tumor-bearing mice. Tumor-induced neutrophils acquired the ability to suppress cytotoxic CD8+ T lymphocytes, which limit the establishment of metastases. Neutralization of IL17 or G-CSF and absence of γδ T cells prevented neutrophil accumulation and down-regulated the T cell-suppressive phenotype of neutrophils. Moreover, the absence of γδ T cells or neutrophils profoundly reduced pulmonary and lymph node metastases without influencing primary tumor progression. Our data indicate that targeting this novel cancer cell-initiated domino effect within the immune system – the γδ T cell-IL17-neutrophil axis – represents a new strategy to inhibit metastatic disease.
In breast cancer patients, increased neutrophil abundance predicts worsened metastasis-specific survival3,4. Currently, the role of neutrophils in metastasis is controversial, since both pro- and anti-metastatic functions have been described5-7. We found a profound systemic expansion of neutrophils in mammary tumor-bearing K14cre;Cdh1F/F;Trp53F/F (KEP) mice8, as compared to wild-type (WT) littermates (Extended Data Fig. 1a, b). Neutrophils, defined as CD45+CD11b+Ly6G+Ly6C+F4/80− cells, accumulated throughout every organ examined (Extended Data Fig. 1c, d). We also investigated our recently described KEP-based model of spontaneous breast cancer metastasis9 (Fig. 1a), where systemic neutrophil expansion was observed as well (Fig. 1b and Extended Data Fig. 1e, f). Neutrophil expansion was tumor-induced, because surgical removal of the primary tumor resulted in their immediate reduction (Extended Data Fig. 1g).
Figure 1. Neutrophils promote breast cancer metastasis.

a, Spontaneous metastasis model. Tumor fragments from KEP mice are orthotopically transplanted into WT recipient mice (designated by #1), allowed to proliferate (#2), then surgically resected (#3)9. Metastases develop in 100% of recipient mice. Antibody-mediated depletion experiments were performed in three ways: from palpable tumors to metastasis-related sacrifice (continuous treatment), during primary tumor growth (early phase), or after surgery until metastasis-related sacrifice (late phase). b, Neutrophil proportions in lungs at the indicated tumor size (n = 6, 5, 6 and 8 mice for 0, 9, 25 and 100 mm2, respectively; Kruskal-Wallis test followed by Dunn’s post test). c, d, Images of cytokeratin 8-stained lung sections, quantification of lung metastases and incidence of metastasis in lymph nodes. Neutrophils were depleted continuously until metastasis-related sacrifice in c (n = 11 mice/group; Mann-Whitney U test and Fisher’s exact test) or depleted during the early or late phases in d (n = 9 control, 11 early phase, 14 late phase; Kruskal-Wallis test followed by Dunn’s post test and Fisher’s exact test). Data in d are representative of two independent experiments. All data are mean + s.e.m. *p<0.05, **p<0.01, ***p<0.001. Scale bars = 6 mm.
To determine the functional significance of neutrophils in metastasis, neutrophils were depleted using anti-Ly6G antibodies (Extended Data Fig. 2a-c). Treatment was initiated when tumors were palpable and continued until mice developed overt metastatic disease. Neutrophil depletion did not influence tumor growth (Extended Data Fig. 2d), tumor histopathology (Extended Data Fig. 2e) or microvessel density (Extended Data Fig. 2e, f). By contrast, neutrophil depletion resulted in significant reduction in both pulmonary and lymph node metastasis (Fig. 1c). These data indicate that neutrophils assist the spread of cancer cells to multiple locations.
Next, we evaluated the role of neutrophils in different phases of the metastatic cascade. Neutrophils were depleted during primary tumor growth (early phase) or after removal of the primary tumor (late phase) (Fig. 1a). Interestingly, neutrophil depletion decreased multi-organ metastasis in the early phase, but not the late phase (Fig. 1d). Metastatic nodule size was not affected (Extended Data Fig. 2g), suggesting that neutrophils facilitate multi-organ metastasis during the early steps of the metastatic cascade.
To understand the mechanism by which neutrophils facilitate metastasis, their phenotype was investigated. Previous reports identified the hematopoietic stem cell marker, cKIT, on pro-metastatic myeloid cells6,10-12, and CD11b+VEGFR1+ cells have been implicated in the pre-metastatic niche10,13,14. A greater proportion of neutrophils from tumor-bearing KEP mice expressed cKIT, while both neutrophils and monocytes from WT and KEP mice expressed VEGFR1 (Extended Data Fig. 3a, b). In the metastasis model, cKIT+ neutrophils also expanded systemically, as tumors grew larger (Extended Data Fig. 3c) and reduced to baseline levels after tumor resection (Extended Data Fig. 3d). Nuclear morphological analysis revealed characteristics of immature cells15, including banded, circular and non-segmented nuclei, whereas most WT neutrophils appeared hyper-segmented (Extended Data Fig. 3e), suggesting that KEP mammary tumors promote the release of immature neutrophils into circulation.
Next generation sequencing (RNA-seq) was performed on circulating neutrophils from WT and tumor-bearing KEP mice, revealing 100 differentially expressed genes (Extended Data Fig. 4a and Extended Data Table 1). Several genes upregulated in neutrophils from KEP mice, including Prok2/Bv8, S100a8 and S100a9 (Fig. 2a), have previously been linked to metastasis6,14. Nos2, the gene encoding inducible nitric oxide synthase (iNOS), was the most strongly upregulated gene by more than 150-fold (Fig. 2a). Because iNOS suppresses T cells16-18, we hypothesized that neutrophils promote metastasis via immunosuppression. Indeed, neutrophils from KEP mice inhibited the CD3/CD28-induced proliferation of naïve splenic CD8+ T cells ex vivo when compared with WT neutrophils, and an iNOS inhibitor reversed this effect (Fig. 2b and Extended Data Fig. 4b). In lungs of control and neutrophil-depleted tumor-bearing mice, the proportions of CD8+ T cells did not differ (Extended Data Fig. 4c). However, the effector phenotype of CD8+ T cells was markedly enhanced upon neutrophil depletion, as evidenced by a significantly greater proportion of CD62L−CD44+ and IFNγ+ cells (Fig. 2c and Extended Data Fig. 4d, e). To further establish a mechanistic link between neutrophils and CD8+ T cell activity, we depleted both cell populations in the metastasis model. Combined depletion of neutrophils and CD8+ T cells reversed the metastasis phenotype of neutrophil depletion alone (Fig. 2d), without affecting primary tumor growth (Extended Data Fig. 4f). Depletion of CD8+ T cells alone did not alter tumor growth or multi-organ metastasis (data not shown). These data suggest that neutrophils facilitate cancer cell spread by suppressing CD8+ T cells. As such, neutrophils in the KEP model can be categorized as a subpopulation of myeloid-derived suppressor cells (MDSCs)15.
Figure 2. Neutrophils suppress CD8+ T cell activation to facilitate metastasis.
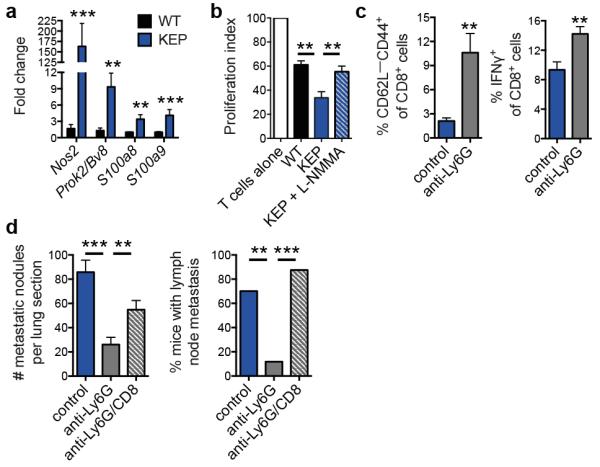
a, Gene expression in circulating neutrophils (n = 5 WT, 10 KEP mice). b, Circulating neutrophils from either WT (n = 7) or tumor-bearing KEP mice (n = 8) were incubated with CFSE-labeled splenic CD8+ T cells from WT mice and CD3/CD28 stimulation beads. The iNOS inhibitor, L-NMMA, was added where indicated (n = 8). After 48 hours, CD8+ T cell proliferation was measured. c, CD8+ T cell activation status in lungs of transplanted tumor-bearing control and neutrophil-depleted mice (n = 6/group). d, Quantification of lung metastases and incidence of lymph node metastasis following neutrophil and CD8+ T cell depletion (n = 11 control, 16 anti-Ly6G, 8 anti-Ly6G/CD8; Kruskal-Wallis test followed by Dunn’s post test and Fisher’s exact test). All data are mean + s.e.m. *p<0.05, **p<0.01, ***p<0.001.
We then asked how mammary tumors induce systemic neutrophil expansion. Cytokine profile comparison of WT mammary glands and KEP mammary tumors showed that GM-CSF and G-CSF levels – two key regulators of neutrophil biology19 – were not significantly increased in KEP tumors (Extended Data Fig. 5a, b). However, expression of IL1β, IL6, and IL12p40, a subunit of IL23, was increased (Extended Data Fig. 5a, b). These cytokines are known to stimulate IL17 from lymphocytes20-23. In inflammatory diseases such as psoriasis, lymphocyte-derived IL17 regulates neutrophil expansion via systemic induction of G-CSF21,22,24. We hypothesized that the same inflammatory cascade is important in breast cancer metastasis. Indeed, serum levels of IL17A and G-CSF were higher in tumor-bearing KEP mice than in WT mice (Fig. 3a). Neutralization of IL17A in tumor-bearing KEP mice decreased G-CSF serum levels, while G-CSF blockade did not affect IL17A levels (Fig. 3a), indicating that IL17 is upstream of G-CSF. Inhibition of either cytokine reduced circulating neutrophils, lowered cKIT+ neutrophil proportions (Fig. 3b) and reversed neutrophil phenotype (Fig. 3c). Injection of recombinant G-CSF to anti-IL17-treated tumor-bearing KEP mice overcame the effects of anti-IL17 treatment (Extended Data Fig. 5c-e). Additionally, treatment of WT mice with recombinant G-CSF resulted in neutrophil expansion, increased presence of cKIT+ neutrophil proportions, and changed neutrophil phenotype (Extended Data Fig. 5c-e). These data demonstrate a requirement for the IL17-G-CSF signaling cascade in both neutrophil expansion and phenotype.
Figure 3. Lymphocyte-derived IL17 is required for G-CSF-induced neutrophil expansion and phenotype.

a, Cytokine levels in serum of WT (n = 5), tumor-bearing KEP mice (n = 9), and anti-IL17- (n = 7) or anti-G-CSF-treated KEP mice (n = 6). b, Proportions of circulating neutrophils and cKIT-expressing neutrophils in KEP mice during primary tumor growth (n = 9 control, 8 anti-IL17, 6 anti-G-CSF). c, Gene expression in circulating neutrophils from tumor-bearing KEP control mice (n = 9), anti-IL17- (n = 6) or anti-G-CSF-treated KEP mice (n = 6). d, Cytokine levels in serum of tumor-bearing KEP;Rag1+/− (n = 9) and KEP;Rag1−/− mice (n = 7). e, Absolute blood neutrophil counts in tumor-bearing KEP;Rag1+/− mice (n = 8) or KEP;Rag1−/− mice (n = 5). f, Gene expression in circulating neutrophils from KEP;Rag1+/− (n = 10) and KEP;Rag1−/− mice (n = 8). g, Percentage of tumor-bearing mice with lung or lymph node metastasis (n = 50 KEP;Rag1+/−, 32 KEP;Rag1−/− mice). All data are mean + s.e.m. *p<0.05, **p<0.01, ***p<0.001 as determined by Mann-Whitney U test or Fisher’s exact test.
Next, we determined the source of IL17. As T cells are known to produce IL1720,21,23, splenic CD3+ T cells were analyzed using a T cell-specific gene expression array. This analysis validated upregulation of IL17-related cytokines in T cells from tumor-bearing KEP mice (Extended Data Fig. 5f). We then asked whether lymphocytes are the only source of IL17 and whether they drive metastasis. KEP mice were crossed with Rag1−/− mice, which lack T and B cells. Tumor initiation, proliferation and histology were the same between KEP;Rag1+/− and KEP;Rag1−/− mice (Extended Data Fig. 6a and data not shown). However, KEP;Rag1−/− mice exhibited lower levels of IL17A and G-CSF in serum (Fig. 3d), decreased neutrophil counts (Fig. 3e) and altered neutrophil phenotype (Fig. 3f). TGFβ1 levels were unchanged between KEP;Rag1+/− and KEP;Rag1−/− mice (Extended Data Fig. 6b), suggesting that unlike other models25, TGFβ plays a lesser role in modulating neutrophil phenotype than IL17-induced G-CSF. Importantly, KEP;Rag1−/− mice displayed less pulmonary and lymph node metastases (Fig. 3g). The metastasis phenotype in KEP;Rag1−/− mice was validated in the metastasis model where Rag1−/− mice were recipients of transplanted KEP tumor fragments, resulting in reduced pulmonary metastasis (Extended Data Fig. 6c). Thus, IL17-producing lymphocytes drive neutrophil accumulation, phenotype and metastasis.
Direct ex vivo intracellular cytokine staining was performed to determine which T lymphocyte subset produces IL17. Both CD4+ T cells and γδ T cells expressed IL17A (Fig. 4a), and both IL17-producing subpopulations were increased in various organs of tumor-bearing KEP mice when compared to WT mice (Fig. 4b and Extended Data Fig. 7a). In primary tumors, the abundance of γδ and CD4+ T cells was too low (<0.2% and <2% of all live cells, respectively) to reliably assess IL17 expression. γδ T cells exhibited higher IL17A levels than CD4+ T cells (Fig. 4a and Extended Data Fig. 7b). Both cell populations were depleted to determine their functional importance. CD4+ T cell depletion lowered cKIT+ neutrophils, but failed to significantly influence total neutrophil expansion, IL17A or G-CSF levels (Extended Data Fig. 7c-e). Conversely, depletion of γδ T cells decreased IL17A and G-CSF serum levels (Fig. 4c), reduced circulating neutrophils, lowered cKIT+ neutrophil proportions (Fig. 4d and Extended Data Fig. 7c) and reversed neutrophil phenotype (Fig. 4e). These data indicate that IL17-producing γδ T cells promote neutrophil expansion and phenotypic alterations. IL17-producing γδ T cells in tumor-bearing KEP mice were CD27−, mostly Vγ4+, and a proportion expressed CCR6, IL1R1 and RORγt (Extended Data Fig. 8a, b) similar to other inflammatory diseases21.
Figure 4. IL1β-activated, IL17-producing γδ T cells regulate neutrophil expansion, neutrophil phenotype and metastasis.

a, Intracellular staining within circulating T cells of tumor-bearing KEP mice. b, Proportion of IL17A-producing γδ T cells (WT, n = 5; KEP, n = 6). c, Cytokine levels in serum of control (n = 10) and anti-γδTCR-treated (n = 7) KEP mice. d, Proportions of circulating neutrophils and cKIT-expressing neutrophils in KEP mice during primary tumor growth (n = 8/group). e, Gene expression in circulating neutrophils from tumor-bearing KEP control mice (n = 10) and anti-γδTCR-treated KEP mice (n = 6). f, Proportion of IL17A-producing γδ T cells in tumor-bearing mice (n = 6 KEP control, 5 anti-IL23p19, 5 anti-IL1β). g, Cytokine levels in serum (n = 9 KEP control, 5 anti-IL23p19, 6 anti-IL1β). h, Proportions of circulating neutrophils and cKIT-expressing neutrophils in KEP mice during primary tumor growth (n = 9 control, 5 anti-IL23p19, 5 anti-IL1β). i, j, Quantification of lung metastases and incidence of lymph node metastasis in the metastasis model (n = 10 control, 9 anti-γδTCR-treated mice; n = 9/group Tcrδ+/− and Tcrδ−/− mice,). All data are mean + s.e.m. *p<0.05, **p<0.01, ***p<0.001 as determined by Mann-Whitney U test or Fisher’s exact test.
We then asked how KEP mammary tumors activate IL17-producing γδ T cells. Based on literature20-23 and cytokine analysis (Extended Data Fig. 5a, b), we focused on IL23 and IL1β. IL17A expression by γδ T cells, G-CSF serum levels and neutrophil expansion was decreased by neutralization of IL1β, but unaffected by inhibition of IL23 (Fig. 4f-h). Macrophages were the most abundant IL1β-expressing cell type in KEP tumors (Extended Data Fig. 8c, d). These data provide a mechanistic link between mammary tumors and γδ T cells.
Depletion of γδ T cells in the early phase of the metastasis model did not affect tumor histopathology, microvessel density, or primary tumor growth (Extended Data Fig. 8e and data not shown). Importantly, however, pulmonary and lymph node metastasis were significantly decreased in γδ T cell-depleted mice (Fig. 4i). These data were validated with Tcrδ−/− mice, which lack γδ T cells. KEP tumor fragments were orthotopically transplanted into Tcrδ+/− and Tcrδ−/− mice and resected following outgrowth. Genetic elimination of γδ T cells also resulted in a significant reduction in pulmonary metastasis (Fig. 4j) without affecting primary tumor growth (Extended Data Fig. 8f). These data confirmed a pro-metastatic role for γδ T cells.
In summary, we show that mammary tumor-induced, IL17-producing γδ T cells drive systemic expansion and polarization of neutrophils towards a CD8+ T cell-suppressive phenotype and subsequent metastasis formation in distant organs (Extended Data Fig. 9). The importance of neutrophils during the early steps of the metastatic cascade and the upregulation of Bv8/Prok2, S100a8 and S100a9 in neutrophils suggest that neutrophils may help to establish the pre-metastatic niche6,10,14; although, the role of these neutrophil-derived factors and others remains to be established in the KEP model. In breast cancer patients, independent clinical studies consistently point towards a pro-metastatic role for neutrophils, γδ T cells and IL173,4,26-29. Here, we establish a mechanistic connection between these independent clinical observations. In infection and inflammatory disorders, the γδ T cell-IL17-neutrophil axis drives disease pathogenesis21,23,30. We now demonstrate that this targetable pathway also perpetuates breast cancer metastasis.
METHODS
Mice
The generation and characterization of K14cre;CdhF/F;Trp53F/F (KEP) mice – a conditional model of invasive lobular breast cancer – has been described8. KEP mice were back-crossed onto the FVB/N background. KEP mice were crossed with Rag1−/− mice (FVB/N; a gift from L. Coussens)32 to generate KEP;Rag1+/− and KEP;Rag1−/− mice33. The onset of mammary tumor formation was monitored twice weekly by palpation and caliper measurements starting at four months of age. Tcrδ−/− mice on the FVB/N background were a gift from A. Hayday34. The spontaneous metastasis model has also been described9. Briefly, this model is based on the orthotopic transplantation of KEP tumor pieces into 10-12 week old female recipient FVB/N mice, Rag1−/− mice, Tcrδ+/− or Tcrδ−/− mice. These tumor pieces are allowed to grow out, then surgically removed at 100 mm2, after which 100% of mice develop overt metastatic disease.
To deplete immune cells or neutralize cytokines, mice were injected i.p. with an initial 400 μg followed by 100 μg thrice weekly for anti-Ly6G (clone 1A8; BioXCell), 200 μg twice weekly for anti-CD8 (clone 2.43; BioXCell), or 100 μg twice weekly for anti-γδTCR (clone GL3; purified by the NKI protein facility). For cytokine neutralization experiments, KEP mice were injected i.p. with 50 μg twice weekly for anti-IL17A (clone 17F3; BioXCell), 50 μg thrice weekly for anti-G-CSF (clone 67604; R&D Systems), 50 μg twice weekly anti-IL23p19 (clone G23-8; eBioscience), or 50 μg twice weekly anti-IL1β (clone B122; BioXCell). Control mice received equal amounts of isotope control antibodies or equal volumes of PBS. Where indicated, WT and KEP mice were injected i.p. with 5 μg rG-CSF (Peprotech) for 4 consecutive days and were sacrificed on the 5th day. Tumor-bearing KEP mice injected with rG-CSF received anti-IL17 at the same schedule as above. Antibody injections began when K14cre;CdhF/F;Trp53F/F mammary tumors reached 25 mm2 until sacrifice at 225 mm2, or transplanted tumors reached 9 mm2 where indicated until surgery at 100 mm2. Three independent K14cre;CdhF/F;Trp53F/F donor tumors were tested in neutrophil depletion experiments resulting in the same outcome. One of these donor tumors was used throughout the remainder of the study. Blood samples were taken before and during antibody injections for flow cytometry analyses. Animals were randomized before beginning the treatment schedule. Mice were kept in individually ventilated and open cages and food and water were provided ad libitum. Animal experiments were approved by the Animal Ethics Committee of the Netherlands Cancer Institute and performed in accordance with institutional, national and European guidelines for Animal Care and Use.
Immunohistochemistry
Formalin-fixed tissues were processed by routine procedures. H&E staining was performed as described9. Citrate antigen retrieval was used for all staining procedures. Neutrophils were detected using either anti-Ly6B (clone 7/4; Cedarlane) or anti-Ly6G (clone 1A8; BD Biosciences), when primary tumors reached 100 mm2. Quantitative analysis of neutrophil abundance was performed by counting cells in 5 high-power (40×) fields of view (FOV) per tissue. Metastases were detected using anti-cytokeratin 8 (clone Troma 1; DHSB University of Iowa). In the metastasis model, the total number of cytokeratin 8+ nodules was scored in one lung section of each animal. The size of each nodule was measured using ImageJ, then represented as arbitrary units. Lymph node metastases were scored as positive or negative based on the presence of cytokeratin 8+ metastases. Mice that developed overt metastatic disease (i.e. respiratory distress or 225 mm2 axillary lymph node metastasis) were included in the analysis; mice that were sacrificed as a result of local recurrence were excluded. Vimentin, E-cadherin and CD34 staining was performed as previously described9 and scored independently by two blinded researchers. Microvessel density was scored by averaging the total number of blood vessels from 5 fields of view for each tumor section. For metastasis quantification in K14cre;CdhF/F;Trp53F/F;Rag1+/− and K14cre;CdhF/F;Trp53F/F;Rag1−/− mice, single lung or lymph node sections were scored as positive or negative based on the presence of cytokeratin 8+ metastases. Stained slides were digitally processed using the Aperio ScanScope and captured using ImageScope software version 11.0.2. Brightness and contrast for representative images were adjusted equally among groups.
Flow cytometry and intracellular staining
Tissues were collected in ice-cold PBS. Blood samples were collected in tubes containing heparin. Tumors and lungs were mechanically chopped using a McIlwain tissue chopper (Mickle Laboratory Engineering Co.). Tumors were digested for 1 hour at 37 °C in 3 mg/mL collagenase type A (Roche) and 25 μg/mL DNAse (Sigma) in serum-free DMEM medium. Lungs were digested for 30 minutes at 37 °C in 100 μg/mL Liberase TM (Roche). Enzyme activity was neutralized by addition of cold DMEM/8% FCS and suspension was dispersed through a 70 μm cell strainer. Spleen, lymph nodes and liver were mashed through a 70 μm cell strainer. All single cell suspensions were treated with NH4Cl erythrocyte lysis buffer. Cells were stained with directly conjugated antibodies (listed below) for 30 minutes at 4 °C in the dark in PBS/1% BSA. 7AAD (1:20; eBioscience) or Fixable Viability Dye eFluor® 780 (1:1000; eBioscience) was added to exclude dead cells. For intracellular staining, single cell suspensions were stimulated in IMDM containing 8% FCS, 100 IU/mL penicillin, 100 μg/mL streptomycin, 0.5% β-mercaptoethanol, 50 ng/mL PMA, 1 μM ionomycin and (1:1000) Golgi-Plug™ (BD Biosciences) for 3 hours at 37 °C. Surface antigens were stained first, followed by fixation and permeabilization using the Cytofix/Cytoperm™ kit (BD Biosciences) and followed by staining of intracellular proteins. All experiments were performed using a BD LSRII flow cytometer using Diva software. Data analyses were performed using FlowJo Software version 9.7.1. Median fluorescence intensity (MFI) of IL17A expression was calculated after gating on IL17+ cells within individual T cell subsets.
All antibodies were purchased from eBioscience, except Ly6G-AlexaFluor 700, CCR6 and Vγ1 from BioLegend, and VEGFR1, CCR2, IL23R and IL1R1 from R&D Systems. The following antibodies were used in these experiments: Myeloid panel – CD45-eFluor 605NC (1:50; clone 30-F11), CD11b-eFluor 650NC (1:400; clone M1/70), Ly6G-AlexaFluor 700 (1:400; clone 1A8), Ly6C-eFluor 450 (1:400; clone HK1.4), F4/80-APC-eFluor 780 (1:200; clone BM8), VEGFR1-APC (1:50; clone 141522), cKIT (1:400; clone 2B8), CCR2-PE (1:50; clone 475301), CXCR4-PerCP-eFluor 710 (1:400; clone 2B11), CD49d-FITC (1:400; clone R1-2) or Gr1-FITC (1:400; clone RB6-8C5), 7AAD.
Lymphoid panel I – CD45-eFluor 605NC (1:50; clone 30-F11), CD11b-eFluor 650NC (1:400; clone M1/70), CD3-PE-Cy7 (1:200; clone 145-2C11), CD4-APC-eFluor 780 (1:200; clone GK1.5), CD8-PerCP-eFluor 710 (1:400; clone 53-6.7), γδTCR-FITC (1:400; clone GL3), CD49b-APC (1:400; clone DX5), IL17A-PE (1:200; clone eBio17B7), IFNγ-eFluor 450 (1:200; clone XMG1.2), 7AAD.
Lymphoid panel II – CD45-eFluor 605NC (1:50; clone 30-F11), CD11b-APC-eFluor 780 (1:200; clone M1/70), CD3-PE-Cy7 (1:200; clone 145-2C11), CD4-APC-eFluor 780 (1:200; clone GK1.5), CD8-PerCP-eFluor 710 (1:400; clone 53-6.7), γδTCR-PE (1:400; clone GL3), CD49b-APC (1:400; clone DX5), CD62L-AlexaFluor 700 (1:400; clone MEL-14), CD44-FITC (1:400; clone IM7), IFNγ-eFluor 450 (1:200; clone XMG1.2), CD19-APC-eFluor 780 (1:200; clone eBio1D3), Fixable Viability Dye eFluor® 780.
γδ T cell phenotyping panel I – CD45-eFluor 605NC (1:50; clone 30-F11), CD11b-APC-eFluor 780 (1:200; clone M1/70), CD3-PerCP-eFluor 710 (1:200; clone 145-2C11), CD4-APC-eFluor 780 (1:200; clone GK1.5), γδTCR-PE (1:400; clone GL3), CD19-APC-eFluor 780 (1:200; clone eBio1D3), CD27-PE-Cy7 (1:200; clone LG.7F9), IL1R1-FITC (1:25; clone 129304), CCR6-Brillant Violet 421 (1:200: clone 29-2L17), IL23R-AlexaFluor 700 (1:25; clone 753317), RORγt-APC (1:100; clone B2D), Fixable Viability Dye eFluor® 780.
γδ T cell phenotyping panel II – CD45-eFluor 605NC (1:50; clone 30-F11), CD11b-APC-eFluor 780 (1:200; clone M1/70), CD4-APC-eFluor 780 (1:200; clone GK1.5), γδTCR-PE (1:400; clone GL3), CD19-APC-eFluor 780 (1:200; clone eBio1D3), CD27-PE-Cy7 (1:200; clone LG.7F9), Vγ1-FITC (1:100; clone 2.11), Vγ4-PerCP-eFluor 710 (1:100; clone UC3-10A6), IFNγ-eFluor 450 (1:200; clone XMG1.2), IL17A-APC (1:200; clone eBio17B7), Fixable Viability Dye eFluor® 780.
White blood cell counts
Total white blood cell numbers were measured on a hematology analyzer (Becton Dickinson). Neutrophil numbers were then calculated based on the percentage of CD11b+Ly6G+Ly6C+ cells.
Giemsa Staining
Blood was collected by tail vein puncture in heparin-coated tubes. Red blood cells were lysed with NH4Cl lysis buffer. White blood cells were smeared onto glass slides then stained with decreasing concentrations of Wright-Giemsa solution.
RNA-Seq and gene ontology analysis
Ly6G+ neutrophils were isolated by magnetic column (Miltenyi) from blood of mice. KEP mice with mammary tumors around 225 mm2 in size and age-matched WT mice were used. Purity of isolated neutrophils was validated by flow cytometry and only samples greater than 90% purity were used. RNA was isolated using Trizol and then treated with DNase I (Invitrogen). Samples were put over a Qiagen RNeasy column for cleanup. RNA quality was confirmed with a 2100 Bioanalyzer from Agilent. RNA-Seq libraries were prepared using the reagents provided in the Illumina TruSeq™ RNA Sample Preparation Kit, following the manufacturer’s protocol. Libraries were PCR amplified for 12 cycles and sequenced on an Illumina HiSeq 2000 System with TruSeq reagent kits and software, generating 51bp reads. Sequence reads were aligned to the mouse reference genome (NCBI build 37) using TopHat. HTSeq-count was then used to generate a list of the total number of uniquely mapped reads for each gene and sample. Sequence reads were normalized to 10 million reads per sample and log2 transformed with the formula, log2(((expression gene × ÷ library size)106)+1), where the library size was the sum of all expression values per sample. In order to determine which genes were differentially expressed between samples, the R package Limma was used. Absolute gene expressions were used as input and genes with no expression in any sample were removed from the dataset. Voom was used to transform the count data to log2 counts per million and estimation of the variance. The p value was set to a cut-off of 0.05 resulting in 100 significant, differentially expressed genes. Unsupervised clustering was performed on these 100 genes and the data were transformed into a heat-map.
Real-time PCR
Neutrophil RNA was extracted as above then converted to cDNA with an AMV reverse transcriptase using Oligo(dT) primers (Invitrogen). cDNA (20 ng/well) was analyzed by SYBR green real-time PCR with 500 nM primers using a LightCycler® 480 thermocycler (Roche). β-actin was used as a reference gene. The following primer sequences were used for each gene: Nos2 forward 5′-GTTCTCAGCCCAACAATACAAGA-3′, reverse 5′-GTGGACGGGTCGATGTCAC-3′; Prok2/Bv8 forward 5′- CTTCGCCCTTCTTCTTTCCT-3′, reverse 5′- GCATGTGCTGTGCTGTCAGT-3′; S100a8 forward 5′-TGAGCAACCTCATTGATGTCTACC-3′, reverse 5′-ATGCCACACCCACTTTTATCACC-3′; S100a9 forward 5′- GAAGAAAGAGAAGAGAAATGAAGCC-3′; reverse 5′- CTTTGCCATCAGCATCATACACTCC-3′; Il1β forward 5′- CAACCAACAAGTGATATTCTCCATG-3′, reverse 5′-GATCCACACTCTCCAGCTGCA -3′; β-actin forward 5′-CCTCATGAAGATCCTGACCGA-3′, reverse 5′- TTTGATGTCACGCACGATTTC-3′. Fold change was calculated using the formula .
T cell proliferation assay
Blood neutrophils from WT mice and splenic CD8+ T cells from WT mice were isolated by magnetic column (Miltenyi). Blood neutrophils from KEP mice with mammary tumors around 225 mm2 in size were also used. CD8+ T cells were labeled with Cell Trace CFSE following the manufacturer’s instructions (Invitrogen). Equal numbers of cells (2×10⁵) were co-cultured in a 96-well flat bottom plate. CD3/CD28 Dynabeads (Invitrogen) were added according to manufacturer’s instruction, and the iNOS inhibitor, L-NMMA (Sigma), was added at 0.5 mM where indicated. After 48 hours, T cell proliferation was evaluated on a BD LSRII flow cytometer using Diva software using the following antibodies: CD8a-PE (1:600; clone 53-6.7), CD11b-APC (1:400; clone M1/70), Ly6C-eFluor 450 (1:400; clone HK1.4), Ly6G-AlexaFluor 700 (1:400; clone 1A8) and 7AAD viability marker. Data analyses were performed using FlowJo Software version 9.7.1. Proliferation index was calculated using the formula, (% of proliferated, co-cultured CD8+ T cells) ÷ (% of proliferated CD8+ T cells without co-culture) × 100, for each replicate experiment.
Cytokine analysis
Multiplex quantification of cytokines and chemokines in mammary glands and tumors was performed using the premixed 24-plex Bio-Plex Pro Mouse Cytokine Assay (Bio-Rad) according to manufacturer’s recommendations. Proteins lysates were prepared as previously described31. Unsupervised clustering was performed on normalized, median centered data then converted to a heat-map using Genesis software. For IL17A and G-CSF serum levels, BD Cytometric Bead Arrays were used as directed and analyzed on a Cyan flow cytometer with Summit software (Beckman Coulter). Data analyses were performed using FlowJo Software version 9.7.1. For TGFβ1, a DuoSet ELISA kit was purchased from R&D Systems and performed according to the manufacturer’s instructions.
PCR array
The spleens of three wild-type or K14cre;CdhF/F;Trp53F/F mammary tumor-bearing mice were pooled and labeled with anti-CD3 antibodies. CD3+ T cells were sorted using a BD FACSAria II. RNA was isolated with Trizol as above. Gene expression differences were analyzed using a mouse T cell-specific PCR array from Qiagen according to their instructions and software. Genes exhibiting a three-fold change were considered biologically relevant.
Statistical analysis
Data analyses were performed using GraphPad Prism version 7. Applied analyses are indicated in corresponding legends. Sample sizes were based on previous experience with the models9,31,33. Differences with a p < 0.05 were considered statistically significant.
Extended Data
Extended Data Figure 1. Systemic neutrophil expansion and accumulation in mammary tumor-bearing K14cre;Cdh1F/F;Trp53F/F (KEP) mice and the metastasis model.

a, Representative images of neutrophils identified by the 7/4 antibody in lung sections in wild-type (WT) or KEP mice. Scale bar = 50 μm. b, Quantification of neutrophil accumulation per field of view (FOV) in various organs by immunohistochemistry using the 7/4 antibody (n = 6 WT, 9 KEP mice). c, Absolute neutrophil counts in blood of WT and tumor-bearing KEP mice (n = 4 WT, 8 KEP). d, Quantification of neutrophil accumulation in various organs determined by flow cytometry and gated on CD45+ cells. Neutrophils were not detectable in WT mammary glands (n = 5 WT, 7 KEP mice). e, Representative images of Ly6G-stained lung sections and quantification of neutrophil accumulation in the metastasis model. Data were generated from mock-transplanted, non-tumor-bearing mice (0 mm2), or tumor-transplanted recipient mice sacrificed when tumors reached the tumor size shown or when mice exhibited signs of respiratory distress due to pulmonary metastasis. For quantification in lungs with metastases, neutrophils residing inside metastases were excluded. T = pulmonary metastatic lesion. Scale bar = 100 μm (n = 3, 5, 6, 6 and 3 mice for 0, 9, 25, 100 mm2 and metastasis respectively). f, Kinetics of neutrophil accumulation in various organs of the metastasis model by flow cytometry after gating on CD45+ cells. Recipient mice transplanted with KEP tumor pieces were sacrificed at the tumor size shown (n = 6, 5, 6, and 7 mice for 0, 9, 25, 100 mm2 respectively). g, Kinetics of neutrophil proportions in blood (gated on CD45+ cells), before and after surgical removal of their primary tumor (n = 5). All data are mean + s.e.m. *p<0.05, **p<0.01, ***p<0.001 as determined by Mann-Whitney U test or Kruskal-Wallis test followed by Dunn’s post test.
Extended Data Figure 2. Neutrophil depletion does not affect primary tumor or metastatic nodule growth.

a, Schematic illustration of the neutrophil depletion experiment in the spontaneous metastasis model. b, Representative dot plots of neutrophils gated on CD45+ cells in blood of control and anti-Ly6G-treated recipient mice. The Gr1 antibody was used here to avoid false negative results since the anti-Ly6G depleting antibody may mask the Ly6G epitope. CD11b+Gr1high cells were Ly6C+CCR2−, indicating that these cells were neutrophils. CD11b+Gr1low cells that were Ly6C+ and CCR2+ represented the monocytic fraction. c, Quantification of neutrophil depletion in blood of control and anti-Ly6G-treated recipient mice at the tumor size indicated (n = 8 control, 5 anti-Ly6G; **p<0.01 as determined by Mann-Whitney U test). d, Primary tumor growth kinetics of mice treated as indicated (n = 12 control, 14 anti-Ly6G). e, Representative images of primary tumors in the metastasis model treated as shown and stained with H&E, cytokeratin 8, vimentin, E-cadherin and CD34. Scale bar = 100 μm. f, Quantification of blood vessels per field of view (FOV) in control and neutrophil-depleted mice by anti-CD34 immunohistochemistry (n = 10). g, Quantification of pulmonary metastatic nodule size in control and neutrophil-depleted mice (n = 9 control, 11 early phase, 14 late phase mice). All data are mean + s.e.m.
Extended Data Figure 3. Subpopulations of neutrophils in mammary tumor-bearing mice are immature.

a, Gating strategy for identification of neutrophils (CD45+CD11b+Ly6G+Ly6C+F4/80− cells), cKIT+ neutrophils and monocytes (CD45+CD11b+Ly6G−Ly6C+F4/80− cells) by flow cytometry. Blood cells from WT and tumor-bearing KEP mice are shown here. b, Quantification of cKIT+ neutrophil accumulation in various organs determined by flow cytometry after gating on CD45+CD11b+Ly6G+Ly6C+F4/80− cells. cKIT+ neutrophils were not detectable in WT mammary glands (n = 5 WT, 7 KEP; Mann-Whitney U test). c, cKIT+ neutrophil proportions in various organs of the metastasis model as determined by flow cytometry after gating on CD45+CD11b+Ly6G+Ly6C+F4/80− cells. Mice were sacrificed at the tumor size shown (n = 5, 5, 5, and 8 mice for 0, 9, 25, 100 mm2 respectively; Kruskal–Wallis test followed by Dunn’s post test). d, Kinetics of cKIT+ neutrophil proportions in blood (gated on CD45+CD11b+Ly6G+Ly6C+F4/80− cells), before and after surgical removal of their primary tumor (n = 5/group; Mann-Whitney U test). e, Representative images and quantification of neutrophil nuclear morphology. Ly6G+ cells were isolated from blood of WT and tumor-bearing KEP mice then assessed by Giemsa stain. Hyper-segmented cells were considered mature, whereas all other cells were considered immature. Scale bar = 10 μm. (n = 6 WT, 5 KEP mice; Mann-Whitney U test). All data are mean + s.e.m. *p<0.05, **p<0.01, ***p<0.001.
Extended Data Figure 4. Neutrophils influence the function and phenotype of CD8+ T cells.

a, Unsupervised hierarchical clustering of RNA-Seq analysis depicting 100 differentially expressed genes between circulating neutrophils from WT and tumor-bearing KEP mice. P value (0.05) was used as cutoff (n = 4 WT, 5 KEP mice). See also Extended Data Table 1 for top 50 genes ranked by fold change. b, Circulating neutrophils from either WT or tumor-bearing KEP mice were incubated with CFSE-labeled splenic CD8+ T cells from WT mice and CD3/CD28 stimulation beads. The iNOS inhibitor, L-NMMA, was added where indicated. After 48 hours, CD8+ T cell proliferation was measured by flow cytometry. c, Dot plots depicting live cell-gated CD8+ T cell proportions in lungs of mice in control and neutrophil-depleted mice, sacrificed when transplanted tumors reached 100 mm2. d, Dot plots of effector CD8+ T cell (CD62L−CD44+) proportions in lungs of transplanted mammary tumor-bearing mice that were sacrificed when tumors reached 100 mm2. e, IFNγ expression by CD8+ T cells in lungs of transplanted mammary tumor-bearing mice that were sacrificed when tumors reached 100 mm2. f, Tumor growth kinetics in neutrophil-depleted or combined neutrophil- and CD8+ T cell-depleted, mammary tumor-transplanted recipient mice, as compared with control (n = 13 control, 21 anti-Ly6G, 14 anti-Ly6G/CD8). Data are mean + s.e.m.
Extended Data Figure 5. Cytokine expression levels in tumors and T cells, and their effects on neutrophils.

a, Unsupervised clustering of cytokine expression analysis in WT mammary glands and KEP tumors. Protein lysates were prepared as previously described from whole tissue31 and analyzed for expression of various cytokines by Luminex-based assay (n = 5/group). b, Protein levels of indicated cytokines in WT mammary glands and KEP tumors, determined by Luminex-based cytokine profiling. n.d. = not detectable (n = 10/group; Mann-Whitney U test). c, d, Quantification of neutrophil and cKIT-expressing neutrophil accumulation in blood as determined by flow cytometry and gated on CD45+ cells. WT (n = 4) or tumor-bearing KEP mice (n = 9) were treated with anti-IL17 (n = 8) and/or recombinant G-CSF (rG-CSF; n = 4) where indicated (Mann-Whitney U test or Kruskal–Wallis test followed by Dunn’s post test). e, Gene expression in circulating neutrophils from WT control (n = 5), rG-CSF-treated WT mice (n = 4), KEP control (n = 10), anti-IL17-treated (n = 6), anti-IL17 + rG-CSF-treated KEP mice (n = 4; Mann-Whitney U test or Kruskal-Wallis test followed by Dunn’s post test). f, Spleens of three WT mice and three KEP mice were pooled and CD3+ T cells were isolated. These cells were analyzed by a real-time PCR array containing 86 different genes. Gene expression changes of greater than three-fold are shown. Members of the IL17 signaling pathway are depicted in blue. *p<0.05, **p<0.01, ***p<0.001. All data are mean + s.e.m.
Extended Data Figure 6. Absence of the adaptive immune system reduces metastasis.

a, Graphic representation of mammary tumor latency (left panel) and tumor growth (right panel) in lymphocyte-proficient KEP;Rag1+/− and lymphocyte-deficient KEP;Rag1−/− mice (n = 30/group). b, Levels of TGFβ1 in mammary tumors and the plasma of tumor-bearing mice (n = 6 tumor, 3 plasma). c, Quantification of metastatic burden in lungs of recipient WT or Rag1−/− mice that were transplanted with KEP mammary tumor fragments and underwent surgical removal of the primary tumor (n = 6 WT, 4 Rag1−/− mice; **p<0.01, Mann-Whitney U test). Data are mean + s.e.m.
Extended Data Figure 7. Depletion of CD4+ T cells does not affect systemic cytokine levels or neutrophil expansion.

a, The proportion of IL17A+ cells among CD4+ T cells in organs of wild-type (WT) and tumor-bearing K14cre;Cdh1F/F;Trp53F/F (KEP) mice (n = 6/group; Mann-Whitney U test). b, Median fluorescence intensity (MFI) of IL17A expression in circulating γδ and CD4+ T cells from tumor-bearing KEP mice, as determined by flow cytometry (n = 11/group; Wilcoxon matched-pairs test). c, Representative dot plots depicting total neutrophil and cKIT+ proportions in blood of control, anti-CD4- and anti-γδTCR-treated tumor-bearing KEP mice. d, Quantification of total neutrophil and cKIT+ neutrophil proportions in blood of control and anti-CD4-treated tumor-bearing KEP mice (n = 7/group; Mann-Whitney U test). e, Serum levels of IL17A and G-CSF in control and anti-CD4-treated tumor-bearing KEP mice (n = 10 control, 6 anti-CD4; Mann-Whitney U test). *p<0.05, **p<0.01. All data are mean + s.e.m.
Extended Data Figure 8. γδ T cell phenotype in KEP mice and their lack of influence on tumor growth in the metastasis model.

a, γδ T cells from lungs of tumor-bearing KEP mice were analyzed by flow cytometry for IL17, CD27, Vγ1, and Vγ4 expression. Two major populations of γδ T cells were observed including IL17+CD27− and IL17−CD27+ cells. b, Representative histograms of CCR6, IL1R1, IL23R and RORγt expression in IL17+CD27− and IL17−CD27+ γδ T cell populations shown in a. c, Il1β gene expression in various cell populations isolated from transplanted KEP tumors. Tumors from three mice were pooled to form one group. CD45− cells (which includes cancer cells, endothelial cells and fibroblasts), CD45+CD11b+F4/80+ macrophages, CD45+CD11b+Ly6G+ neutrophils and CD45+CD11b− lymphocytes were sorted from two pooled groups. Real time-PCR was performed on individual cell populations for Il1β expression. Relative expression among different cells is shown. d, Graphic representation of immune cell proportions in KEP tumors (n = 4). e, Primary tumor growth kinetics of control and γδ T cell-depleted tumor transplant recipient mice (n = 13/group). f, Growth kinetics of primary tumors transplanted into Tcrδ+/− (n = 10) and Tcrδ−/− mice (n = 6). All data are mean + s.e.m.
Extended Data Figure 9. The γδ T cell-IL17-neutrophil axis promotes metastatic breast cancer.

Mammary tumors evoke a systemic inflammatory cascade that is initiated by IL1β production. Tumor-derived IL1β activates γδ T cells to produce IL17. Increased systemic IL17 levels lead to upregulation of G-CSF, which subsequently causes neutrophil expansion and alteration of neutrophil phenotype. These phenotypically altered neutrophils produce iNOS that suppresses the activity of anti-tumor CD8+ T cells. As a result of this systemic inflammatory cascade, the chance that disseminated cancer cells can establish metastases in distant organs is maximized.
Extended Data Table 1. The top 50 most differentially expressed genes between neutrophils from WT and KEP mice.
| Gene ID | Gene name | Ensembl gene ID | fold change | p value |
|---|---|---|---|---|
| Nos2 | nitric oxide synthase 2, inducible | ENSMUSG00000020826 | 31.5 | 0.345 |
| Car4 | carbonic anhydrase 4 | ENSMUSG00000000805 | 25.5 | 0.111 |
| Lipq | lipase, endothelial | ENSMUSG00000053846 | 24.6 | 0.128 |
| Gm11430 | predicted gene 11430 | ENSMUSG00000080927 | 16.7 | 0.292 |
| Gm6551 | predicted gene 6551 | ENSMUSG00000078100 | 14.2 | 0.039 |
| Stfa3 | stefin A3 | ENSMUSG00000054905 | 14.1 | 0.047 |
| Pvrl2 | poliovirus receptor-related 2 | ENSMUSG00000062300 | 13.8 | 0.143 |
| Gm16748 | predicted gene, 16748 | ENSMUSG00000085308 | 13.5 | 0.087 |
| Prok2 | prokineticin 2 | ENSMUSG00000030069 | 12.3 | 0.024 |
| Esm1 | endothelial cell-specific molecule 1 | ENSMUSG00000042379 | 12.1 | 0.010 |
| Ano2 | anoctamin 2 | ENSMUSG00000038115 | 10.6 | 0.138 |
| Saa1 | serum amyloid A 1 | ENSMUSG00000074115 | 10.1 | 0.192 |
| Nov | nephroblastoma overexpressed gene | ENSMUSG00000037362 | 9.6 | 0.295 |
| Gpr15 | G protein-coupled receptor 15 | ENSMUSG00000047293 | 9.5 | 0.204 |
| Ggt1 | gamma-glutamyltransferase 1 | ENSMUSG00000006345 | 9.3 | 0.076 |
| Cish | cytokine inducible SH2-containing protein | ENSMUSG00000032578 | 9.1 | 0.217 |
| Stfa2 | stefin A2 | ENSMUSG00000022902 | 8.9 | 0.020 |
| Gm14028 | predicted gene 14028 | ENSMUSG00000082339 | 8.4 | 0.036 |
| Stfa1 | stefin A1 | ENSMUSG00000071562 | 7.5 | 0.087 |
| Cfhr1 | complement factor H-related 1 | ENSMUSG00000057037 | 7.1 | 0.029 |
| Ms4a3 | membrane-spanning 4-domains, subfamily A, member 3 | ENSMUSG00000024681 | 6.8 | 0.177 |
| Kit | kit oncogene | ENSMUSG00000005672 | 6.8 | 0.085 |
| Jph3 | junctophilin 3 | ENSMUSG00000025318 | 6.8 | 0.076 |
| Cnnm2 | cyclin M2 | ENSMUSG00000064105 | 6.6 | 0.128 |
| Gnb5 | guanine nucleotide binding protein (G protein), beta 5 | ENSMUSG00000032192 | 6.4 | 0.004 |
| Alox12 | arachidonate 12-lipoxygenase | ENSMUSG00000000320 | −11.2 | 0.103 |
| Slfn14-ps | schlafen family member 14, pseudogene | ENSMUSG00000082101 | −11.2 | 0.049 |
| Gm6634 | predicted gene 6634 | ENSMUSG00000086538 | −11.3 | 0.139 |
| Syt13 | synaptotagmin XIII | ENSMUSG00000027220 | −11.4 | 0.213 |
| Tsc22d1 | TSC22 domain family, member 1 | ENSMUSG00000022010 | −11.4 | 0.107 |
| Gm10419 | predicted gene 10419 | ENSMUSG00000072769 | −11.5 | 0.231 |
| Sh3bgrl2 | SH3 domain binding glutamic acid-rich protein like 2 | ENSMUSG00000032261 | −11.6 | 0.117 |
| Fhl1 | four and a half LIM domains 1 | ENSMUSG00000023092 | −11.9 | 0.131 |
| Trpc6 | transient receptor potential cation channel, subfamily C, member 6 | ENSMUSG00000031997 | −11.9 | 0.076 |
| Ctla2a | cytotoxic T lymphocyte-associated protein 2 alpha | ENSMUSG00000044258 | −12.0 | 0.107 |
| Csgalnact1 | chondroitin sulfate N-acetylgalactosaminyltransferase 1 | ENSMUSG00000036356 | −12.2 | 0.156 |
| Gng11 | guanine nucleotide binding protein (G protein), gamma 11 | ENSMUSG00000032766 | −12.2 | 0.123 |
| 2610l09H07Rik | RIKEN cDNA 2610109H07 gene | ENSMUSG00000029005 | −12.3 | 0.195 |
| Nrgn | neurogranin | ENSMUSG00000053310 | −12.5 | 0.087 |
| Gm11274 | predicted gene 11274 | ENSMUSG00000085331 | −12.6 | 0.101 |
| Peg10 | paternally expressed 10 | ENSMUSG00000092035 | −13.1 | 0.177 |
| Angpt1 | angiopoietin 1 | ENSMUSG00000022309 | −13.6 | 0.168 |
| Plp1 | proteolipid protein (myelin) 1 | ENSMUSG00000031425 | −13.6 | 0.132 |
| Dlg2 | discs, large homolog 2 (Drosophila) | ENSMUSG00000052572 | −14.6 | 0.080 |
| Sytl4 | synaptotagmin-like 4 | ENSMUSG00000031255 | −14.6 | 0.138 |
| Mol | myeloproliferative leukemia virus oncogene | ENSMUSG00000006389 | −15.6 | 0.197 |
| Mras | muscle and microspikes RAS | ENSMUSG00000032470 | −15.7 | 0.053 |
| Gp6 | glycoprotein 6 (platelet) | ENSMUSG00000078810 | −15.9 | 0.215 |
| Cd226 | CD226 antigen | ENSMUSG00000034028 | −18.4 | 0.134 |
| Bean1 | brain expressed, associated with Nedd4,1 | ENSMUSG00000031872 | −19.2 | 0.053 |
ACKNOWLEDGEMENTS
This work was supported by a Marie Curie Intra-European Fellowship to S.B.C. (BMDCMET 275610); an European Research Council Consolidator award (INFLAMET 615300) to K.E.dV; grants from the Dutch Cancer Society to K.E.dV and J.J. (2011-5004); Worldwide Cancer Research (AICR 11-0677) to K.E.dV; the Netherlands Organization for Scientific Research NWO VIDI (917.96.307) to K.E.dV; and a Dutch Cancer Society/Bas Mulder Award to L.J.A.C.H. (UL2011-5051). We thank J. Borst, T. Schumacher and J. Coquet for discussions. We thank the core facilities at the Netherlands Cancer Institute. We thank L. Coussens for Rag1−/− mice and A. Hayday for Tcrδ−/− mice. We thank C. Ries and K. Wartha for technical assistance.
Footnotes
AUTHOR INFORMATION
RNA-seq data are deposited in the Gene Expression Omnibus (GEO) under the accession number GSE55633.
The authors declare no competing financial interests.
REFERENCES
- 1.Quail DF, Joyce JA. Microenvironmental regulation of tumor progression and metastasis. Nat Med. 2013;19:1423–1437. doi: 10.1038/nm.3394. [DOI] [PMC free article] [PubMed] [Google Scholar]
- 2.McAllister SS, Weinberg RA. The tumour-induced systemic environment as a critical regulator of cancer progression and metastasis. Nat Cell Biol. 2014;16:717–727. doi: 10.1038/ncb3015. [DOI] [PMC free article] [PubMed] [Google Scholar]
- 3.Noh H, Eomm M, Han A. Usefulness of pretreatment neutrophil to lymphocyte ratio in predicting disease-specific survival in breast cancer patients. J Breast Cancer. 2013;16:55–59. doi: 10.4048/jbc.2013.16.1.55. [DOI] [PMC free article] [PubMed] [Google Scholar]
- 4.Azab B, et al. Usefulness of the neutrophil-to-lymphocyte ratio in predicting short- and long-term mortality in breast cancer patients. Ann Surg Oncol. 2012;19:217–224. doi: 10.1245/s10434-011-1814-0. [DOI] [PubMed] [Google Scholar]
- 5.Granot Z, et al. Tumor entrained neutrophils inhibit seeding in the premetastatic lung. Cancer Cell. 2011;20:300–314. doi: 10.1016/j.ccr.2011.08.012. [DOI] [PMC free article] [PubMed] [Google Scholar]
- 6.Kowanetz M, et al. Granulocyte-colony stimulating factor promotes lung metastasis through mobilization of Ly6G+Ly6C+ granulocytes. Proc Natl Acad Sci U S A. 2010;107:21248–21255. doi: 10.1073/pnas.1015855107. [DOI] [PMC free article] [PubMed] [Google Scholar]
- 7.Bald T, et al. Ultraviolet-radiation-induced inflammation promotes angiotropism and metastasis in melanoma. Nature. 2014;507:109–113. doi: 10.1038/nature13111. [DOI] [PubMed] [Google Scholar]
- 8.Derksen PW, et al. Somatic inactivation of E-cadherin and p53 in mice leads to metastatic lobular mammary carcinoma through induction of anoikis resistance and angiogenesis. Cancer Cell. 2006;10:437–449. doi: 10.1016/j.ccr.2006.09.013. [DOI] [PubMed] [Google Scholar]
- 9.Doornebal CW, et al. A preclinical mouse model of invasive lobular breast cancer metastasis. Cancer Res. 2013;73:353–363. doi: 10.1158/0008-5472.CAN-11-4208. [DOI] [PubMed] [Google Scholar]
- 10.Kaplan RN, et al. VEGFR1-positive haematopoietic bone marrow progenitors initiate the pre-metastatic niche. Nature. 2005;438:820–827. doi: 10.1038/nature04186. [DOI] [PMC free article] [PubMed] [Google Scholar]
- 11.Erler JT, et al. Hypoxia-induced lysyl oxidase is a critical mediator of bone marrow cell recruitment to form the premetastatic niche. Cancer Cell. 2009;15:35–44. doi: 10.1016/j.ccr.2008.11.012. [DOI] [PMC free article] [PubMed] [Google Scholar]
- 12.Kuonen F, et al. Inhibition of the Kit Ligand/c-Kit Axis Attenuates Metastasis in a Mouse Model Mimicking Local Breast Cancer Relapse after Radiotherapy. Clin Cancer Res. 2012;18:4365–4374. doi: 10.1158/1078-0432.CCR-11-3028. [DOI] [PubMed] [Google Scholar]
- 13.Hiratsuka S, et al. MMP9 induction by vascular endothelial growth factor receptor-1 is involved in lung-specific metastasis. Cancer Cell. 2002;2:289–300. doi: 10.1016/s1535-6108(02)00153-8. [DOI] [PubMed] [Google Scholar]
- 14.Hiratsuka S, Watanabe A, Aburatani H, Maru Y. Tumour-mediated upregulation of chemoattractants and recruitment of myeloid cells predetermines lung metastasis. Nat Cell Biol. 2006;8:1369–1375. doi: 10.1038/ncb1507. [DOI] [PubMed] [Google Scholar]
- 15.Pillay J, Tak T, Kamp VM, Koenderman L. Immune suppression by neutrophils and granulocytic myeloid-derived suppressor cells: similarities and differences. Cell Mol Life Sci. 2013;70:3813–3827. doi: 10.1007/s00018-013-1286-4. [DOI] [PMC free article] [PubMed] [Google Scholar]
- 16.Mazzoni A, et al. Myeloid suppressor lines inhibit T cell responses by an NO-dependent mechanism. J Immunol. 2002;168:689–695. doi: 10.4049/jimmunol.168.2.689. [DOI] [PubMed] [Google Scholar]
- 17.Young MR, Wright MA, Matthews JP, Malik I, Prechel M. Suppression of T cell proliferation by tumor-induced granulocyte-macrophage progenitor cells producing transforming growth factor-beta and nitric oxide. J Immunol. 1996;156:1916–1922. [PubMed] [Google Scholar]
- 18.Lejeune P, et al. Nitric oxide involvement in tumor-induced immunosuppression. J Immunol. 1994;152:5077–5083. [PubMed] [Google Scholar]
- 19.Hamilton JA, Achuthan A. Colony stimulating factors and myeloid cell biology in health and disease. Trends Immunol. 2013;34:81–89. doi: 10.1016/j.it.2012.08.006. [DOI] [PubMed] [Google Scholar]
- 20.Chung Y, et al. Critical regulation of early Th17 cell differentiation by interleukin-1 signaling. Immunity. 2009;30:576–587. doi: 10.1016/j.immuni.2009.02.007. [DOI] [PMC free article] [PubMed] [Google Scholar]
- 21.Cai Y, et al. Pivotal role of dermal IL-17-producing gammadelta T cells in skin inflammation. Immunity. 2011;35:596–610. doi: 10.1016/j.immuni.2011.08.001. [DOI] [PMC free article] [PubMed] [Google Scholar]
- 22.Mei J, et al. Cxcr2 and Cxcl5 regulate the IL-17/G-CSF axis and neutrophil homeostasis in mice. J Clin Invest. 2012;122:974–986. doi: 10.1172/JCI60588. [DOI] [PMC free article] [PubMed] [Google Scholar]
- 23.Sutton CE, et al. Interleukin-1 and IL-23 induce innate IL-17 production from gammadelta T cells, amplifying Th17 responses and autoimmunity. Immunity. 2009;31:331–341. doi: 10.1016/j.immuni.2009.08.001. [DOI] [PubMed] [Google Scholar]
- 24.Schwarzenberger P, et al. Requirement of endogenous stem cell factor and granulocyte-colony-stimulating factor for IL-17-mediated granulopoiesis. J Immunol. 2000;164:4783–4789. doi: 10.4049/jimmunol.164.9.4783. [DOI] [PubMed] [Google Scholar]
- 25.Fridlender ZG, et al. Polarization of tumor-associated neutrophil phenotype by TGF-beta: “N1” versus “N2” TAN. Cancer Cell. 2009;16:183–194. doi: 10.1016/j.ccr.2009.06.017. [DOI] [PMC free article] [PubMed] [Google Scholar]
- 26.Han Y, et al. Prognostic value of chemotherapy-induced neutropenia in early-stage breast cancer. Breast Cancer Res Treat. 2012;131:483–490. doi: 10.1007/s10549-011-1799-1. [DOI] [PubMed] [Google Scholar]
- 27.Ma C, et al. Tumor-infiltrating gammadelta T lymphocytes predict clinical outcome in human breast cancer. J Immunol. 2012;189:5029–5036. doi: 10.4049/jimmunol.1201892. [DOI] [PMC free article] [PubMed] [Google Scholar]
- 28.Novitskiy SV, et al. TGF-beta receptor II loss promotes mammary carcinoma progression by Th17 dependent mechanisms. Cancer Discov. 2011;1:430–441. doi: 10.1158/2159-8290.CD-11-0100. [DOI] [PMC free article] [PubMed] [Google Scholar]
- 29.Chen WC, et al. Interleukin-17-producing cell infiltration in the breast cancer tumour microenvironment is a poor prognostic factor. Histopathology. 2013;63:225–233. doi: 10.1111/his.12156. [DOI] [PubMed] [Google Scholar]
- 30.Sutherland TE, et al. Chitinase-like proteins promote IL-17-mediated neutrophilia in a tradeoff between nematode killing and host damage. Nat Immunol. 2014;15:1116–1125. doi: 10.1038/ni.3023. [DOI] [PMC free article] [PubMed] [Google Scholar]
ADDITIONAL REFERENCES
- 31.Ciampricotti M, et al. Development of metastatic HER2(+) breast cancer is independent of the adaptive immune system. J Pathol. 2011;224:56–66. doi: 10.1002/path.2837. [DOI] [PubMed] [Google Scholar]
- 32.de Visser KE, Korets LV, Coussens LM. De novo carcinogenesis promoted by chronic inflammation is B lymphocyte dependent. Cancer Cell. 2005;7:411–423. doi: 10.1016/j.ccr.2005.04.014. [DOI] [PubMed] [Google Scholar]
- 33.Ciampricotti M, Hau CS, Doornebal CW, Jonkers J, de Visser KE. Chemotherapy response of spontaneous mammary tumors is independent of the adaptive immune system. Nat Med. 2012;18:344–346. doi: 10.1038/nm.2652. author reply 346. [DOI] [PubMed] [Google Scholar]
- 34.Girardi M, et al. Regulation of cutaneous malignancy by gammadelta T cells. Science. 2001;294:605–609. [PubMed] [Google Scholar]