Abstract
Ophiostoma piceae CECT 20416 is a dimorphic wood-staining fungus able to produce an extracellular sterol-esterase/lipase (OPE) that is of great biotechnological interest. In this work, we have studied the morphological change of this fungus from yeast to hyphae, which is associated with the cell density-related mechanism known as quorum sensing (QS), and how this affects the secretion of OPE. The data presented here confirm that the molecule E,E-farnesol accumulates as the cell number is growing within the population. The exogenous addition of this molecule or spent medium to the cultures increased the extracellular activity of OPE 2.5 times. This fact was related not to an increase in microbial biomass or in the expression of the gene coding for OPE but to a marked morphological transition in the cultures. Moreover, the morphological transition also occurred when a high cell density was inoculated into the medium. The results suggest that E,E-farnesol regulates through QS mechanisms the morphological transition in the dimorphic fungus O. piceae and that it is associated with a higher extracellular esterase activity. Furthermore, identification and transcriptional analysis of genes tup1 and cyr1, which are involved in the response, was carried out. Here we report enhanced production of a sterol-esterase/lipase of biotechnological interest by means of QS mechanisms. These results may be useful in increasing the production of secreted enzymes of other dimorphic fungi of biotechnological interest.
INTRODUCTION
Triacylglycerol esterases, also known as lipases, have acylglycerols as their natural substrates, while sterol esterases hydrolyze fatty acid esters of sterols. In addition, both kinds of enzymes are able to carry out synthesis reactions in the presence of organic solvents (1, 2). They are widespread in nature, but those from microorganisms, especially fungi, have gained special interest due to their broad substrate specificity and their potential application for biotechnological applications (2).
Ophiostoma piceae is a wood-staining fungus and is a causal agent of pine and spruce discoloration. Although it is not a pathogenic species and associates with nonaggressive bark beetles, the infection results in substantial economic losses in the forestry industry (3). Its ability to produce a morphological transition from yeast to hyphal forms, depending on fungal culture conditions, probably contributes to its adaptation to different environmental conditions (3). The effect of inoculum size on culture morphology of fungi from the genera Ophiostoma has been recently reported, suggesting that yeast- or hypha-like growth could be associated with quorum-sensing (QS) activity (4).
The fungus O. piceae CECT 20416 produces an extracellular sterol esterase (OPE) with activity on triglycerides, esters of p-nitrophenol, and cholesterol (5). This is the only esterase secreted by this strain, and it represents a major protein in the crude enzyme obtained using a basal medium supplemented with olive oil. The enzyme is a glycosylated protein, with 8% N-linked carbohydrate and a molecular mass of around 56.5 kDa (5, 6). Some applications have already been reported for this enzyme, either in hydrolysis reactions for pitch biocontrol in paper pulp manufacturing (5) or in the synthesis of sterol esters used as nutraceuticals (1).
QS processes allow the communication of individual cells within a microbial population and contribute in coordinating the behavior and physiology of the community. These mechanisms are mediated by small diffusible molecules that accumulate as the cell number is growing within the population. When the QS molecule reaches a threshold concentration, microbes sense the extracellular signal, and the genes controlled by these mechanisms regulate their expression (7, 8). This phenomenon was first studied in bacteria (9, 10) and much later reported in fungi, particularly in the pathogenic yeast Candida albicans (11, 12), where the sesquiterpene alcohol farnesol (1-hydroxy-3,7,11-trimethyl-2,6,10-dodecatriene) was described as the first QS molecule in eukaryotic organisms (11). However, over the years, other molecules, such as aromatic alcohols, tyrosol, dodecanol, γ-butyrolactone, or γ-heptalactone, have been identified as mediators of QS processes in these organisms (13–19).
In C. albicans, farnesol prevents the differentiation from yeast to hyphal growth, which is crucial to its pathogenicity (12, 20). These morphological changes are regulated at different levels, connecting diverse signal transduction pathways dependent on external stimuli. The morphological transition can be regulated through the conserved Ras and the adenylate cyclase (Cyr1) pathways (21). Recently, it has been shown that the protein kinase A (PKA) pathway can also be involved (22). In particular, farnesol inhibits the transcription of cyr1, provoking a decrease in the levels of intracellular cyclic AMP (cAMP) (16), and also modulates the transcription levels of tup1, a major repressor of the morphological transition (23).
QS mechanisms have also been described in filamentous fungi from the genera Aspergillus (19, 24) and Penicillium (15, 25).
In this work, we demonstrated the existence of QS mechanisms mediated by the signal molecule farnesol in the dimorphic fungus O. piceae and how these mechanisms influence the secretion of a sterol esterase (OPE), an interesting biocatalyst for different biotechnological applications. We also analyzed the accumulation of the QS molecule during fungal growth and its role in the yeast-to-mycelium differentiation. Finally, we studied the signal transduction components that mediate the response.
MATERIALS AND METHODS
Fungal strain and culture conditions.
O. piceae (CECT 20416) was grown at 28°C and 180 rpm in a medium containing 10 g/liter glucose, 2 g/liter ammonium tartrate, 1 g/liter KH2PO4, 1 g/liter yeast extract, 0.5 g/liter MgSO4·7H2O, 0.5 g/liter KCl, and 1 ml mineral solution [100 mg/liter B4O7Na2·10H2O, 70 mg/liter ZnSO4·7H2O, 50 mg/liter FeSO4·7H2O, 10 mg/liter CuSO4·5H2O, 10 mg/liter MnSO4·4H2O, 10 mg/liter (NH4)6Mo7O24·4H2O], supplemented with peptone (0.5% [wt/vol]) and highly refined olive oil (0.5% [wt/vol]) (Sigma, O1514) (5). Five-day-old cultures, inoculated from 2% malt extract-glucose-agar, were used to inoculate 250-ml Erlenmeyer flasks with 50 ml of culture medium (2.5% [vol/vol] inoculum), corresponding to a final cell density of 7 × 10⁵ cells/ml. After 48 h of incubation, different treatments were established using a battery of putative QS signal molecules, i.e., farnesol (mixture of isomers; Sigma F203), E,E-farnesol (pure isomer; Sigma 277541), γ-butyrolactone, N-(3-oxodecanoyl)-l-homoserine lactone, tyrosol, and dodecanol, which were added to the cultures at a final concentration of 1 mM. E,E-Farnesol was assayed at two different final concentrations (100 μM and 1 mM) to corroborate the results with a concentration 10 times below the solubility limit of farnesol in water and to avoid any possible toxic effect. Another treatment was established adding extracted medium (spent medium obtained as described below) from 50 ml of culture supernatants. A group without these compounds was inoculated under the same conditions (2.5% [vol/vol] inoculum) as controls. Samples were taken periodically for 240 h from three replicate flasks, and experiments were repeated twice. The mycelium was separated from the culture liquids by centrifugation at 8,000 × g and 4°C for 10 min.
In addition, the effect of using two different inoculum concentrations (1% and 4% [vol/vol]) was also analyzed. Cultures were inoculated from 5-day-old precultures where the proportion of yeast cells was very high and farnesol was not detectable.
Growth evaluation.
Microbial biomass was calculated as dry weight (CDW) from 10 ml of culture. Culture morphology was determined at every sampling point from fresh samples from the culture, using a Zeiss Axioskop 2 microscope (Carl Zeiss GmBH) with a 40× objective. When maximum differences in morphology were noticed, three fields of each replicate of each culture were inspected, and differentiated cells were quantified and normalized to 100% (yeast/filamentous cells). Cells with buds were counted as yeasts, and spores and cells forming germ tubes were classified as hyphae, as previously reported (26).
Analytical assays.
Generic esterase and lipase activities were assayed spectrophotometrically by p-nitrophenol (ε410 = 15,200 M−1 cm−1) release from p-nitrophenyl butyrate (pNPB) in 25 mM Tris-HCl buffer, pH 7.2 (5). One unit of activity was defined as the amount of enzyme hydrolyzing 1 μmol of substrate per minute under these conditions. The protein concentration was determined by the method of Bradford (Bio-Rad protein assay) using serum albumin as a standard.
Farnesol quantification.
Culture supernatants (10 ml) were extracted with 10 ml n-hexane–ethanol (90:10, vol/vol), dried, and resuspended in acetonitrile for injection (27, 28). Reverse-phase high-performance liquid chromatography (HPLC) was carried out in an HPLC (Thermo Finnigan Surveyor PDA Plus detector; Thermo Fisher) using an RP18 Aquapore C18 column (7 μm, 150 by 3.2 mm) (Life Technologies). A linear gradient of acetonitrile-water (0% to 100% over 20 min) was used as the mobile phase. Detection was done with an associated mass spectrometer (Thermo Scientific LXQ; Thermo Fisher), selecting a characteristic ion of m/z 205 and daughter ions of m/z 121 and m/z 109. Standard concentrations of E,E-farnesol ranged from 1 μM to 250 μM. Extraction and quantification of farnesol were carried out from sterile medium without inoculum as a negative control.
Supernatants (50 ml) from cultures with a high-density inoculum (4%, vol/vol) were extracted, dried, and resuspended in methanol at the second day of incubation, when the farnesol production was the highest. These extracts were used as an inductor (spent medium) in fresh cultures.
Identification and quantification of the relative expression of QS-related genes.
Genes homologous to those regulated by QS mechanisms in C. albicans, coding for transcriptional repressor (tup1) and adenylate cyclase (cyr1) (16, 23), were searched in the publicly available genomes of O. piceae (29) and Ophiostoma ulmi (30). Once the genes with highest homology were identified, a BLAST search against the NCBI database was carried out for both genes. The sequences from the best hits (corresponding to phylogenetically related fungal species) were aligned, and primers for PCR amplification were designed in conserved regions: tup1 Fw (5′-GAGAGTGTTGTTTGCTGTGTTCG-3′), tup1 Rv (5′-GACAGAGTTCTTGTGTCCCTGC-3′, cyr1 Fw (5′-GGACTAACCTGTGGGAGACATAC-3′), and cyr1 Rv (5′-ATTGGGCCGTGGTAGTCCATG-3′).
The two sets of designed primers were used for amplification of O. piceae CECT 20416 genomic DNA and cDNA. Genomic DNA was extracted from 1-ml culture pellets, previously disrupted with liquid nitrogen, using the DNeasy plant minikit (Qiagen) according to the manufacturer's instructions. RNA was extracted using the RNeasy plant minikit (Qiagen), including the DNase treatment specified by the manufacturer. Reverse transcription of RNA was done using the GeneAmp RNA PCR reagent kit (Applied Biosystems).
The PCR amplifications were performed using a Mastercycler Pro S (Eppendorf) in a final volume of 50 μl with 1× PCR Taq buffer, 2.5 U of Taq polymerase (Invitrogen), 15 mM MgCl2, 0.25 mM each primer, and 1 mM deoxynucleoside triphosphates (dNTPs) (New England BioLabs). One hundred nanograms of genomic DNA or cDNA was used as the template. Cycling parameters were 94°C for 3 min followed by 30 cycles of 94°C for 45 s, 55°C for 45 s, and 72°C for 1.5 min and a final extension of 10 min at 72°C. PCR products were run in a 1% agarose gel and subsequently purified and inserted into pGEM-T Easy cloning vector (Promega). After transformation of the recombinant vectors into the Escherichia coli DH5α strain, 3 clones containing the inserted fragments were sequenced using the BigDye Terminator v3.1 cycle sequencing kit and the automated ABI Prism 3730 DNA sequencer (Applied Biosystems).
To perform real-time quantitative PCR (qPCR), primers were designed on the basis of the sequences of cyr1, tup1, the sterol esterase gene (ope) (GenBank accession number AY899847), and the 18S rRNA gene from O. piceae (accession number KF531618), using the Primer3Plus software (http://www.bioinformatics.nl/cgi-bin/primer3plus/primer3plus.cgi/). The primer sequences obtained were ope Fw (5′-CAGCTCTATCGCACTGTCGT-3′) and ope Rv (5′-TCCTCCTGGTCACCGATGAT-3′), cyr1 Fw (5′-ACGACACCGAGTTGAGCATC-3′) and cyr1 Rv (5′-GAAGGTGACGCTTTCATGGT-3′), tup1 Fw (5′-GGATATTGAGAACGGCCAGA-3′) and tup1 Rv (5′-AGGTAACCGTGCTGGATGTC-3′), and 18S Fw (5′-CCGAACGCAAGTTCTCTCTC-3′) and 18S Rv (5′-CCTACCTGATCCGAGGTCAA-3′).
qPCRs were performed using cDNA from three independent replicates of O. piceae control cultures or cultures induced with farnesol, inoculated with a medium cell density (2.5%), at two sampling times (192 h and 240 h). The PCR cycling conditions were as follows: an initial step at 95°C for 5 min, 45 cycles at 95°C for 30 s and 55°C for 30 s, and a denaturation step to check for the absence of unspecific products or primer dimmers. SYBR green PCR master mix (Bio-Rad) was used as the reaction mixture (10 μl), with the addition of 2.5 μl of sterile Milli-Q water, 1.25 μl of each primer (1 mM), and 5 μl of template cDNA in a final volume of 20 μl. In all experiments, appropriate reverse transcriptase (RT)-negative controls and controls containing no template were done to detect any possible contamination. Each sample was amplified twice in every experiment. The PCR efficiencies for all the primer sets were calculated by performing a 10-fold serial dilution of positive-control template to generate a standard curve and by plotting the cycle threshold (CT) as a function of log10 of template. The 18S rRNA gene was used as endogenous control gene to normalize the results. Quantification is relative to the control gene and was done by subtracting the CT of the control gene from the CT of the gene of interest. CT values were transformed to log2 to generate the relative expression levels.
Phylogenetic study.
Genomic DNA was extracted as described above, and the O. piceae 18S rRNA gene (partial sequence), internal transcribed spacer 1, 5.8S rRNA gene, and internal transcribed spacer 2 (complete sequence), and 28S rRNA gene (partial sequence) were amplified from genomic DNA using universal primers (31) and sequenced as described above. Sequences from Ophiostoma-related species were retrieved from the databases, and an unrooted phylogenetic tree was built using MUSCLE for alignment and the maximum-likelihood method (see Fig. S1 in the supplemental material).
Nucleotide sequence accession numbers.
The sequences determined in this work have been deposited in GenBank under accession numbers KF531616, KF531617, and KF531618.
RESULTS AND DISCUSSION
The ascomycete O. piceae causes important losses in the wood sector (3) but also secretes a sterol-esterase/lipase of high biotechnological interest (1, 32). In this work, the effects of several putative QS molecules on fungal growth and morphology, extracellular protein production, and, particularly, sterol esterase secretion were studied.
Growth evaluation and analytical assays.
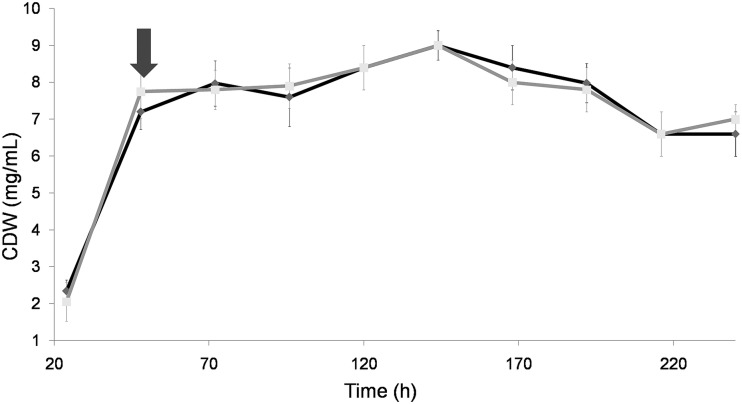
The evolution of fungal growth in the liquid culture, expressed as milligrams (dry weight) per milliliter, showed that the stationary phase was reached between 48 and 72 h (Fig. 1). The maximum growth yield in the cultures occurred at 144 h (9 mg/ml). No significant differences were observed between the control and the cultures supplemented with the different signal molecules, indicating that the cell integrity it is not affected by the molecules added.
FIG 1.
Fungal growth expressed as dry weight. The black line corresponds to control cultures and the gray line to the farnesol-supplemented cultures. The arrow indicates the time of the addition of farnesol (final concentration, 1 mM).
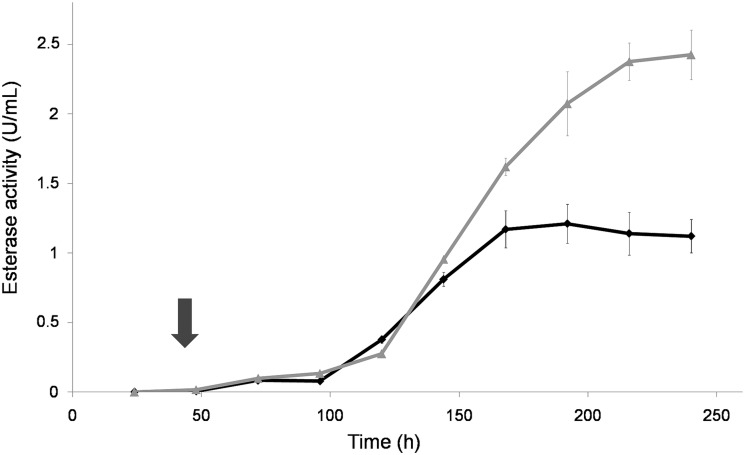
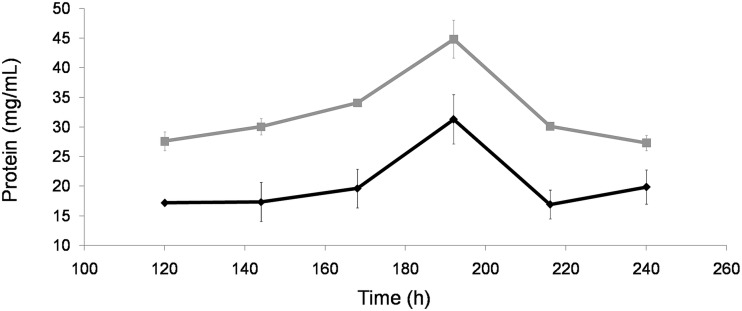
The sterol esterase activity increased rapidly at the end of stationary phase, when glucose was depleted (5). Maximum activity was reached around 200 h of culture in the presence or absence of signal molecules. The esterase activity was much higher in cultures supplemented with farnesol (∼2.5 times more) (Fig. 2), as was the extracellular protein concentration (Fig. 3). The increase in esterase activity and protein secretion was correlated with the morphological changes detected in the fungal cultures. These results were similar when the molecule added to the medium was E,E-farnesol at 100 μM or 1 mM and with the addition of an equivalent volume of “spent medium.” However, the other signal molecules tested, (described as QS molecules in other microorganisms), i.e., γ-butyrolactone (18, 24), N-(3-oxodecanoyl)-l-homoserine lactone (9), tyrosol (14), and dodecanol (16), showed no effect on the parameters measured in O. piceae cultures with respect to the control (data not shown). The different molecules were added to the cultures at 48 h after inoculation in order to avoid growth inhibition, as described by other authors (15).
FIG 2.
Time course of sterol esterase activity in O. piceae cultures with p-nitrophenyl butyrate (pNPB) as the substrate. The black line corresponds to control cultures and the gray line to the farnesol-supplemented cultures. The arrow indicates the time of the addition of farnesol (final concentration, 1 mM).
FIG 3.
Measurement of total secreted protein levels during growth of O. piceae cultures. The black line corresponds to control cultures and the gray line to the farnesol-supplemented cultures.
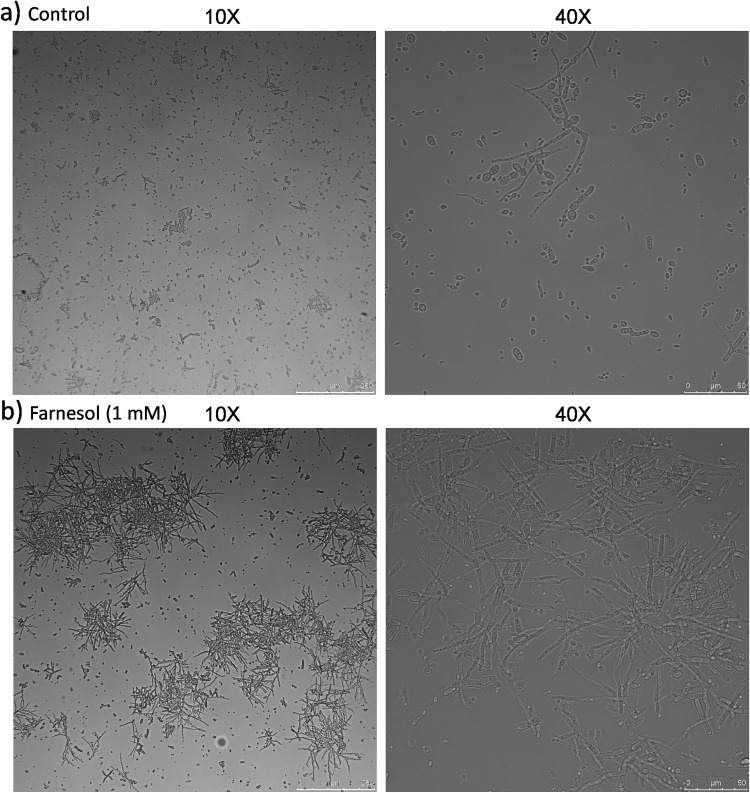
Microscopic analysis of the samples revealed a morphological change from yeast to hyphae over time in the farnesol-induced cultures and with the addition of the “spent medium.” The maximum differences in morphology were observed around 120 h postinoculation: the control cultures had 86.3% ± 3.6% yeast cells, while those with 1 mM farnesol treatment had many more hyphae and only 30.1% ± 10.5% yeast cells (Fig. 4). In the case of 100 μM farnesol treatment, the proportion of yeast cells was 42% ± 5.2%, and in the treatment with the “spent medium,” there were 47% ± 12.7% yeast cells. In the case of the cultures inoculated with different inoculum concentrations (1% and 4%, vol/vol), without exogenous signal molecules added, the morphological analysis at 120 h postinoculation showed clear differences among them. When a 1% inoculum was used, a large proportion of yeast cells (94% ± 4.6%) was found, while the cultures with a high inoculum density (4%) had many more hyphae and only 58% ± 10.7% yeast cells. Moreover, the cultures with a high inoculum density also had higher esterase activity, 1.7-fold at 240 h postinoculation, when no differences in dry weight were found.
FIG 4.
Morphological changes of fungal cultures at 120 h after inoculation in the absence (a) or presence (b) of exogenous farnesol.
The effect of farnesol or the “spent medium” was independent of the fungal biomass (Fig. 1). In this sense, it should be emphasized that OPE is the only esterase and the most abundant protein in O. piceae supernatants (5). The increase of secreted proteins seems to be correlated with the morphological changes detected in the cultures supplemented with farnesol or the cultures with a high inoculum density. OPE specific activity (esterase activity/milligram of protein) increased in the farnesol-treated cultures over time, being eight times higher at the 240 h (88 mU/mg) than at the 120 h (10 mU/mg). That in control cultures increased 2.5 times from 120 h of culture (21 mU/mg) to 240 h (56 mU/mg). This may be due to a selective increased secretion of OPE coupled with the morphological transition along time.
Farnesol production.
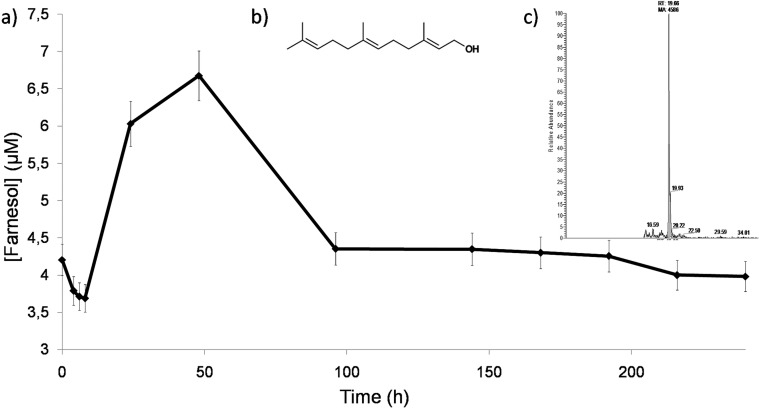
No detectable amount of farnesol was found in control medium without fungal growth. E,E-Farnesol is the unique isomer described to have biological activity in fungi (11, 12), and it was the only isomer identified in the O. piceae cultures. This was also the main isomer detected in the farnesol mixture of isomers (Sigma F203) added to cultures as a QS molecule. The amount of farnesol found at the second day of growth in the cultures with a high inoculum density (4%) was around 22 μM, while in the cultures with a low inoculum density (1%), it was not detectable. Figure 5 shows the accumulation of E,E-farnesol detected in the O. piceae cultures with a 2.5% inoculum density measured at different times. The maximum farnesol concentration was reached between 24 and 48 h of incubation (∼7 μM), and it decreased drastically during the stationary phase, suggesting a turnover of the molecule in the cultures. The scarce presence of the mycelial form of the fungi in the cultures with 1% and 2.5% inocula could be explained by the low concentration of farnesol accumulated. This concentration may not be enough to produce the morphological differentiation, while in the higher-density culture (4%) the farnesol concentration could lead to the morphological differentiation and to an increased extracellular esterase activity. The supernatants from the higher-density cultures were the starting point for the production of the “spent medium,” and its farnesol content could explain the biological activity when added to fresh cultures.
FIG 5.
(a) E,E-farnesol detected in control cultures at the different sampling times; (b) molecular structure of E,E-farnesol; (c) HPLC-tandem mass spectrometry chromatograms of the farnesol extracted from control cultures at 48 h. The retention time corresponded to those of the E,E-farnesol standard and the farnesol mix of isomers (Sigma-Aldrich F203), where the E,E-farnesol was the majority. Quantification was carried out with the daughter ions at m/z 121 and 149 from the characteristic farnesol ion at m/z 205.
The biological effect on the fungal morphogenesis mediated by QS mechanisms has also been described in other dimorphic fungi, such as C. albicans (11), O. ulmi (4), Cryptococcus neoformans (13), and Saccharomyces cerevisiae (17). Interestingly, other authors did not find any effect of farnesol on O. ulmi (4, 26, 33). In this sense, the O. piceae strain studied in this work is a saprophyte and affiliates phylogenetically with the nonpathogenic species of the Ophiostoma clade, such as O. quercus, far from the pathogens O. ulmi and O. novo-ulmi (see Fig. S1 in the supplemental material). This fact may indicate a differential QS regulation mediated by farnesol in different clades and in close relatives that do not share the same habitat.
Identification and quantification of the relative expression of QS-related genes.
Orthologues of the tup1 and cyr1 genes of C. albicans were identified “in silico” in the genomes of O. piceae (29) and O. ulmi (30) as close relatives of our strain, probably with a common ancestor (see Fig. S1 in the supplemental material). These sequences had an identities of 44% for tup1 and 66% for cyr1 at the nucleotide level and of 56% for tup1 and 71% for cyr1 at the amino acid level. After designing primers, homologues in O. piceae CECT 20416 were amplified by PCR and partially sequenced from cDNA and genomic DNA. The 820-bp sequence from tup1 and the 363-bp sequence from cyr1 lacked introns. The absence of introns has in the gene for the O. piceae sterol esterase also been reported (32). The sequences obtained had nucleotide identities of 76% for tup1 and 87% for cyr1 with the genes from the Canadian strain of O. piceae (29). The identities at the amino acid level rose to 98% and 97%, respectively.
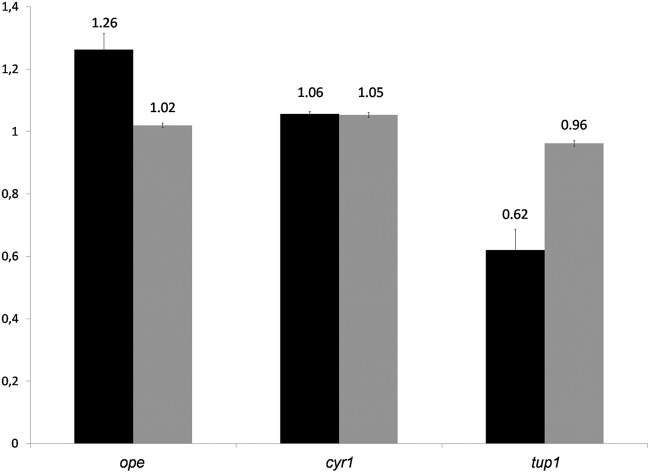
Using the sequences of the QS-related genes tup1 (accession number KF531616) and cyr1 (accession number KF531617), the partial 18S rRNA sequence from O. piceae (accession number KF531618), and the sequence of the sterol esterase gene from O. piceae (ope), RT-qPCR analyses were carried out. Two different sampling points were analyzed, 192 h and 240 h, when induction of esterase activity and protein production in the farnesol supplemented cultures were more pronounced. The transcription levels of cyr1 in the presence and absence of farnesol did not change significantly in our experiments (Fig. 6), in agreement with the results of Hall et al. (16), who detected changes not in gene expression but in the activity levels of Cyr1p. However, the gene tup1 showed a relative expression of 0.62 times that of the control at 192 h, which recovered to 0.96 times that of the control at 240 h. These genes have been shown to be up- and downregulated, respectively, in the presence of farnesol in C. albicans (16, 23). These results may suggest a moderate repression of tup1 that could be in concordance with the opposite effects of farnesol in O. piceae, where it stimulates hypha formation, and in C. albicans, where it represses hypha formation (23). Hence, it would be interesting to determine in future studies if the mechanisms behind this control are conserved.
FIG 6.
Relative expression of the genes identified in O. piceae in the presence and absence of farnesol. RT-qPCR was carried out at 192 h (black bars) and 240 h (gray bars).
The absence of differences in the gene expression of ope (Fig. 6) is in agreement with data from other O. piceae strain growing in a basal medium with olive oil. In this case, it was not possible to detect an increase in the lipase gene transcription at the time sampled, although lipase activity was higher than in the culture without olive oil (29). Thus, the higher protein levels and lipase/esterase activity secreted in the cultures supplemented with farnesol in this study could be explained by the higher proportion of mycelia and active hyphal tips, where the secretion mainly occurs. Other authors reported similar results in the fungus Penicillium decumbens, where farnesol increased the hyphal size and, as a consequence, the secretion of hydrolytic enzymes by this fungus was higher (15).
Conclusions.
In this work, we demonstrated the implication of QS mechanisms in the morphological transition from yeast to hyphae in the saprophytic fungus O. piceae. The results obtained suggest that E,E-farnesol is the molecule involved in the QS signaling, and its transduction could be mediated by the transcriptional repressor tup1. These results, showing enhanced production of a sterol-esterase/lipase of biotechnological interest mediated by QS mechanisms, can be useful to increase the production of secreted enzymes of other dimorphic fungi of biotechnological interest.
Supplementary Material
ACKNOWLEDGMENTS
We thank D. J. Martín for his collaboration and A. Prieto for her suggestions.
This work was supported by the Spanish projects BIO2012-3637, PRI-PIBAR-2011-1402, and S-2009AMB-1480. J. Barriuso acknowledges financial support from the JAE-DOC CSIC program.
Footnotes
Supplemental material for this article may be found at http://dx.doi.org/10.1128/AEM.00079-15.
REFERENCES
- 1.Barba Cedillo V, Prieto A, Martinez MJ. 2013. Potential of Ophiostoma piceae sterol esterase for biotechnologically relevant hydrolysis reactions. Bioengineering 4:249–253. doi: 10.4161/bioe.22818. [DOI] [PMC free article] [PubMed] [Google Scholar]
- 2.Jaeger KE, Reetz MT. 1998. Microbial lipases form versatile tools for biotechnology. Trends Biotechnol 16:396–403. doi: 10.1016/S0167-7799(98)01195-0. [DOI] [PubMed] [Google Scholar]
- 3.Krokene P, Solheim H. 1998. Pathogenicity of four blue-stain fungi associated with aggressive and nonaggressive bark beetles. Phytopathology 88:39–44. doi: 10.1094/PHYTO.1998.88.1.39. [DOI] [PubMed] [Google Scholar]
- 4.Berrocal A, Navarrete J, Oviedo C, Nickerson KW. 2012. Quorum sensing activity in Ophiostoma ulmi: effects of fusel oils and branched chain amino acids on yeast-mycelial dimorphism. J Appl Microbiol 113:126–134. doi: 10.1111/j.1365-2672.2012.05317.x. [DOI] [PubMed] [Google Scholar]
- 5.Calero-Rueda O, Plou FJ, Ballesteros A, Martinez AT, Martinez MJ. 2002. Production, isolation and characterization of a sterol esterase from Ophiostoma piceae. Biochim Biophys Acta 1599:28–35. doi: 10.1016/S1570-9639(02)00378-3. [DOI] [PubMed] [Google Scholar]
- 6.Barriuso J, Prieto A, Martínez MJ. 2013. Fungal genomes mining to discover novel sterol esterases and lipases as catalysts. BMC Genomics 14:712. doi: 10.1186/1471-2164-14-712. [DOI] [PMC free article] [PubMed] [Google Scholar]
- 7.Bassler BL. 1999. How bacteria talk to each other: regulation of gene expression by quorum sensing. Curr Opin Microbiol 2:582–587. doi: 10.1016/S1369-5274(99)00025-9. [DOI] [PubMed] [Google Scholar]
- 8.Hogan DA. 2006. Talking to themselves: autoregulation and quorum sensing in fungi. Eukaryot Cell 5:613–619. doi: 10.1128/EC.5.4.613-619.2006. [DOI] [PMC free article] [PubMed] [Google Scholar]
- 9.Barriuso J, Solano BR, Fray RG, Camara M, Hartmann A, Manero FJG. 2008. Transgenic tomato plants alter quorum sensing in plant growth-promoting rhizobacteria. Plant Biotech J 6:442–452. doi: 10.1111/j.1467-7652.2008.00331.x. [DOI] [PubMed] [Google Scholar]
- 10.Fuqua WC, Winans SC, Greenberg EP. 1994. Quorum sensing in bacteria—the LuxR-LuxI family of cell density-responsive transcriptional regulators. J Bacteriol 176:269–275. [DOI] [PMC free article] [PubMed] [Google Scholar]
- 11.Hornby JM, Jensen EC, Lisec AD, Tasto JJ, Jahnke B, Shoemaker R, Dussault P, Nickerson KW. 2001. Quorum sensing in the dimorphic fungus Candida albicans is mediated by farnesol. Appl Environ Microbiol 67:2982–2992. doi: 10.1128/AEM.67.7.2982-2992.2001. [DOI] [PMC free article] [PubMed] [Google Scholar]
- 12.Nickerson KW, Atkin AL, Hornby JM. 2006. Quorum sensing in dimorphic fungi: farnesol and beyond. Appl Environ Microbiol 72:3805–3813. doi: 10.1128/AEM.02765-05. [DOI] [PMC free article] [PubMed] [Google Scholar]
- 13.Albuquerque P, Casadevall A. 2012. Quorum sensing in fungi-a review. Med Mycol 50:337–345. doi: 10.3109/13693786.2011.652201. [DOI] [PMC free article] [PubMed] [Google Scholar]
- 14.Alem MAS, Oteef MDY, Flowers TH, Douglas LJ. 2006. Production of tyrosol by Candida albicans biofilms and its role in quorum sensing and biofilm development. Eukaryot Cell 5:1770–1779. doi: 10.1128/EC.00219-06. [DOI] [PMC free article] [PubMed] [Google Scholar]
- 15.Guo H, Ma A, Zhao G, Yun J, Liu X, Zhang H, Zhuang G. 2011. Effect of farnesol on Penicillium decumbens's morphology and cellulase production. Bioresources 6:3252–3259. [Google Scholar]
- 16.Hall RA, Turner KJ, Chaloupka J, Cottier F, De Sordi L, Sanglard D, Levin LR, Buck J, Muehlschlegel FA. 2011. The quorum-sensing molecules farnesol/homoserine lactone and dodecanol operate via distinct modes of action in Candida albicans. Eukaryot Cell 10:1034–1042. doi: 10.1128/EC.05060-11. [DOI] [PMC free article] [PubMed] [Google Scholar]
- 17.Hogan DA. 2006. Quorum sensing: alcohols in a social situation. Curr Biol 16:R457–R458. doi: 10.1016/j.cub.2006.05.035. [DOI] [PubMed] [Google Scholar]
- 18.Raina S, De Vizio D, Palonen EK, Odell M, Brandt AM, Soini JT, Keshavarz T. 2012. Is quorum sensing involved in lovastatin production in the filamentous fungus Aspergillus terreus? Process Biochem 47:843–852. doi: 10.1016/j.procbio.2012.02.021. [DOI] [Google Scholar]
- 19.Williams HE, Steele JC, Clements MO, Keshavarz T. 2012. γ-Heptalactone is an endogenously produced quorum-sensing molecule regulating growth and secondary metabolite production by Aspergillus nidulans. Appl Microbiol Biotechnol 96:773–781. doi: 10.1007/s00253-012-4065-5. [DOI] [PubMed] [Google Scholar]
- 20.Biswas S, Van Dijck P, Datta A. 2007. Environmental sensing and signal transduction pathways regulating morphopathogenic determinants of Candida albicans. Microbiol Mol Biol Rev 71:348. doi: 10.1128/MMBR.00009-06. [DOI] [PMC free article] [PubMed] [Google Scholar]
- 21.Bandara HMHN, Lam OLT, Jin LJ, Samaranayake L. 2012. Microbial chemical signaling: a current perspective. Crit Rev Microbiol 38:217–249. doi: 10.3109/1040841X.2011.652065. [DOI] [PubMed] [Google Scholar]
- 22.Lu Y, Su C, Unoje O, Liu H. 2014. Quorum sensing controls hyphal initiation in Candida albicans. Proc Natl Acad Sci U S A 111:1975–1980. doi: 10.1073/pnas.1318690111. [DOI] [PMC free article] [PubMed] [Google Scholar]
- 23.Kebaara BW, Langford ML, Navarathna DH, Dumitru R, Nickerson KW, Atkin AL. 2008. Candida albicans Tup1 is involved in farnesol-mediated inhibition of filamentous-growth induction. Eukaryot Cell 7:980–987. doi: 10.1128/EC.00357-07. [DOI] [PMC free article] [PubMed] [Google Scholar]
- 24.Sorrentino F, Roy I, Keshavarz T. 2010. Impact of linoleic acid supplementation on lovastatin production in Aspergillus terreus cultures. Appl Microbiol Biotechnol 88:65–73. doi: 10.1007/s00253-010-2722-0. [DOI] [PubMed] [Google Scholar]
- 25.Raina S, Odell M, Keshavarz T. 2010. Quorum sensing as a method for improving sclerotiorin production in Penicillium sclerotiorum. J Biotechnol 148:91–98. doi: 10.1016/j.jbiotec.2010.04.009. [DOI] [PubMed] [Google Scholar]
- 26.Hornby JM, Jacobitz-Kizzier SM, Mcneel DJ, Jensen EC, Treves DS, Nickerson KW. 2004. Inoculum size effect in dimorphic fungi: extracellular control of yeast-mycelium dimorphism in Ceratocystis ulmi. Appl Environ Microbiol 70:1356–1359. doi: 10.1128/AEM.70.3.1356-1359.2004. [DOI] [PMC free article] [PubMed] [Google Scholar]
- 27.Song L. 2009. Recovery of E,E-Farnesol from cultures of yeast erg9 mutants: extraction with polymeric beads and purification by normal-phase chromatography. Biotechnol Progr 25:1111–1114. doi: 10.1002/btpr.180. [DOI] [PubMed] [Google Scholar]
- 28.Weber K, Sohr R, Schulz B, Fleischhacker M, Ruhnke A. 2008. Secretion of E,E-farnesol and biofilm formation in eight different Candida species. Antimicrob Agents Chemother 52:1859–1861. doi: 10.1128/AAC.01646-07. [DOI] [PMC free article] [PubMed] [Google Scholar]
- 29.Haridas S, Wang Y, Lim L, Alamouti S, Massoumi JS, Docking R, Robertson G, Birol I, Bohlmann J, Breuil C. 2013. The genome and transcriptome of the pine saprophyte Ophiostoma piceae, and a comparison with the bark beetle-associated pine pathogen Grosmannia clavigera. BMC Genomics 14:373. doi: 10.1186/1471-2164-14-373. [DOI] [PMC free article] [PubMed] [Google Scholar]
- 30.Khoshraftar S, Hung S, Khan S, Gong Y, Tyagi V, Parkinson J, Sain M, Moses AM, Christendat D. 2013. Sequencing and annotation of the Ophiostoma ulmi genome. BMC Genomics 14:162. doi: 10.1186/1471-2164-14-162. [DOI] [PMC free article] [PubMed] [Google Scholar]
- 31.White TJ, Bruns T, Lee S, Taylor J. 1990. Amplification and direct sequencing of fungal ribosomal RNA genes for phylogenetics, p 315–322. In Innis MA, Gelfand DH, Sninsky JJ, White TJ (ed), PCR protocols: a guide to methods and applications. Academic Press, San Diego, CA. [Google Scholar]
- 32.Calero-Rueda O, Barba V, Rodríguez E, Plou FJ, Martínez AT, Martínez MJ. 2009. Study of a sterol esterase secreted by Ophiostoma piceae: sequence, model and biochemical properties. Biochim Biophys Acta 1794:1099–1106. doi: 10.1016/j.bbapap.2009.02.012. [DOI] [PubMed] [Google Scholar]
- 33.Berrocal A, Oviedo C, Nickerson KW, Navarrete J. 2014. Quorum sensing activity and control of yeast-mycelium dimorphism in Ophiostoma floccosum. Biotechnol Lett 36:1503–1513. doi: 10.1007/s10529-014-1514-5. [DOI] [PubMed] [Google Scholar]
Associated Data
This section collects any data citations, data availability statements, or supplementary materials included in this article.


