

Significance
Many suggest we are approaching a sixth mass extinction event, and yet estimates of how many species exist, and thus how many might become extinct, vary by as much as an order of magnitude. There are few statistically robust methods to estimate global species richness, and here we introduce several new methods, including one that builds on the observation that larger species are often described before smaller species. We combine these, giving equal weight to each, to provide mean global species estimates for the most speciose order, class, and phylum on Earth, beetles, insects, and arthropods (terrestrial). We attempt to aid conservation planning by broadening the range of methods used and bringing greater stability to global estimates for these taxa.
Keywords: biodiversity, body size, Coleoptera, species richness
Abstract
It has been suggested that we do not know within an order of magnitude the number of all species on Earth [May RM (1988) Science 241(4872):1441–1449]. Roughly 1.5 million valid species of all organisms have been named and described [Costello MJ, Wilson S, Houlding B (2012) Syst Biol 61(5):871–883]. Given Kingdom Animalia numerically dominates this list and virtually all terrestrial vertebrates have been described, the question of how many terrestrial species exist is all but reduced to one of how many arthropod species there are. With beetles alone accounting for about 40% of all described arthropod species, the truly pertinent question is how many beetle species exist. Here we present four new and independent estimates of beetle species richness, which produce a mean estimate of 1.5 million beetle species. We argue that the surprisingly narrow range (0.9–2.1 million) of these four autonomous estimates—derived from host-specificity relationships, ratios with other taxa, plant:beetle ratios, and a completely novel body-size approach—represents a major advance in honing in on the richness of this most significant taxon, and is thus of considerable importance to the debate on how many species exist. Using analogous approaches, we also produce independent estimates for all insects, mean: 5.5 million species (range 2.6–7.8 million), and for terrestrial arthropods, mean: 6.8 million species (range 5.9–7.8 million), which suggest that estimates for the world’s insects and their relatives are narrowing considerably.
Beetles account for roughly 25% (350,000–400,000 species) (1) of all described species (∼1.5 million species), making this the most species-rich order known on Earth and supporting the philosopher Haldane’s famous observation that God has “an inordinate fondness for beetles” (2, 3). Therefore, because this is a single lineage, an understanding of their global species richness, and that of the insects and other arthropods of which they form a part, is particularly important. There have been several reviews that discuss the merits of different estimates of the species richness for these taxa as well as of other organisms (1, 4–9), but none have been able to use these to derive mean estimates with some measure of error associated with these means. Here we compare global species estimates for beetles, insects, and terrestrial arthropods from eight different methods of estimation (here called methods 1–8). One of these (method 8) we introduce here, called the “body size and year of description” method, is based on the observed tendency for larger species of organisms to be described and named before smaller species, resulting in a decline in the mean body size of named species over time (10, 11). We use data for beetles from the Natural History Museum (NHM) world collection in London and the British fauna to test this method. There has been some discussion as to whether global species estimates are converging (12) or not (13), and here we test this further.
Methods
British Beetle Body Sizes.
The most recent checklist (14) was used for the list of names of British beetles and the year they were described. Body lengths were calculated as mean values of the body-size ranges provided by Joy in 1932 (15). For the ∼700 species added to the British list since then, a range of electronic and literature sources was used to derive body sizes. Body sizes could not be found for ∼20 species (only 0.5% of species), and estimates of body sizes for these species were made using the mean body sizes of either other species in the same genus or of similar genera in the same subtribe or tribe. The year of description of each species was traced using the checklist of British beetles (14). We note that the year of description for a species is not necessarily the same year a species is recognized as occurring in Britain, because a species may be described elsewhere in Europe and it may take many years before it is recognized as being present in Britain. Some of the more recent changes in the new British checklist (14) reflect such additions. For example, Asaphidion curtum (Carabidae) was described by Heyden in 1870 elsewhere in continental Europe but was not recognized in Britain until 1986 (16), even though it has no doubt been present for a very long while, as it is very similar to A. flavipes (L). Our body size–year plots reflect the year of description and not when a species was discovered in Britain. Disentangling these two different dates would be a very complex task.
Body Sizes of Beetles in the NHM.
Data from the curated named species of beetles in the NHM collection were made in June 2011. The collection of named beetle species is housed in 8,891 drawers across 972 cabinets. Every three cabinets, a single drawer was selected from across those cabinets using random numbers. In total, 189 drawers were selected for data collection. Some cabinets contained no curated beetles, and these were ignored. The number of drawers in cabinets varied between 15 and 20, and in some instances the drawer selected either was empty (drawers are left empty throughout the collection to allow easy expansion as new specimens are added) or held unsorted specimens. In these cases, the next drawer of the curated collection was selected. When selected, the drawer was removed from the cabinet and the names of all named species and their body lengths were recorded. Body lengths were measured from the anterior-most part of the head, excluding the antennae, to the posterior-most point of the abdomen or elytra for the largest and smallest individuals in a series and the mean was determined.
Number of Beetle Species in the NHM.
The database of the NHM’s beetle collection at the time of sampling (2011) comprised 179,649 species, excluding subspecies, recognized synonyms, and manuscript names. This is roughly half of the world’s described beetles. Currently the collection has 188,735 full species (December 19, 2014), suggesting roughly 2–3,000 species are being added a year. Like all large taxonomic collections, specimens where they have been identified to species have been added to the collection including new species. However, with almost 9,000 drawers, it is impossible for the curators to make sure that all parts of the collection are taxonomically correct and reflect the current systematic arrangements of species. Some of the taxa listed as species in the collection may now have been synonymized but corrections to the collection have not always been made. We have no reason to believe that the size distribution of the beetle species in the NHM is not representative of all currently described beetle species.
Year of Description Against Body Size for Beetles in the NHM.
To test whether the negative correlation between year of description and body size found for British beetles (12) was also true for the NHM’s beetle collection, the year of description was sought for a subsample of the beetles that were databased for this study. Tracking down the year of description for the species in the sample was largely done through a number of the global species databasing systems that are currently available as well as through publications. Families for which year of description were recorded were completed in alphabetical order up to and including Phengodidae. Families where it was difficult to find the year of description for more than 95% of species were not included in this analysis to avoid biasing the sample.
Results
The different methods of estimating global species richness for the focal taxa and the resulting estimates are summarized in Table 1 and are summarized here. Method 1: The host specificity of insects to trees (8, 17, 18) has been recently reexamined (19, 20) and here, using the same modeling, we provide estimates for beetles alone. Method 2: The ratio of butterflies to other insects in the British fauna scaled up using estimates for all butterflies in the world (21) has been updated here using new estimates of the British insects (22) to give estimates for beetles and insects of the world. Method 3: Recent modeling of the number and regional distribution of all plants (23) suggests 2.1% of the world’s plants are found in North America (excluding Mexico). The beetle faunal list of this region is 25,160 with a projected total (including undescribed species) of 28,000 (24). Here we assume that the ratio of beetle to plant species is similar across the world, scaling up to give an estimate of the number of beetle species in the world. Figures for methods 4–7 (higher taxonomic ratios, taxonomists’ estimates, educated guesses, and proportion of new species) are from the literature and are discussed further below.
Table 1.
Summary of methods of estimating global species richness of beetles, insects, and terrestrial arthropods
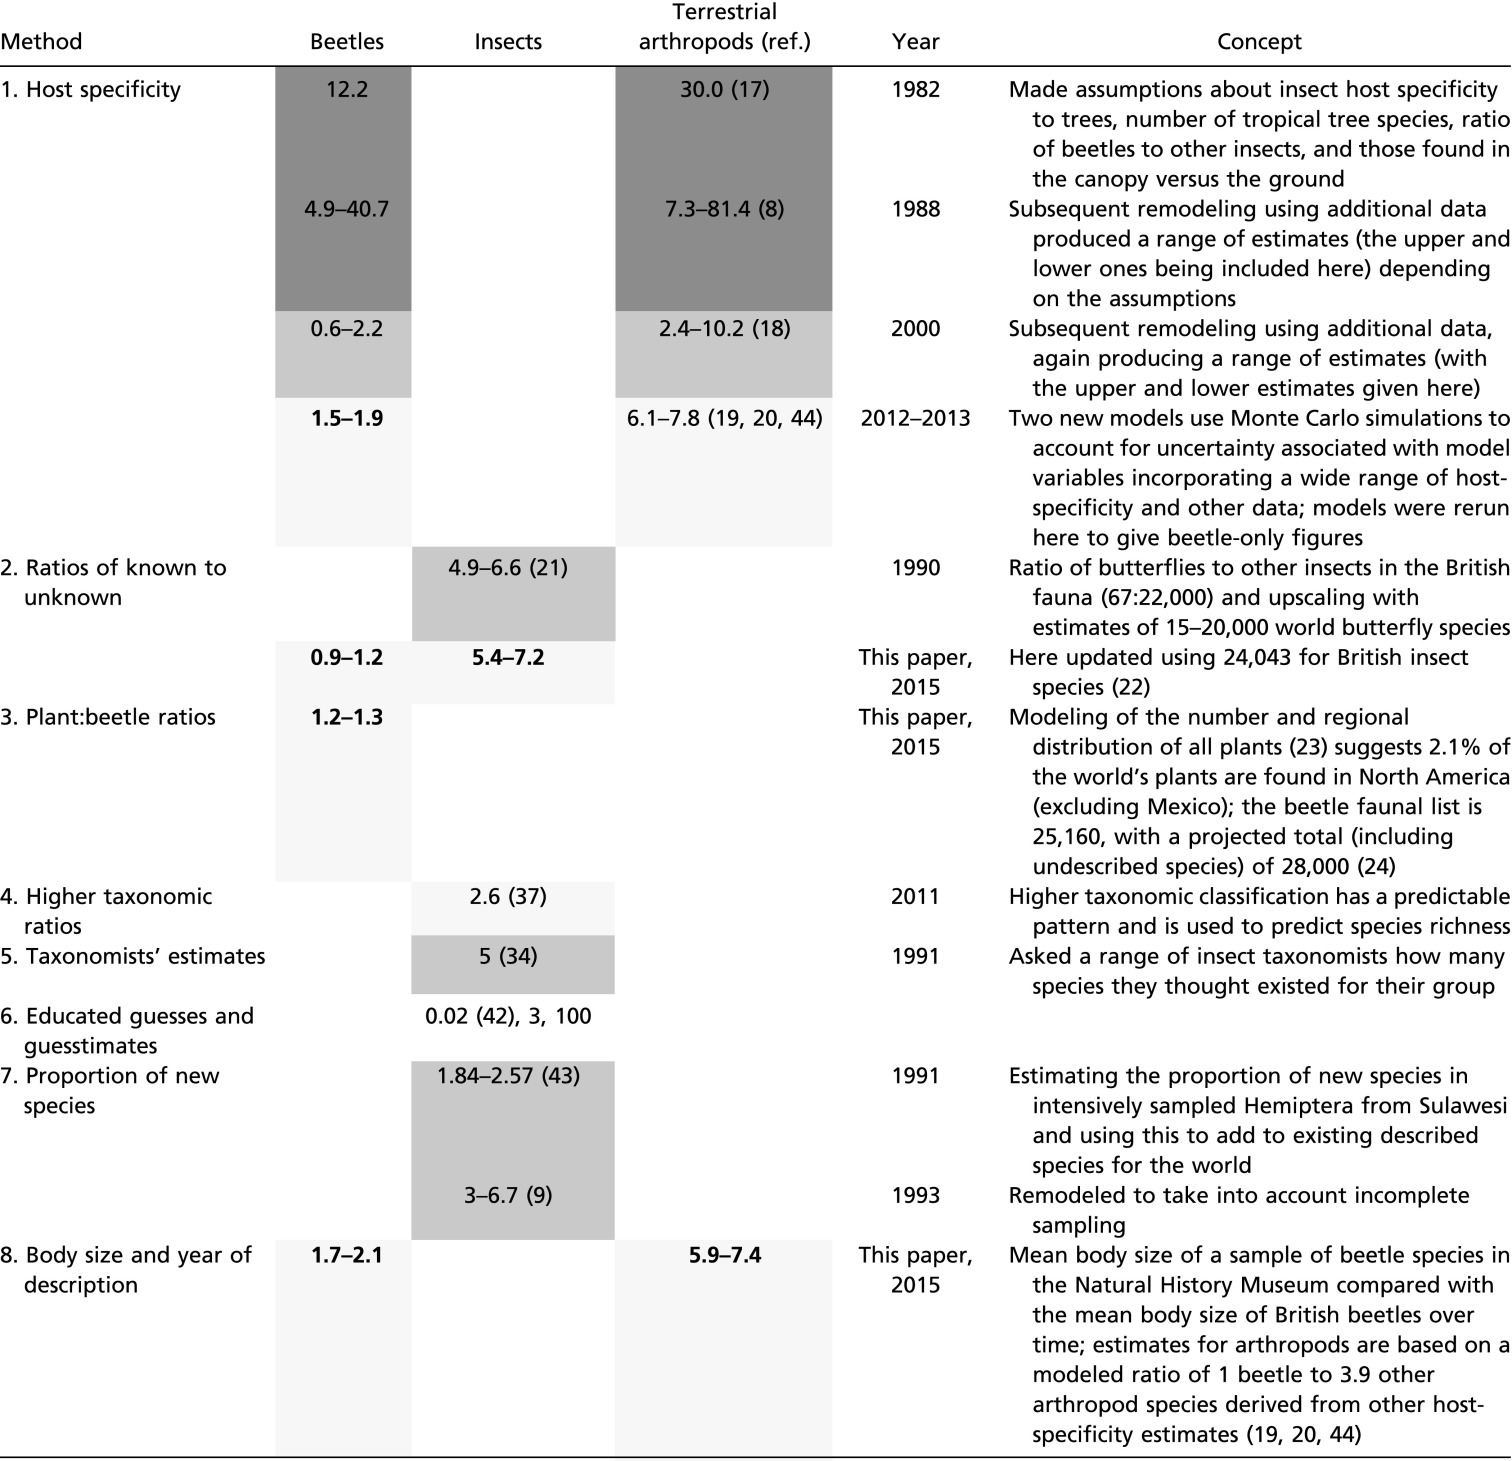 |
Estimates are in millions, with new estimates from this paper in bold. We have not included any estimates (here called “guesstimates”) where there was no clear basis for the figure. Estimates within three time periods (1980–1989, 1990–2000, and 2001–present) are shaded, with the darkest shading for the earliest period and the lightest for the current period.
Method 8: Because Gaston (11) found that larger species of British beetles were generally described earlier than smaller species, we used a plot of the cumulative loge mean body size for British beetles against year to test where the mean body size of a sample of the NHM’s world collection of beetle species fitted. We found that the 95% confidence intervals for the mean body size of a sample of 2,652 named beetle species in the NHM encompass the 95% confidence intervals for the mean body size of all named British beetles described by the years 1758 and 1762, when 352 species and 437 species had been described, respectively (Fig. 1; see also Fig. S1, where we have used cumulative species instead of year for the x axis). We suggest that the ratio of the number of beetle species in the NHM collection to the number of British species described in 1758 or 1762 can be used as multiplication factors (e.g., 179,649/352 = 510.4 and 179,649/437 = 411.1) for converting the number of British beetle species currently described into a global estimate (under certain assumptions, as discussed below). If we assume that the 4,069 described British beetle species (14) represent the complete fauna, then using these British-to-global multiplication factors for the years 1762 and 1758, we estimate that there are 1.7–2.1 million beetle species globally (4,069 × 411.1 = 1.7 million and 4,069 × 510.4 = 2.1 million). The negative relationship between body size and year of description (r = ‒0.404, n = 3,637, P < 0.001) found by Gaston (11) we retested with a more complete and up-to-date British beetle database and, as Gaston had previously shown, adding the newer recent species reduces the slope (r = ‒0.370, n = 4,069, P < 0.001). We also found a weak negative relationship between body size and year for a sample of NHM beetles (r = ‒0.150, n = 917, P < 0.001). Therefore, this suggests that the tendency for larger species to be described before smaller species possibly may be a widespread phenomenon.
Fig. 1.

Cumulative loge mean [with 95% confidence interval (CI)] of British beetle body size for each year from 1758 to 2014, and for mean body size (with 95% CI) for a sample of beetles from the Natural History Museum, London (ALL). Note that the horizontal axis is arbitrary for ALL but that the dotted horizontal lines indicate where the 95% CIs intercept the years for the British data (see also Fig. S1).
Fig. S1.

Cumulative loge mean (with 95% CI) of British beetle body size against cumulative beetle species number. The data points are the same yearly values plotted in Fig. 1 but with the x axis scaled to the cumulative number of described species instead of time. ALL indicates mean body size (with 95% CI) for samples from the Natural History Museum, London, of all beetles; note that the horizontal axis is arbitrary for ALL but that the horizontal lines indicate where the 95% CIs intercept the accumulative number of species for the British data.
To examine how global species estimates have changed over time, we present mean estimates of global species richness for three time periods, 1980–1989, 1990–2000, and 2001–present for beetles, insects, and terrestrial arthropods, giving equal weight to the eight methods (Table 2). Each method has its own differently calculated measures of uncertainty and, therefore, rather than providing SEs for the means for each period, we have chosen to provide the upper and lower estimates as a measure of the variation.
Table 2.
Calculations of means of global species richness for each taxon are based on those estimates from Table 1 in three time periods: 1980–1989, 1990–2000, and 2001–present
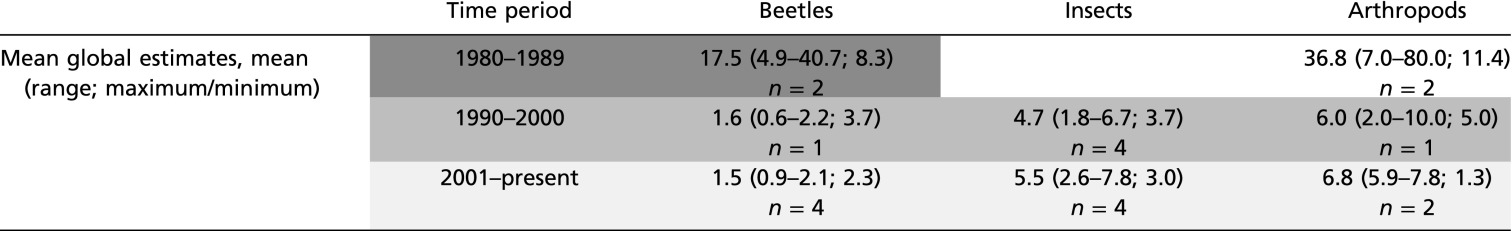 |
These means represent the means of estimates made in individual studies, with some of these estimates being point estimates and others being measures of central tendency for probability distributions (e.g., medians). Confidence intervals for probabilistic estimates are not used here. n, number of studies.
Discussion
We have made several assumptions that require further explanation in our new method of estimating global species richness from the body sizes of British beetles and those in the NHM (method 8). We have assumed that British beetles are representative of beetles worldwide both in terms of their taxonomic composition and body-size distribution and offer two sets of evidence that support this. First, Spearman’s rank correlations of the number of species in different families of beetles sampled from trees from the Palearctic, Southeast Asian, Central American, and Australian biogeographic regions suggest that the beetle faunas of these regions are similarly structured taxonomically (ρ = 0.44–0.71 across the pairwise correlations, with all correlations being highly significant, P < 0.001) (25). This reflects the fact that beetles are a relatively old group, with most families appearing in the geological record before the breakup of Gondwana (26). Second, at the regional scale, faunal species richness of the United Kingdom appears to be similar to that of other Western European countries of a similar size and latitude (Fig. S2). We have also assumed that the cataloguing of British beetles is near-complete. Addition of species to the British list will therefore increase estimates of global beetle species. Our assumption that the body size of British beetles reflects that of the rest of the world remains to be tested. Body-size variation in insects, particularly interspecific variation with temperature and nutrition, has received considerable attention (27), but evidence on how the size distributions of assemblages change with latitude is inconclusive (28–30). Although Bergmann’s rule for endotherms suggests that species are larger toward the poles, there is insufficient evidence to suggest that the same is true for insects (31).
Fig. S2.

Data on the number of animal species in different countries of Western Europe were downloaded from the Fauna Europaea website (www.faunaeur.org) and are plotted against the area of the countries concerned (BE, Belgium; CZ, Czech Republic; DE, Denmark; FI, Finland; FR, France; GE, Germany; GR, Greece; HU, Hungary; IR, Ireland; IT, Italy; NE, The Netherlands; NO, Norway; PO, Poland; PT, Portugal; SL, Slovakia; SP, Spain; SU, Switzerland; SW, Sweden; UK, United Kingdom). There is a significant linear relationship between area and the number of species (P = 0.008). Generally, higher-latitude countries are below the line and lower-latitude countries are above the regression line, likely reflecting the influence of climate on number of species. The data point for the United Kingdom is close to the regression line, suggesting that the size of the UK/British fauna is typical of a midsized and midlatitude Western European country.
This is not the first time that the body sizes of organisms and the observation that larger species are described first have been used to estimate global species richness. Although cautioning against the idea, May (5) noted that in a log–log plot of the body sizes of all organisms a straight line might be plotted backward from the larger size classes to extrapolate the number of species on Earth. Plotting back to a minimum body size of 0.2 mm (6) and 0.1 mm (32) gives estimates of roughly 10 million species and 20 million species, respectively. Testing this model would require complete biotas of parts of the world to be measured and identified to species.
The suggestion that current global species estimates for all organisms are converging (12) around 5 ± 3 million species has been challenged (13). However, our findings lend support to this claim if insects and terrestrial arthropods are seen to be the largest contributors of species. Ranges of estimates for both groups have reduced considerably since the 1980s (Table 2). Our figures for the number of all beetle species from our mean body size and year of description method compare well with those from other methods (Table 1), with a mean of 1.5 million species.
In compiling our list of methods and estimates in Table 1, we chose to include only those with a clear methodology and testable hypotheses and not to include others, which are effectively guesses (7, 9, 33) and cannot be tested further. In this context, although some consider that estimates based on surveys of taxonomists (34) are “unscientific,” we find it remarkable that the estimate of 5 million insect species made in this way is so close to our new average for insects. Sophisticated statistical methods exist for eliciting expert opinion, and new estimates derived this way on the diversity of life on coral reefs (35) suggest this may be a fruitful area for further exploration. Two other recent methods that have clear methodologies deserve some scrutiny. Costello et al. (36) used description-rate models to estimate that there may be only 1.6–1.7 million terrestrial species on Earth, which is of the same order as what we suggest here for beetles alone. They provide no estimates for the three taxa we discuss here, but many of the invertebrate groups where they do have estimates (butterflies, moths, crickets, scarab beetles, wasps, and dragonflies) are generally larger organisms and are well-studied. Not surprisingly, the estimates for how many undescribed species there may be for these groups are low. It may well be that their sample of described species is biased toward better-known groups with larger individuals of more completely described faunas and floras, hence resulting in low estimates for global species richness. Mora et al. (37) observed consistent patterns in the numbers of higher taxa, which increased predictably from phyla through to genera. Supposing that the number of species per genus is constant globally—an assumption for which there are no theoretical grounds (38)—they then extrapolated to the species level to predict that there are 8.7 million (±1.3 million SE) species of all eukaryotes on Earth, with about 75% being terrestrial. This approach makes the assumption that the pattern observed across higher taxa can be extended to species, but it is important to note that taxonomic divisions above the species level are arbitrary human constructs, and this stands in stark contrast to the species concept, which, although the details are debated (39), ultimately reflects biological concepts. It may very well be that the patterns observed in the higher taxa reflect little more than human tendencies for grouping and that these patterns should not be extended to the lowest taxon, which is arguably much less arbitrary and more biological in nature.
The question of how many species exist is complicated by the possibility of cryptic species, with many new species being revealed only through genetic analysis (40). Although molecular methods are at the forefront of resolving the problem of cryptic species, recognizing synonyms where species are accidentally described more than once is also a problem in all groups and arguably has the potential to inflate estimates considerably, especially for insects (12). The net effect or balance of such considerations is far from being resolved.
All methods of estimating global species richness have their weaknesses, most because they are based on assumptions that often have not been sufficiently tested. However, we are encouraged by the fact that the estimates from the different methods we have shown here are surprisingly similar and that their range has reduced down to a factor of 2–3 compared with as much as a factor of 10 in the 1980s and 1990s. Because there are currently so few methods to estimate how many species we share the planet with (36, 37), we believe that our body size and year of description method is an important discovery that can be tested further. Finally, why there are so many species of beetles, aside from the Creator’s obvious predilection for them, appears to reflect the Jurassic origin of numerous modern lineages, high lineage survival, and diversification into a wide range of niches, including the utilization of all parts of plants (26, 41).
Supplementary Material
Acknowledgments
We thank the Natural History Museum and their curators Max Barclay, Malcolm Kerley, Roger Booth, Beulah Garner, Lucia Chmurova, Lydia Smith, and Chris Lyal for their assistance in accessing the collections and databases. We thank Max Barclay for the current numbers of species in the NHM collection, Andrew Duff for his assistance with the checklist of British beetles, Camilo Mora for his estimates of insect species richness, and Susan Stork for assistance with databasing beetles at the NHM. We also thank Robert Colwell, Mark Costello, Lian Pin Koh, and Xingli Giam for their comments on the manuscript. N.E.S. acknowledges support from the Australian Research Council (DP140101541).
Footnotes
The authors declare no conflict of interest.
This article is a PNAS Direct Submission.
This article contains supporting information online at www.pnas.org/lookup/suppl/doi:10.1073/pnas.1502408112/-/DCSupplemental.
References
- 1.Hammond PM. Species inventory. In: Groombridge B, editor. Global Biodiversity. Status of the Earth’s Living Resources. A Report Compiled by the World Conservation Monitoring Centre. Chapman and Hall; London: 1992. pp. 17–39. [Google Scholar]
- 2.Evans G. The Life of Beetles. George Allen & Unwin; London: 1975. [Google Scholar]
- 3.Hutchinson GE. Homage to Santa Rosalia or why are there so many kinds of animals? Am Nat. 1959;93(870):145–159. [Google Scholar]
- 4.May RM. How many species are there? Nature. 1986;324:514–515. doi: 10.1038/324514a0. [DOI] [PubMed] [Google Scholar]
- 5.May RM. How many species are there on Earth? Science. 1988;241(4872):1441–1449. doi: 10.1126/science.241.4872.1441. [DOI] [PubMed] [Google Scholar]
- 6.May RM, Beverton RJH. How many species? [and discussion] Philos Trans R Soc Lond B Biol Sci. 1990;330(1257):293–304. [Google Scholar]
- 7.Hammond PM. The current magnitude of biodiversity. In: Heywood VH, editor. Global Biodiversity Assessment. Cambridge Univ Press; Cambridge, UK: 1995. pp. 113–138. [Google Scholar]
- 8.Stork NE. Insect diversity: Facts, fiction and speculation. Biol J Linn Soc Lond. 1988;35(4):321–337. [Google Scholar]
- 9.Stork NE. How many species are there? Biodivers Conserv. 1993;2(3):215–232. [Google Scholar]
- 10.Gaston KJ. Body size and probability of description: The beetle fauna of Britain. Ecol Entomol. 1991;16(4):505–508. [Google Scholar]
- 11.Gaston KJ, Blackburn TM, Loder N. Which species are described first?: The case of North American butterflies. Biodivers Conserv. 1995;4(2):119–127. [Google Scholar]
- 12.Costello MJ, May RM, Stork NE. Can we name Earth’s species before they go extinct? Science. 2013;339(6118):413–416. doi: 10.1126/science.1230318. [DOI] [PubMed] [Google Scholar]
- 13.Caley MJ, Fisher R, Mengersen K. Global species richness estimates have not converged. Trends Ecol Evol. 2014;29(4):187–188. doi: 10.1016/j.tree.2014.02.002. [DOI] [PubMed] [Google Scholar]
- 14.Duff A, Lott DA, Buckland PC. 2012. Checklist of Beetles of the British Isles (Pemberley Books, Iver, UK)
- 15.Joy NH. A Practical Handbook of British Beetles. H.F. & G. Witherby; London: 1932. [Google Scholar]
- 16.Speight M, Martinez M, Luff M. The Asaphidion (Col.: Carabidae) species occurring in Great Britain and Ireland. Proc Trans Br Entomol Nat Hist Soc. 1986;19:17–21. [Google Scholar]
- 17.Erwin TL. Tropical forests: Their richness in Coleoptera and other arthropod species. Coleopt Bull. 1982;36(1):74–75. [Google Scholar]
- 18.Ødegaard F. How many species of arthropods? Erwin’s estimate revised. Biol J Linn Soc Lond. 2000;71(4):583–597. [Google Scholar]
- 19.Hamilton AJ, et al. Quantifying uncertainty in estimation of tropical arthropod species richness. Am Nat. 2010;176(1):90–95. doi: 10.1086/652998. [DOI] [PubMed] [Google Scholar]
- 20.Hamilton AJ, et al. Estimating global arthropod species richness: Refining probabilistic models using probability bounds analysis. Oecologia. 2013;171(2):357–365. doi: 10.1007/s00442-012-2434-5. [DOI] [PubMed] [Google Scholar]
- 21.Stork NE, Gaston KJ. Counting species one by one. New Sci. 1990;1729:43–47. [Google Scholar]
- 22.Barnard PC. The Royal Entomological Society Book of British Insects. John Wiley & Sons, Wiley–Blackwell; Oxford: 2011. [Google Scholar]
- 23.Joppa LN, Roberts DL, Myers N, Pimm SL. Biodiversity hotspots house most undiscovered plant species. Proc Natl Acad Sci USA. 2011;108(32):13171–13176. doi: 10.1073/pnas.1109389108. [DOI] [PMC free article] [PubMed] [Google Scholar]
- 24.Marske KA, Ivie MA. Beetle fauna of the United States and Canada. Coleopt Bull. 2003;57(4):495–503. [Google Scholar]
- 25.Hammond PM, Kitching RL, Stork NE. The composition and richness of the tree-crown Coleoptera assemblage in an Australian subtropical forest. Ecotropica. 1996;2:99–108. [Google Scholar]
- 26.Hunt T, et al. A comprehensive phylogeny of beetles reveals the evolutionary origins of a superradiation. Science. 2007;318(5858):1913–1916. doi: 10.1126/science.1146954. [DOI] [PubMed] [Google Scholar]
- 27.Chown SL, Gaston KJ. Body size variation in insects: A macroecological perspective. Biol Rev Camb Philos Soc. 2010;85(1):139–169. doi: 10.1111/j.1469-185X.2009.00097.x. [DOI] [PubMed] [Google Scholar]
- 28.Moreeteau B, et al. Morphometrical evolution in a Drosophila clade: The Drosophila obscura group. J Zoolog Syst Evol Res. 2003;41(1):64–71. [Google Scholar]
- 29.Barlow ND. Size distributions of butterfly species and the effect of latitude on species sizes. Oikos. 1994;71(2):326–332. [Google Scholar]
- 30.Hawkins BA, Lawton JH. Latitudinal gradients in butterfly body sizes: Is there a general pattern? Oecologia. 1995;102(1):31–36. doi: 10.1007/BF00333307. [DOI] [PubMed] [Google Scholar]
- 31.Loder N. 1997. Insect species body size distributions. PhD dissertation (University of Sheffield, Sheffield, UK)
- 32.André HM, Noti MI, Lebrun P. The soil fauna: The other last biotic frontier. Biodivers Conserv. 1994;3(1):45–56. [Google Scholar]
- 33.May RM. Science and society. Science. 2001;292(5519):1021. doi: 10.1126/science.292.5519.1021. [DOI] [PubMed] [Google Scholar]
- 34.Gaston KJ. The magnitude of global insect species richness. Conserv Biol. 1991;5(3):283–296. [Google Scholar]
- 35.Fisher R, et al. Species richness on coral reefs and the pursuit of convergent global estimates. Curr Biol. 2015;25(4):500–505. doi: 10.1016/j.cub.2014.12.022. [DOI] [PubMed] [Google Scholar]
- 36.Costello MJ, Wilson S, Houlding B. Predicting total global species richness using rates of species description and estimates of taxonomic effort. Syst Biol. 2012;61(5):871–883. doi: 10.1093/sysbio/syr080. [DOI] [PubMed] [Google Scholar]
- 37.Mora C, Tittensor DP, Adl S, Simpson AGB, Worm B. How many species are there on Earth and in the ocean? PLoS Biol. 2011;9(8):e1001127. doi: 10.1371/journal.pbio.1001127. [DOI] [PMC free article] [PubMed] [Google Scholar]
- 38.Scheffers BR, Joppa LN, Pimm SL, Laurance WF. What we know and don’t know about Earth’s missing biodiversity. Trends Ecol Evol. 2012;27(9):501–510. doi: 10.1016/j.tree.2012.05.008. [DOI] [PubMed] [Google Scholar]
- 39.de Queiroz K. Ernst Mayr and the modern concept of species. Proc Natl Acad Sci USA. 2005;102(Suppl 1):6600–6607. doi: 10.1073/pnas.0502030102. [DOI] [PMC free article] [PubMed] [Google Scholar]
- 40.Hebert PDN, Penton EH, Burns JM, Janzen DH, Hallwachs W. Ten species in one: DNA barcoding reveals cryptic species in the neotropical skipper butterfly Astraptes fulgerator. Proc Natl Acad Sci USA. 2004;101(41):14812–14817. doi: 10.1073/pnas.0406166101. [DOI] [PMC free article] [PubMed] [Google Scholar]
- 41.Farrell BD. 1998. “Inordinate fondness” explained: Why are there so many beetles? Science 281(24):555–559.
- 42.Westwood J. On the probable number of species of insects in the creation; together with descriptions of several minute Hymenoptera. The Magazine of Natural History & Journal of Zoology, Botany, Mineralogy, Geology, and Meteorology. 1833;6:116–123. [Google Scholar]
- 43.Hodkinson ID, Casson D. A lesser predilection for bugs: Hemiptera (Insecta) diversity in tropical forests. Biological Journal of the Linnean Society. 1991;43:101–109. [Google Scholar]
- 44.Hamilton AJ, et al. Correction. Am Nat. 2011;177(4):544–545. [Google Scholar]