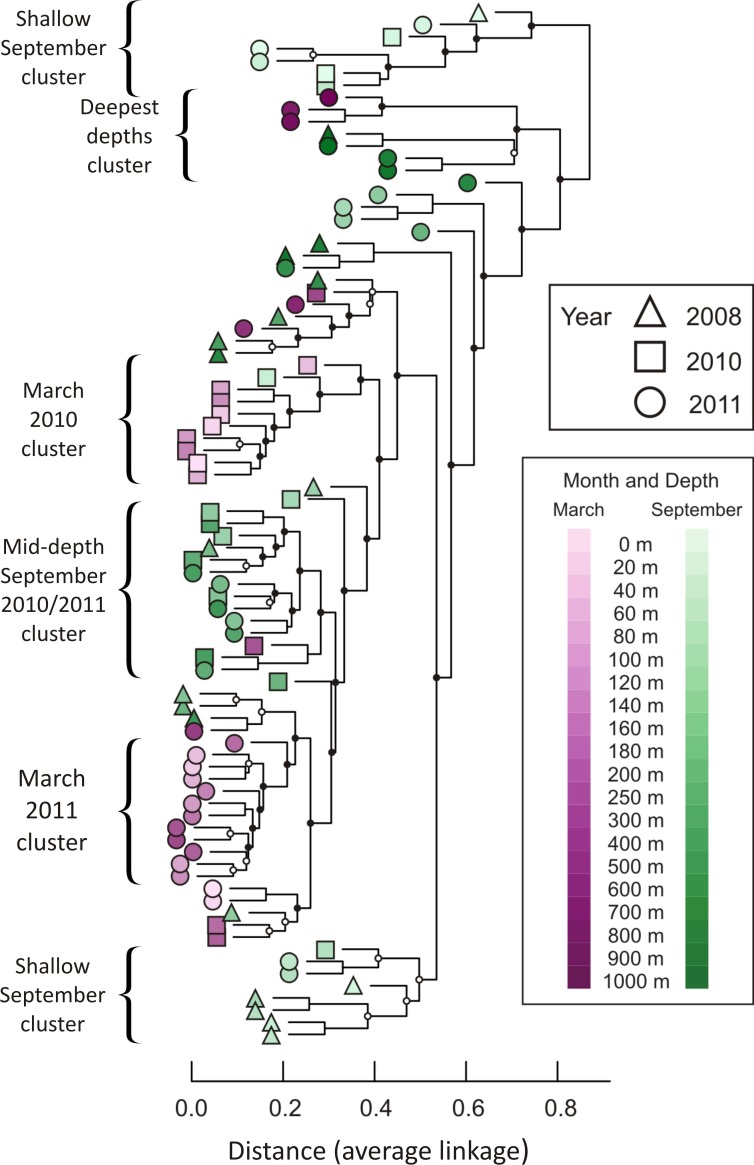
Figure 3. Dendrogram illustrating hierarchical clustering of all 85 depths/times.
Samples are clustered using a Bray-Curtis dissimilarity matrix for all 3,619 OTUs. Nodes marked with a filled circle have a Jaccard stability mean greater than 75; nodes marked with an open circle have a Jaccard stability mean from 60 to 75 (Hennig, 2007; Hennig, 2008). Unmarked nodes have a Jaccard stability mean below 60.

