

Abstract
Early blindness results in occipital cortex neurons responding to a wide range of auditory and tactile stimuli. These changes in tuning properties are accompanied by an extensive reorganization of occipital cortex that includes alterations in anatomical structure, neurochemical and metabolic pathways. Although it has been established in animal models that neurochemical pathways are heavily affected by early visual deprivation, the effects of blindness on these pathways in humans is still not well characterized. Here, using 1H magnetic resonance spectroscopy in nine early blind and normally sighted subjects, we find that early blindness is associated with higher levels of creatine, choline and myo-Inositol and indications of lower levels of GABA within occipital cortex. These results suggest that the cross-modal responses associated with early blindness may, at least in part, be driven by changes within occipital biochemical pathways.
Introduction
Since the 1960's early blindness from peripheral causes has been a useful model system for understanding developmental plasticity (Wiesel and Hubel, 1965a, b). In animal models, early blindness is associated with dramatic changes in the functional responses of occipital neurons (Movshon and Van Sluyters, 1981, Fregnac and Imbert, 1984, Benevento et al., 1992) that includes enhanced responses to auditory and tactile stimuli – known as `cross-modal plasticity' -within visual cortex (Rauschecker et al., 1992, Kahn and Krubitzer, 2002). Similar enhancements of cross-modal responses (for reviews see Noppeney, 2007, Collignon et al., 2008) and higher levels of functional connectivity with auditory (Klinge et al., 2010), tactile (Fujii et al., 2009) and lateral prefrontal (Bedny et al., 2010) cortex have also been found within human occipital cortex within individuals who become blind early in life.
However it is remains unclear how the `cross-modal' changes in functional responsiveness that occur in early blind individuals are mediated. One hypothesis is that these responses are due to stronger and/or novel white matter connections to other areas, perhaps due to a lack of pruning (Bourgeois et al., 1989). However, while white matter hypertrophy has been found within prefrontal areas (Lepore et al., 2010) within early blind individuals, white matter connections between V1 and other pre-cortical and cortical areas (including prefrontal cortex) have so far been shown to be unaffected or attenuated by blindness (Shimony et al., 2006, Bridge et al., 2009, Shu et al., 2009, Lepore et al., 2010).
Another, non-exclusive, possibility is that the changes in functional response that have been found in early blind individuals are driven by changes within inhibitory, excitatory and neuromodulatory biochemical pathways within occipital cortex itself. As detailed in the Discussion, inhibitory GABAergic, excitatory glutamatergic, and neuromodulatory cholinergic biochemical pathways affect short-term tuning and responses in heterogeneous ways, as well as influencing both developmental and adult plasticity (for review see Hensch, 2005, Bavelier et al., 2010). Within animal models it has been established that these pathways are heavily affected by early visual deprivation. However, little is known about changes in biochemical pathways as a result of early blindness in humans. Here, we used 1H MRS to examine the effects of early blindness on occipital metabolite concentrations. MRS concentrations of choline (a peak containing multiple choline containing compounds), creatine (a peak containing both creatine and phosphocreatine), myo-Inositol, N-acetyl aspartate (NAA), GABA and glutamate were compared across nine early blind and nine individually gender and age-matched sighted control subjects.
Experimental Procedures
Participants
Data shown here are from nine early blind (EB; mean age, 52.8, range, 40–69) and nine individually gender and age-matched sighted control (SC; mean age 52.3, range, 44–61) subjects. We scanned 10 blind and 10 sighted subjects. One blind individual (and their matched sighted control) was excluded from main analyses due to significant head motion in all scans (data was used from the sighted control for test-retest validation measures). EB was defined as an age of blindness onset of less than 1 year and no memory of vision. All EB individuals were blind due to peripheral rather than cortical damage (see Table 1), and were excluded if they had light perception that included form, color or object perception. All procedures were in agreement with the Institutional Review board regulations of the University of Washington.
Table 1.
Details of subjects (acuity is reported for the better eye; NLP – no light perception; LP – light perception; low LP implies no color, motion, or form perception; ROP – retinopathy of prematurity). EB – Early blind, SC – Sighted control._All individuals were free of co-morbid neurological and psychiatric concerns, heavy alcohol use and prescription/non-prescription drug use (self-report).
| Subject | Gender | Age | Handedness | Age of Onset | Cause of Blindness | Prematurity | Visual acuity (best eye) | Braille wpm | Braille reading hand |
|---|---|---|---|---|---|---|---|---|---|
| EB01 | F | 56 | L | 1.5 | Virus damaged optic nerve in both eyes | At term | Low LP | >300 | Reads L |
| SC01 | F | 53 | L | ||||||
| EB02 | M | 40 | R | 0 | Congenital cataracts | At term | NLP | 120–150 | Reads L guides R |
| SC02 | M | 44 | L | ||||||
| EB03 | M | 56 | L | 0 | ROP | 2 mo. | NLP | 400–500 | Reads L |
| SC03 | M | 55 | L | ||||||
| EB04 | M | 57 | R | 0 | ROP | 2 mo. | Low LP | 150 | Reads L index |
| SC04 | M | 58 | R | ||||||
| EB05 | M | 44 | R | MinimalLP until 6–7 | Congenital glaucoma | At term | Low LP | 137 | Reads R index |
| SC05 | M | 47 | R | ||||||
| EB06 | F | 49 | R | MinimalLP until 25–30 when retina detached | ROP | < 1 mo. | NLP | 110 | Reads R index, guides L index |
| SC06 | F | 51 | R | ||||||
| EB07 | M | 56 | R | 0 | ROP | 2 mo. | NLP | 225 | Reads L & R |
| SC07 | M | 48 | R | ||||||
| EB08 | M | 57 | R | MrnimalLP, gradually deteriorated, NLP @ 25–30 | ROP/congenital glaucoma | 2 mo. | NLP | 120 | Reads R index |
| SC08 | M | 61 | L | ||||||
| EB09 | F | 60 | Amb | MinimalLP in left eye only until 5 | Ruptured RE, detached retina @ 5 mo. Glaucoma secondary to surgery | At term | NLP | >300 | Reads L & R |
| SC09 | F | 54 | R |
Magnetic Resonance Spectroscopy
Data were acquired using the Philips Achieva 3T scanner (version 2.5.3) and an 8-channel SENSE Philips head coil. Spectra were acquired from each of two voxels placed along the left and right medial occipital wall, centered on the calcarine sulcus, and one control voxel placed in the frontal lobe, anterior to the central sulcus, Fig. 1A. Because cross-modal plasticity within early blind individuals is found across wide regions of occipital cortex e.g. (Sadato et al., 1998, Burton et al., 2002, Burton, 2003) large voxel sizes were used to maximize signal to noise. The occipital voxel was positioned to cover much of V1 and V2 (primary visual areas) and may have included parts of additional visual areas (V3–V4) in some subjects (Van Essen et al., 2005). In visually normal subjects these areas are primarily visual and demonstrate novel responses to a variety of auditory and tactile tasks in early blind individuals (Lewis and Fine, 2011). The precentral gyrus voxel was primarily centered on motor areas, but likely included motor planning, supplementary motor and somatosensory areas in some subjects (Van Essen et al., 2005).
Figure 1.

(A) The locations of the three MRS voxels shown in a representative early blind individual. A high resolution T1 weighted anatomical scan (MPRAGE: TR = 7 ms; TE = 3.20 ms; flip angle = 8°; matrix size 240×240; 160 sagittal slices; slice thickness = 1 mm) was collected at the beginning of each session to guide voxel placement for the MRS sequences. 3×2×3 cm voxels were placed within visual cortex, along the left and right occipital wall centered around the calcarine sulcus and within a control frontal lobe region, anterior to the central sulcus and superior to the corpus callosum. Care was taken to ensure that voxels did not overlap with the pial surface as to avoid lipid contamination. (B) The short echo (TE =32 ms) spectrum, after model fitting and quantification procedures, showing the locations of several hydrogen MRS peaks: myo-Inositol (mI), choline (Cho), creatine (Cr) and N-acetyl aspartate (NAA). The smooth line below the spectrum is the LCmodel computed spectral baseline (subtracted from the resonance area under the curve when calculating chemical concentrations). (C) The long echo (TE=87ms) spectrum used to quantify GABA and glutamate. Longer echo times allow for the isolation of the glutamate peak due to dephasing of the glutamine signal at this echo time (Puts et al., 2012). The smooth line below the spectrum is the LCmodel computed spectral baseline. (D) The GABA peak was isolated with a frequency-selective saturation MEGAPRESS technique with subtraction across the two different frequency positions of the editing pulse. The thicker line shows the spectrum with the editing pulse positioned at 1.9 ppm with both creatine and choline visible. The thinner line shows the MEGAPRESS spectrum after subtraction of the two editing pulses (7.5 − 1.9 ppm), with GABA visible at 2.95 p.p.m.
A short echo PRESS sequence (TR = 2000 ms; TE = 32 ms, FID points = 2048; spectral width = 2000Hz; voxel size = 3×2×3 cm; number of averages = 64) allowed for the absolute quantification of the hydrogen spectrum including the resonances associated with N-acetyl Asparatate, choline, creatine and myo-Inositol, Fig. 1B.
A long echo J-Coupled MegaPress sequence (TR = 1500 ms; TE = 87 ms, FID points = 2048; spectral width = 2000Hz; voxel size = 3×2×3 cm; number of averages = 200) was used to isolate GABA and glutamate (Mescher et al., 1998, Mullins et al., 2012). The MegaPress acquisition consists of two parts: edit-on where GABA is refocused using an editing pulse of 15ms duration at 1.9 ppm, and edit-off where the editing pulse is moved on the other side of water. Glutamine dephasing during the edit-off part of the acquisition allows for the isolation of glutamate, Fig. 1C (Schubert et al., 2004). Edit-on and edit-off measurements were conducted in blocks of 200 averages, one after the other.
SC participants were instructed to keep their eyes closed during the scanning sessions. Although this was not specifically monitored, it is unlikely that eye opening during scanning would measurably alter concentration values (Mangia et al., 2006, Mangia et al., 2007).
Analyses
For most metabolites (with the exception of GABA) basis sets, spectra fits and absolute quantification were conducted offline using LCModel software, which analyzes an in vivo spectrum as a linear combination of in vitro spectra estimated from individual metabolite solutions (Provencher, 1993, 2000). Using LCmodel, the residual water signal was subtracted, free-induction decays (FIDs) field inhomogeneities and eddy currents were accounted for and free-induction delays were zero- and first-order phase corrected. Absolute concentrations for each metabolite were obtained by scaling the in vivo spectrum to the unsuppressed water peak and are reported in units that approximate millimolar (mM).
FSL tissue segmentation software (FEAT; http://www.fmrib.ox.ac.uk/fsl/feat5/detail.html) was used to classify the contents of each MRS voxel (left and right occipital and frontal lobe control) into three tissue types: grey matter (GM), white matter (WM) and cerebral spinal fluid (CSF) using whole-brain intensity estimates. All metabolite values were normalized to = 100% brain tissue using C=Co × (1/(1-FCSF)), where C=concentration, Co=metabolite concentration, and FCSF=estimated fraction CSF in order to correct for CSF partial volume effects. Voxel reconstructions were made for each individual metabolite to correct for individual chemical shifts.
In the case of GABA, where differences in the acquired spectra provided an edited spectrum, basis sets were generated using a calibrated phantom with known concentrations. Custom software was used to realign (in frequency space, referenced to the choline peak) the long echo pre-subtraction spectra and to correct GABA concentration estimates to take account of residual signals from macromolecules with overlapping spectra. Remaining analyses were carried out using LCModel.
Measures of fit quality
A variety of measures were used to determine spectra quality, including phantom measurements, model fit values and test-retest reliability.
Validation of GABA measurements using an echo time of 87 ms
The 87 ms TE that we used to measure GABA concentrations is longer than the echo time of 68ms that is more commonly used in the literature (Rothman et al., 1993). Recent in vivo and phantom studies (Edden et al., 2012a, Puts et al., 2012) suggest that modulation of the GABA signal drops off fairly slowly as a function of echo time, so an echo time of 87ms does not result in a dramatic drop of signal. It has also been shown that short editing pulses are relatively unselective at 3T, thereby causing non-trivial suppression of the GABA signal. Using a longer TE allowed us to use a longer (more selective) editing pulse, at a relatively small cost in signal to noise within the GABA signal itself (Edden et al., 2012b).
While use of a long TE and longer echo times for measuring GABA has been previously described (Edden et al., 2012b), the use of longer TE/longer editing pulses is still relatively novel and our particular choice of TE and editing pulses (constrained by our scanner) had not yet been validated. We therefore measured our ability to estimate GABA concentrations using an echo time of 87ms in the presence of other metabolites and macromolecules using three brain tissue mimicking head phantoms containing: (1) metabolites NAA, creatine, choline, lactate, glutamate and 5mM GABA in an aqueous solution, (2) these metabolites within a mixture of Difco Bacto agar (Difco Laboratories, Detroit MI) the concentration of which influences the water T2 value, and animal-hide gelatin (Sigma Aldrich: Gelatin from Bovine Skin, 225-bloom) which contributes a protein background spectrum that creates an environment more similar to brain tissue than agar alone, and (3) a phantom identical to 2 but only containing 1mM GABA. These methods were based on (Rice et al., 1998) with the difference that instead of using formaldehyde to provide thermal stability we used a water bath. (There was a possibility that formaldehyde, by cross-linking the proteins, would increase the molecular weight of the macromolecules, which might result in less interference with the GABA signal.) These phantoms demonstrated that the GABA signal at 3.0 ppm was modulated by the editing pulses, and was detectable both with and without macromolecules. However these phantoms did reveal some contribution of neighboring macromolecules with spectra that overlapped the GABA signal.
We estimated and compensated for neighboring macromolecules by comparing spectra from two acquisition sequences. The first was the sequence we used to measure GABA, as described above. The second had a TE of 87ms but used a pulse editing sequence of 1.9ppm and 1.5ppm. Subtraction of these spectra produces a difference spectrum that isolates GABA by minimizing the modulation of macromolecules at 1.7 ppm. Comparison of these two difference spectra provided an estimate of the factor by which the macromolecule signal inflated the GABA signal (.0302) in our original measurements. Correction for each individual subject was then carried out by multiplying their individual concentration of MM17 (the LCmodel defined proportion of the fit that includes macromolecules with peak resonances at 1.7ppm) by this factor and subtracting the resulting estimate of the macromolecule inflation of the GABA signal for that individual subject from his/her uncorrected GABA signal.
Our GABA concentration estimates, made using a TE of 87ms, are somewhat smaller than those of previous studies carried out at 3T using a 68ms TE. For example Yoon et al. (Yoon et al., 2010) reports mean GABA/Creatine ratios of 0.105 and Near et al. (Near et al., 2011) reports mean ratios of 0.093 for occipital cortex in visually normal control subjects, while our GABA/creatine ratio, using an appropriate correction factor (0.85) to take account for our longer TE (Edden et al., 2012a), was 0.087.
Measures of fit
In the case of GABA, custom software was used for realignment of the long echo pre-subtraction spectra and model fitting of the spectroscopic signal. Consequently Cramer-Rao bounds were not available for these spectra and quality was assessed using S/N (the height of the GABA signal compared to the estimated spectral noise amplitude, calculated as the standard deviation of a noise region of the spectrum) and FWHM (full width at half maximum of the GABA spectroscopic signal, which gives a measure of the spectroscopic signal quality based on the magnetic field homogeneity). The mean S/N was 10.7 and the mean FWHM was 0.14.
For the remainder of the metabolites that we measured, an initial quality control was carried out by viewing spectra using in house software. Spectra with very high lipid concentrations (implying inaccurate voxel placement) or extremely broad line widths (implying head motion) were discarded. After analysis, we used three parameters of fit quality from LCModel software: percent standard deviation (Cramer-Rao bound from the LCmodel least squares analysis), full-width at half maximum and the signal to noise ratio (S/N). We used all three outputs as measures of spectra quality (Kanowski et al., 2004). Spectra were considered to be of adequate quality if they had an unsuppressed NAA+ Cramer-Rao bound of less than 20, FWHM of less than 0.05ppm, and S/N estimates greater than 15. Almost all spectra passed both these quality control checks, and those spectra that did not were re-collected in a later scanning session. For the short-echo data that passed quality control measures the Cramer-Rao bound of the NAA+ peak was never above 3% and had a mean of 2.18%.
Test-retest reliability
In a small number of scans (2 blind and 2 sighted subjects: one of these subjects was the 10th sighted subject, excluded from main analyses due to significant head motion in his associated blind subject) signal to noise was low or there were excessive subject head movements during the collection of the control voxel. We brought these subjects back for a second scanning session in which we recollected additional data for the left occipital voxel so as to quantify re-test reliability for metabolite concentration and tissue volume estimates (Fayed et al., 2009, Gasparovic et al., 2011). Repeated estimates were calculated using , where m1 and m2 are measurements taken on the same subjects in separate sessions on different days Test-retest variation was likely to be due to any/all of the following: differences in voxel alignment (voxels were realigned across scanning session by eye, so voxel location differed slightly across sessions), neural and scanner noise, fluctuations in metabolite concentrations and susceptibility of the fitting procedure to these various noise sources. Metabolites measured using the short echo PRESS sequence showed reasonable re-test reliability: N-acetyl aspartate= 4.9%, creatine = 8.1%, choline = 6.6%, and myo-Inositol = 12.9%. Measurements based on the long echo J-Coupled MegaPRESS sequence were less reliable: GABA = 46.2%, glutamate = 42.4%. One reason for this is that GABA and glutamate have low concentrations with associated low signal-to-noise. Moreover, GABA requires subtraction from MEGAPRESS frequency selective on/off pulses.
No differences in fit quality between early blind and sighted subjects
Of the 18 subjects used in the main data set only 3 (2 blind, 1 sighted) out of 108 acquisitions (18 subjects × 3 locations × 2 scan protocols) failed to meet the fit criteria described above, generally due to head motion. These data were recollected for that particular sequence and voxel in a later scanning session.
We explicitly tested for differences in fit quality between early blind and sighted subjects. No differences in S/N or FWHM were found for GABA within any voxel or when data were combined across all voxels treating each voxel as an independent measure (two-sample t-test). Examining the Cramer-Rao bound for short echo metabolites, there was no main effect of group [F(1,240) = 1.79, p=0.18827]. There was a significant interaction between group and chemical [F(4,240) = 7.25, p<0.001]: post-hoc tests based on Tukey's honestly significant difference criterion found that myo-Inositol fits were significantly worse for sighted subjects, likely driven by sighted subjects having significantly lower concentration values for that metabolite. No other group effects were significant.
Results
Because there were no significant differences between left and right hemisphere occipital voxels for either subject group, occipital data were combined across hemispheres (treating each hemisphere as an independent measurement).
Figure 2 shows group median tissue concentrations for sighted control (light gray bars) and early blind subjects (dark gray bars). Because we had repeated measures (Hurlbert, 1984), a nonparametric three way ANOVA (Wobbrock et al., 2011) rather than a Chi-Square test was used to examine whether there were significant differences in tissue type across subject groups. We found a significant main effect of tissue type [F(2,150) = 249.13, p<0.001], but no significant main effect of group [F(1,150) = 0.01, p=0.9243] or voxel location [F(1, 150) = 02, p = 0.8791]. Nor did we see significant interactions between group × location [F(1,150) = 0.01, p=0.9084], group × tissue type [F(2,150) = 1.91, p=0.1518], location × tissue type [F(2,150) = 0.03, p<0.9745] or group × location × tissue type [F(2,150) = 0.54, p=0.584]. Thus, there was no statistical indication of differences in the proportion of gray, white and CSF tissue types within either the MRS occipital or the precentral voxels between sighted and blind subject groups.
Figure 2.
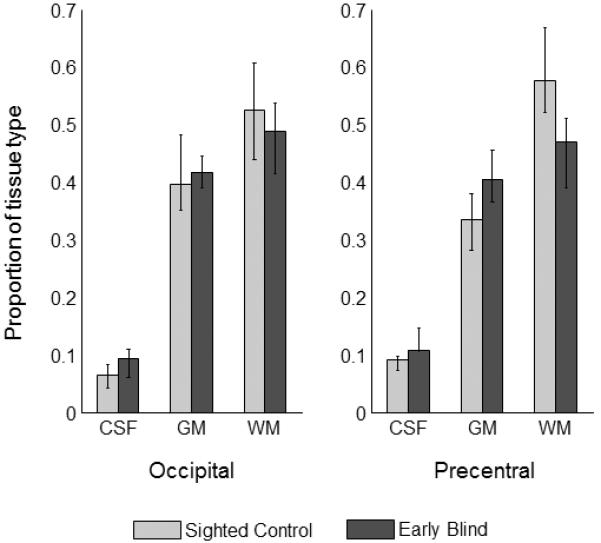
Group median tissue concentrations for sighted control (light gray bars) and early blind subjects (dark gray bars). Error bars represent the 25–75% interquartile range.
Metabolite concentrations are shown in Figure 3 and Table 2. Across all quantified metabolites, a three way ANOVA found a significant main effect of group [F(1,293) = 25.01, p<0.001] and metabolite [F(5, 293) = 2146.91, p < 0.001] with significant interactions between metabolite × voxel location [F(5,293) = 2.57, p<0.05] and metabolite × subject group, [F(5,293) = 7.54, p<0.001]. A non-parametric ANOVA (Wobbrock et al., 2011) produced similar results, though with an additional significant main effect for location.
Figure 3.
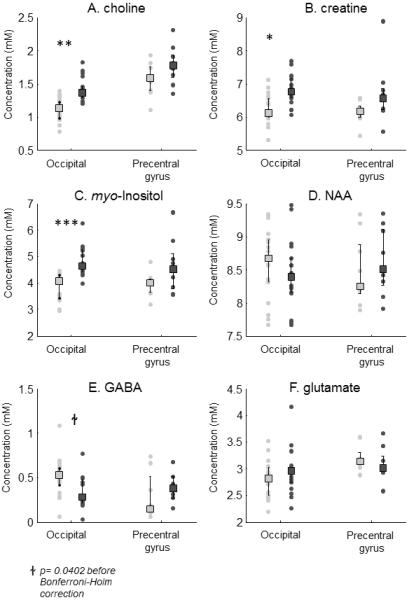
Early visual deprivation has significant effects on choline, creatine and myo-Inositol and GABA concentrations in occipital but not precentral cortex. Absolute concentrations (in millimolar, mM) are shown across left and right occipital voxels and the precentral gyrus for A) choline, B) creatine, C) myo-Inositol, D) NAA. Group median metabolite concentrations are shown for sighted control (light gray bars) and early blind subjects (dark gray bars). Error bars represent the 25–75% interquartile range. * p < 0.05, ** p<0.01, *** p < 0.001 represent group differences using post-hoc Students t-tests corrected for 6 multiple comparisons using the Bonferroni-Holm method.
Table 2.
Early visual deprivation has significant effects on choline, creatine, myo-Inositol and possibly GABA concentrations in occipital but not precentral cortex. Median absolute concentrations (in millimolar, mM) and 25–75% interquartile range are shown for occipital and the precentral gyrus voxels. P-values represent Students t-tests corrected for 6 multiple comparisons using the Bonferroni-Holm method.
| Choline | Creatine | myo-inositol | NAA | GABA | Glutamate | ||||||||
|---|---|---|---|---|---|---|---|---|---|---|---|---|---|
| median | range | median | range | median | range | median | range | median | range | median | range | ||
| Occipital | SC | 1.137 | 0.987–1.229 | 6.113 | 5.994–6.551 | 4.080 | 3.420–4.292 | 8.670 | 8.320–8.959 | 0.532 | 0.417–0.609 | 2.822 | 2.509–3.03 |
| EB | 1.372 | 1.29–1.458 | 6.769 | 6.568–7.153 | 4.649 | 4.43–5.253 | 8.388 | 8.159–8.674 | 0.286 | 0.217–0.483 | 2.959 | 2.738–2.996 | |
| % difference | 18.7% | 10.2% | 13.0% | −3.3% | −60.2% | 4.8% | |||||||
| p | p>0.01 | p<0.05 | p<0.001 | fails B-H correction | |||||||||
| Precentral gyrus | SC | 1.588 | 1.393–1.756 | 6.172 | 5.994–6.309 | 3.997 | 3.646–4.177 | 8.248 | 8.129–8.881 | 0.150 | 0.112–0.508 | 3.140 | 3.075–3.29 |
| EB | 1.770 | 1.591-1.935 | 6.539 | 6.221–6.868 | 4.524 | 3.782–5.089 | 8.511 | 8.267–9.108 | 0.377 | 0.276–0.512 | 3.014 | 2.941–3.227 | |
| % difference | 10.8% | 5.8% | 12.4% | 3.1% | 86.2% | −4.1% | |||||||
| p | |||||||||||||
Traditional paired Student t-test comparisons were then used to examine group differences for each metabolite for occipital and precentral cortex Using uncorrected paired t-tests, early blind subjects showed significantly higher concentrations of choline (p<.01), creatine (p<0.01), myo-Inositol (p<0.001) and significantly lower concentrations of GABA (p<0.05) within occipital cortex. Statistical results after Bonferroni-Holm correction for multiple comparisons are shown in Table 2: The result for GABA failed to pass multiple correction comparison. Very similar results were found using Wilcoxon signed rank parametric statistics. No significant group differences were found within the precentral gyrus control voxel for any metabolite.
Discussion
Because early blind are somewhat difficult to recruit, this study relies on a relatively small number of subjects, and consequently lacks power. However it should be noted that a significant result based on a small sample is no more susceptible to false positives than a study based on a larger sample. Indeed, finding significant effects with a small sample requires a treatment effect that is larger than would be required to reach the same level of significance with a large sample. Our finding of higher levels of creatine, choline and myo-Inositol, and possibly lower levels of GABA in a relatively under-powered study suggest that the effects of blindness on biochemical pathways are relatively large (Friston, 2012).
No difference in white/gray/CSF ratios within our voxel
We saw no significant difference in the proportion of gray, white and CSF tissue between sighted and blind subject groups within either occipital or precentral cortex. This finding means that group differences in metabolites described below are unlikely to be due to macroscopic differences in tissue composition across groups.
Previous studies have shown a smaller volume and greater thickness of gray matter in V1 in early blind subjects (Jiang et al., 2009). However, these anatomical differences are relatively subtle and are localized to V1, which likely explains why we did not see significant differences in the relative ratios of white/gray/CSF within our large fixed-size voxel (which likely included V2 as well as V1, as well as portions of V3–V4).
Higher concentrations of choline
Our finding of higher levels of choline differs from the results found in an animal MRS model of low vision (due to glaucoma) that found a lower choline/creatine ratio (Chan et al., 2009) since we found higher levels for both metabolites that resulted in no significant change in ratio across blind and sighted subjects. This discrepancy may reflect improved measurement sensitivity in our study, differences between early human and adult animal models of visual loss, and/or degeneration specific to a glaucoma model.
In the case of choline, there are multiple contributors to the choline peak of which phospholipids are the main component (Kirkwood et al., 1999, Boulanger et al., 2000). In disease states higher levels of choline is generally interpreted as being a marker for membrane breakdown and/or an increase in phospholipid membrane precursors (Gujar et al., 2005). However, such membrane turnover in adulthood is generally due to pathology (Sabatier et al., 1999, Cordoba et al., 2002). We are not aware of any papers examining membrane turnover or synthesis in animal models of blindness.
Elevated levels of creatine
We see significantly higher levels of creatine in early blind individuals. The 1H MRS creatine peak contains both creatine and phosphocreatine, metabolites intimately involved with energy usage within both neurons and glia: by acting as an ATP buffer, the reversible phosphorylation of creatine allows for the relatively continuous access to ATP needed for moment-to-moment energy requirements (Gujar et al., 2005). Previous PET studies have demonstrated that while early blind subjects exhibit roughly similar oxygen-to-glucose metabolic ratios as sighted subjects (De Volder et al., 1997), primary and extrastriate visual cortical areas exhibit greater levels of glucose metabolism and regional cerebral blood flow than sighted subjects during (silent) rest as well as when performing an auditory or tactile task (Wanet-Defalque et al., 1988, Veraart et al., 1990, Uhl et al., 1993, De Volder et al., 1997). These previous PET results might have been due to either ongoing differences in neural activity or long-term changes in metabolism. In contrast, our results are unlikely to be due to higher resting firing states or responses to acoustic scanner noise: intensive visual stimulation in the normally sighted barely alters the concentrations (Mangia et al., 2006) and has no effect on the creatine/NAA ratio (Mangia et al., 2007). Thus, as described below, our results are likely to reflect chronic metabolic adaptations.
Higher concentrations of myo-Inositol
Our findings of higher concentrations of myo-Inositol are consistent with those of Bernabeu et al. who found higher levels of myo-Inositol in late blind subjects with no or limited light perception (Bernabeu et al., 2009). Myo-Inositol (the most common biological stereoisomer of inositol) is synthesized mainly within astrocytes, and heightened concentrations are generally interpreted as indicating increased glial number or size (Pellerin, 2005, Soares and Law, 2009).
No significant differences in N-acetyl aspartate concentrations
We find no significant differences between blind and sighted subjects for N-acetyl aspartate. It has been suggested that blind individuals have thicker gray matter within V1 (Jiang, 2009 #5589, though see Rakic et al., 1991, Dehay et al., 1996). However it is not clear that NAA would be sensitive to such a difference; lower N-acetyl aspartate concentrations is generally considered as an indicator of neuronal loss or dysfunction (Rossner et al., 1994, Gujar et al., 2005), however its decrease is mostly observed at the moment when the disease/cell loss is in progression. Results across all metabolites did not differ qualitatively, or in statistical significance when referenced to NAA as compared to the unsuppressed water signal, as might be the case if differences between blind and sighted individuals were driven by differences in cell numbers.
Marginally significant lower concentrations of GABA
Two previous studies (containing 5 & 6 blind subjects respectively) failed to find reductions in GABAA receptors in humans using PET (Sanabria-Bohorquez et al., 2001, Mishina et al., 2003). In contrast, we found indications of lower concentrations of GABA in our early blind subjects. The poor reliability of our GABA measurements, and the fact that our findings did not pass post-hoc Bonferroni-Holm correction means that this result remains provisional. However, it should be noted that the effect of high variance in a sample is to decrease power (increase the likelihood of false-negatives) rather than to increase the likelihood of false-positives because outlier values tend increase to sample error variance more than the sample mean (Zimmerman, 1994).
One possible explanation for this discrepancy is that these previous PET studies compared responses across smaller regions of interest, and some subjects reported being deprived of form vision during early childhood rather than infancy. A second difference is that we measured a marker for the presence of the GABA molecule, whereas previous PET studies measured the synaptic density of benzodiazepine receptors.
Our finding suggesting potentially lower levels of GABA is also consistent with a large animal literature (including primate) which shows a down-regulation of the GABAergic network consequent on bilateral and unilateral deprivation that include effects on GABAA, GABAB and receptor distribution (Hendry and Jones, 1986, Fosse et al., 1989, Benevento et al., 1995, Tigges et al., 1997, Morales et al., 2002, Jones, 1994 #5126, for a review see Desgent and Ptito, 2012).
No significant differences in glutamate concentrations
The most likely reason for our failure to find significant changes in glutamate was high variability in our measurements, as estimated by test-retest reliability. Animal models suggest that the organization of glutamatergic pathways is strongly affected by visual deprivation (Bear and Singer, 1986, McCoy et al., 2009), with effects of deprivation differing widely across receptor type. In some receptors (e.g. the NR2A subunit of the NMDA receptor) visual deprivation results in a decrease in expression, while other receptors (e.g. NR2B and AMPA) show increased expression (Gu, 2002). However, it is worth noting that a small study in dark-reared kittens show similar glutamate concentrations as normally reared animals (as measured using uptake of D-aspartate, Fosse et al., 1989), suggesting that while individual receptor types are heavily affected by deprivation the effect of blindness on overall glutamate levels may be less dramatic.
Potential interpretations
These results suggest fundamental changes to occipital biochemical pathways as a result of blindness. Our finding of differences across markers associated with a variety of pathways make a number of non-exclusive interpretations possible, and suggest a number of interesting avenues for future research.
Increased glial cell numbers
Higher glial cell numbers in early blind individuals would be consistent with our observed higher concentration levels of myo-Inositol, choline and creatine, and can therefore provide a parsimonious explanation for several of our findings. While a variety of studies of dark-rearing show a decrease in the astrocyte population in dark-reared animals (Gabbott et al., 1986, Argandona et al., 2003) these effects are thought to be predominantly due to the impoverishment of a dark-rearing environment. Indeed, adult rats dark-reared from birth through adulthood in a highly enriched environment that included exercise show higher levels of astrocytes than control animals in a standard environment (Argandona et al., 2009). This suggests the intriguing possibility that meeting the challenge of becoming highly independent and proficient at the use of auditory and tactile cross-modal technologies (as was the case for all our subjects) might not merely prevent the decrease in astrocyte levels that is normally seen in dark-reared animals, but might even have an effect analogous to the effects of environmental enrichment, resulting in an increase in the astrocyte population local to occipital cortex.
Altered neural-hemodynamic coupling
The neurochemical differences between blind and sighted subjects described here (higher levels of GABA, lower levels of choline, higher levels of creatine) suggest that it may be unwise to presume that neurovascular coupling is unaltered by early blindness. Blood flow is mediated by GABAergic and cholinergic pathways not only through direct interaction between neurons and vessels but also indirectly via the perivascular astrocytes (Cauli et al., 2004, Hamel, 2006, Donahue et al., 2010, Kleinfeld et al., 2011, Muthukumaraswamy et al., 2012). Our finding of higher levels of creatine, in conjunction with previous PET results showing differences in metabolic activity in early blind subjects, further suggest group differences within metabolic processes themselves. In Alzheimer's disease the importance of considering potential metabolic differences between groups when interpreting BOLD signals has already been demonstrated: disease-related metabolic down-regulation has effects on neurovascular coupling that in turn influences task-related BOLD activity (Herminghaus et al., 2003, Lecrux and Hamel, 2011, Nicolakakis and Hamel, 2011).
The reason for these metabolic changes is not clear, but one possibility is that the higher rates of spontaneous neural firing that have been associated with visual deprivation (Movshon and Van Sluyters, 1981), might lead to long-term compensatory changes in metabolic processing. Consistent with the notion of task demands affecting metabolic demand, cognitive training is associated with (resting state) creatine increases within the hippocampus (Valenzuela et al., 2003).
Upregulation of cholinergic phospholipid pathways
While acetylcholine is a very small component of the choline peak, MRS 1H choline measurements are a surprisingly reliable surrogate marker of acetylcholine: in animal models the correlation across individuals between measured choline and acetylcholine levels is above 0.8 across multiple brain regions (Satlin et al., 1997, also see Frederick et al., 2002, Wang et al., 2008). These high correlations may be because phospholipids (such as phosphocholine and/or glycerophosphocholine, major components of the 1H choline peak) play a key role in mediating activity within cholinergic pathways (Cantley, 2002, Suh and Hille, 2002, Beloueche-Babari et al., 2010) by providing choline for acetylcholine synthesis (Wurtman et al., 1985, MacKay et al., 1996, Satlin et al., 1997, Boulanger et al., 2000, Valenzuela et al., 2003). In the case of myo-Inositol, cholinergic activity might stimulate phosphoinositide hydrolysis and thereby raise the level of intracellular inositol (Wess, 1996). Thus, higher levels of choline and myo-Inositol might both possibly reflect long-term up-regulation of cholinergic phospholipid pathways consequent on early blindness, as has been found in one animal model (Fosse et al., 1989).
Tuning and plasticity
Cholinergic phospholipid and GABAergic pathways are associated with changes in sensitivity and selectivity across a variety of time-scales. Short-term modulation of cholinergic pathways affect tuning and responses in heterogeneous way (Sillito and Kemp, 1983, Sato et al., 1987, Murphy and Sillito, 1991, Zinke et al., 2006) which are not fully understood, though it is believed that one of the roles of this pathway is mediating the relative effectiveness of bottom-up thalamic vs. top down and attentional input (Disney et al., 2006, Disney et al., 2007, Disney and Aoki, 2008, Herrero et al., 2008, Rokem and Silver, 2010). Both short-term modulation (Katzner et al., 2011) and longer term individual differences in GABA levels have similarly been shown to be associated with changes in response gain and tuning across a variety of time scales (Edden et al., 2009, Muthukumaraswamy et al., 2009, Yoon et al., 2010, Muthukumaraswamy et al., 2012).
As far as plasticity is concerned, it is thought that a homeostatic balance (Desai et al., 2002, Turrigiano and Nelson, 2004, McCoy et al., 2009, Tropea et al., 2009) between excitatory, inhibitory and modulatory (Morales et al., 2002) pathways mediates developmental and adult synaptic plasticity across multiple time scales via a combination of feed-forward `Hebbian' (Hensch, 2005, Hensch and Fagiolini, 2005) and feedback `synaptic scaling' (Desai et al., 2002) mechanisms. Modulatory cholinergic pathways appear to play a strong role, such that up-regulation of these pathways can shift the balance towards excitation (for reviews see Gu, 2003, Morishita and Hensch, 2008, Bavelier et al., 2010). For example, in adult humans pharmacological enhancement of GABA receptor function, reduction of muscarinic acetylcholine receptor function, and reduction of NMDA receptor function all have similar effects in blocking temporary increases in responsiveness as a result of short term visual deprivation (Boroojerdi et al., 2001). Similarly, in animal models, prolongation of the critical period in development and a `reawakening' of plasticity in adulthood are not only mediated by glutamatergic (e.g. Fagiolini et al., 2003, McCoy et al., 2009) and GABAergic pathways (e.g. Hensch et al., 1998, Iwai et al., 2003), but also by modulatory cholinergic pathways (Greuel et al., 1988, Morishita et al., 2010), see Gu (2003) and Bavelier et al. (2010) for reviews.
If it is indeed the case that early blindness affects GABAergic and/or cholinergic phospholipid pathways then this would suggest that that the cross-modal responses associated with early blindness may, at least in part, be mediated by a complex collection of changes within occipital biochemical pathways themselves. If so, this this offers the intriguing possibility that `re-awakening plasticity' in late blind individuals might allow them to make better use of cross-modal technologies (Bavelier et al., 2010).
Acknowledgments
Funded by NIH EY-014645. Many thanks to Jeannie Padowski and Erik Shankland for help with phantom measurements.
Footnotes
No conflicts of interest.
References
- Argandona EG, Bengoetxea H, Lafuente JV. Physical exercise is required for environmental enrichment to offset the quantitative effects of dark-rearing on the S-100beta astrocytic density in the rat visual cortex. J Anat. 2009;215:132–140. doi: 10.1111/j.1469-7580.2009.01103.x. [DOI] [PMC free article] [PubMed] [Google Scholar]
- Argandona EG, Rossi ML, Lafuente JV. Visual deprivation effects on the s100beta positive astrocytic population in the developing rat visual cortex: a quantitative study. Brain Res Dev Brain Res. 2003;141:63–69. doi: 10.1016/s0165-3806(02)00643-0. [DOI] [PubMed] [Google Scholar]
- Bavelier D, Levi DM, Li RW, Dan Y, Hensch TK. Removing brakes on adult brain plasticity: from molecular to behavioral interventions. J Neurosci. 2010;30:14964–14971. doi: 10.1523/JNEUROSCI.4812-10.2010. [DOI] [PMC free article] [PubMed] [Google Scholar]
- Bear MF, Singer W. Modulation of visual cortical plasticity by acetylcholine and noradrenaline. Nature. 1986;320:172–176. doi: 10.1038/320172a0. [DOI] [PubMed] [Google Scholar]
- Bedny M, Konkle T, Pelphrey K, Saxe R, Pascual-Leone A. Current biology : CB. 2010. Sensitive Period for a Multimodal Response in Human Visual Motion Area MT/MST. [DOI] [PMC free article] [PubMed] [Google Scholar]
- Beloueche-Babari M, Chung YL, Al-Saffar NM, Falck-Miniotis M, Leach MO. Metabolic assessment of the action of targeted cancer therapeutics using magnetic resonance spectroscopy. Br J Cancer. 2010;102:1–7. doi: 10.1038/sj.bjc.6605457. [DOI] [PMC free article] [PubMed] [Google Scholar]
- Benevento LA, Bakkum BW, Cohen RS. gamma-Aminobutyric acid and somatostatin immunoreactivity in the visual cortex of normal and dark-reared rats. Brain Res. 1995;689:172–182. doi: 10.1016/0006-8993(95)00553-3. [DOI] [PubMed] [Google Scholar]
- Benevento LA, Bakkum BW, Port JD, Cohen RS. The effects of dark-rearing on the electrophysiology of the rat visual cortex. Brain Res. 1992;572:198–207. doi: 10.1016/0006-8993(92)90470-t. [DOI] [PubMed] [Google Scholar]
- Bernabeu A, Alfaro A, Garcia M, Fernandez E. Proton magnetic resonance spectroscopy (1H-MRS) reveals the presence of elevated myo-inositol in the occipital cortex of blind subjects. Neuroimage. 2009;47:1172–1176. doi: 10.1016/j.neuroimage.2009.04.080. [DOI] [PubMed] [Google Scholar]
- Boroojerdi B, Battaglia F, Muellbacher W, Cohen LG. Mechanisms underlying rapid experience-dependent plasticity in the human visual cortex. Proc Natl Acad Sci U S A. 2001;98:14698–14701. doi: 10.1073/pnas.251357198. [DOI] [PMC free article] [PubMed] [Google Scholar]
- Boulanger Y, Labelle M, Khiat A. Role of phospholipase A(2) on the variations of the choline signal intensity observed by 1H magnetic resonance spectroscopy in brain diseases. Brain Res Brain Res Rev. 2000;33:380–389. doi: 10.1016/s0165-0173(00)00037-0. [DOI] [PubMed] [Google Scholar]
- Bourgeois JP, Jastreboff PJ, Rakic P. Synaptogenesis in visual cortex of normal and preterm monkeys: evidence for intrinsic regulation of synaptic overproduction. Proc Natl Acad Sci U S A. 1989;86:4297–4301. doi: 10.1073/pnas.86.11.4297. [DOI] [PMC free article] [PubMed] [Google Scholar]
- Bridge H, Cowey A, Ragge N, Watkins K. Imaging studies in congenital anophthalmia reveal preservation of brain architecture in `visual' cortex. Brain. 2009 doi: 10.1093/brain/awp279. [DOI] [PubMed] [Google Scholar]
- Burton H. Visual cortex activity in early and late blind people. J Neurosci. 2003;23:4005–4011. doi: 10.1523/JNEUROSCI.23-10-04005.2003. [DOI] [PMC free article] [PubMed] [Google Scholar]
- Burton H, Snyder AZ, Conturo TE, Akbudak E, Ollinger JM, Raichle ME. Adaptive changes in early and late blind: a fMRI study of Braille reading. J Neurophysiol. 2002;87:589–607. doi: 10.1152/jn.00285.2001. [DOI] [PMC free article] [PubMed] [Google Scholar]
- Cantley LC. The phosphoinositide 3-kinase pathway. Science. 2002;296:1655–1657. doi: 10.1126/science.296.5573.1655. [DOI] [PubMed] [Google Scholar]
- Cauli B, Tong XK, Rancillac A, Serluca N, Lambolez B, Rossier J, Hamel E. Cortical GABA interneurons in neurovascular coupling: relays for subcortical vasoactive pathways. J Neurosci. 2004;24:8940–8949. doi: 10.1523/JNEUROSCI.3065-04.2004. [DOI] [PMC free article] [PubMed] [Google Scholar]
- Chan KC, So KF, Wu EX. Proton magnetic resonance spectroscopy revealed choline reduction in the visual cortex in an experimental model of chronic glaucoma. Exp Eye Res. 2009;88:65–70. doi: 10.1016/j.exer.2008.10.002. [DOI] [PubMed] [Google Scholar]
- Collignon O, Voss P, Lassonde M, Lepore F. Cross-modal plasticity for the spatial processing of sounds in visually deprived subjects. Exp Brain Res. 2008 doi: 10.1007/s00221-008-1553-z. [DOI] [PubMed] [Google Scholar]
- Cordoba J, Sanpedro F, Alonso J, Rovira A. 1H magnetic resonance in the study of hepatic encephalopathy in humans. Metab Brain Dis. 2002;17:415–429. doi: 10.1023/a:1021926405944. [DOI] [PubMed] [Google Scholar]
- De Volder AG, Bol A, Blin J, Robert A, Arno P, Grandin C, Michel C, Veraart C. Brain energy metabolism in early blind subjects: neural activity in the visual cortex. Brain Res. 1997;750:235–244. doi: 10.1016/s0006-8993(96)01352-2. [DOI] [PubMed] [Google Scholar]
- Dehay C, Giroud P, Berland M, Killackey HP, Kennedy H. Phenotypic characterisation of respecified visual cortex subsequent to prenatal enucleation in the monkey: development of acetylcholinesterase and cytochrome oxidase patterns. J Comp Neurol. 1996;376:386–402. doi: 10.1002/(SICI)1096-9861(19961216)376:3<386::AID-CNE3>3.0.CO;2-Z. [DOI] [PubMed] [Google Scholar]
- Desai NS, Cudmore RH, Nelson SB, Turrigiano GG. Critical periods for experience-dependent synaptic scaling in visual cortex. Nat Neurosci. 2002;5:783–789. doi: 10.1038/nn878. [DOI] [PubMed] [Google Scholar]
- Desgent S, Ptito M. Cortical GABAergic interneurons in cross-modal plasticity following early blindness. Neural plasticity. 2012;2012:590725. doi: 10.1155/2012/590725. [DOI] [PMC free article] [PubMed] [Google Scholar]
- Disney AA, Aoki C. Muscarinic acetylcholine receptors in macaque V1 are most frequently expressed by parvalbumin-immunoreactive neurons. J Comp Neurol. 2008;507:1748–1762. doi: 10.1002/cne.21616. [DOI] [PMC free article] [PubMed] [Google Scholar]
- Disney AA, Aoki C, Hawken MJ. Gain modulation by nicotine in macaque v1. Neuron. 2007;56:701–713. doi: 10.1016/j.neuron.2007.09.034. [DOI] [PMC free article] [PubMed] [Google Scholar]
- Disney AA, Domakonda KV, Aoki C. Differential expression of muscarinic acetylcholine receptors across excitatory and inhibitory cells in visual cortical areas V1 and V2 of the macaque monkey. J Comp Neurol. 2006;499:49–63. doi: 10.1002/cne.21096. [DOI] [PubMed] [Google Scholar]
- Donahue MJ, Near J, Blicher JU, Jezzard P. Baseline GABA concentration and fMRI response. Neuroimage. 2010;53:392–398. doi: 10.1016/j.neuroimage.2010.07.017. [DOI] [PubMed] [Google Scholar]
- Edden RA, Intrapiromkul J, Zhu H, Cheng Y, Barker PB. Measuring T2 in vivo with J-difference editing: application to GABA at 3 Tesla. J Magn Reson Imaging. 2012a;35:229–234. doi: 10.1002/jmri.22865. [DOI] [PMC free article] [PubMed] [Google Scholar]
- Edden RA, Muthukumaraswamy SD, Freeman TC, Singh KD. Orientation discrimination performance is predicted by GABA concentration and gamma oscillation frequency in human primary visual cortex. J Neurosci. 2009;29:15721–15726. doi: 10.1523/JNEUROSCI.4426-09.2009. [DOI] [PMC free article] [PubMed] [Google Scholar]
- Edden RA, Puts NA, Barker PB. Macromolecule-suppressed GABA-edited magnetic resonance spectroscopy at 3T. Magn Reson Med. 2012b;68:657–661. doi: 10.1002/mrm.24391. [DOI] [PMC free article] [PubMed] [Google Scholar]
- Fagiolini M, Katagiri H, Miyamoto H, Mori H, Grant SG, Mishina M, Hensch TK. Separable features of visual cortical plasticity revealed by N-methyl-D-aspartate receptor 2A signaling. Proc Natl Acad Sci U S A. 2003;100:2854–2859. doi: 10.1073/pnas.0536089100. [DOI] [PMC free article] [PubMed] [Google Scholar]
- Fayed N, Modrego PJ, Medrano J. Comparative test-retest reliability of metabolite values assessed with magnetic resonance spectroscopy of the brain. The LCModel versus the manufacturer software. Neurological research. 2009;31:472–477. doi: 10.1179/174313209X395481. [DOI] [PubMed] [Google Scholar]
- Fosse VM, Heggelund P, Fonnum F. Postnatal development of glutamatergic, GABAergic, and cholinergic neurotransmitter phenotypes in the visual cortex, lateral geniculate nucleus, pulvinar, and superior colliculus in cats. J Neurosci. 1989;9:426–435. doi: 10.1523/JNEUROSCI.09-02-00426.1989. [DOI] [PMC free article] [PubMed] [Google Scholar]
- Frederick B, Satlin A, Wald LL, Hennen J, Bodick N, Renshaw PF. Brain proton magnetic resonance spectroscopy in Alzheimer disease: changes after treatment with xanomeline. Am J Geriatr Psychiatry. 2002;10:81–88. [PubMed] [Google Scholar]
- Fregnac Y, Imbert M. Development of neuronal selectivity in primary visual cortex of cat. Physiol Rev. 1984;64:325–434. doi: 10.1152/physrev.1984.64.1.325. [DOI] [PubMed] [Google Scholar]
- Friston K. Ten ironic rules for non-statistical reviewers. Neuroimage. 2012;61:1300–1310. doi: 10.1016/j.neuroimage.2012.04.018. [DOI] [PubMed] [Google Scholar]
- Fujii T, Tanabe HC, Kochiyama T, Sadato N. An investigation of cross-modal plasticity of effective connectivity in the blind by dynamic causal modeling of functional MRI data. Neurosci Res. 2009;65:175–186. doi: 10.1016/j.neures.2009.06.014. [DOI] [PubMed] [Google Scholar]
- Gabbott PL, Stewart MG, Rose SP. The quantitative effects of dark-rearing and light exposure on the laminar composition and depth distribution of neurons and glia in the visual cortex (area 17) of the rat. Exp Brain Res. 1986;64:225–232. doi: 10.1007/BF00238217. [DOI] [PubMed] [Google Scholar]
- Gasparovic C, Bedrick EJ, Mayer AR, Yeo RA, Chen H, Damaraju E, Calhoun VD, Jung RE. Test-retest reliability and reproducibility of short-echo-time spectroscopic imaging of human brain at 3T. Magn Reson Med. 2011;66:324–332. doi: 10.1002/mrm.22858. [DOI] [PMC free article] [PubMed] [Google Scholar]
- Greuel JM, Luhmann HJ, Singer W. Pharmacological induction of use-dependent receptive field modifications in the visual cortex. Science. 1988;242:74–77. doi: 10.1126/science.2902687. [DOI] [PubMed] [Google Scholar]
- Gu Q. Neuromodulatory transmitter systems in the cortex and their role in cortical plasticity. Neuroscience. 2002;111:815–835. doi: 10.1016/s0306-4522(02)00026-x. [DOI] [PubMed] [Google Scholar]
- Gu Q. Contribution of acetylcholine to visual cortex plasticity. Neurobiol Learn Mem. 2003;80:291–301. doi: 10.1016/s1074-7427(03)00073-x. [DOI] [PubMed] [Google Scholar]
- Gujar SK, Maheshwari S, Bjorkman-Burtscher I, Sundgren PC. Magnetic resonance spectroscopy. J Neuroophthalmol. 2005;25:217–226. doi: 10.1097/01.wno.0000177307.21081.81. [DOI] [PubMed] [Google Scholar]
- Hamel E. Perivascular nerves and the regulation of cerebrovascular tone. J Appl Physiol. 2006;100:1059–1064. doi: 10.1152/japplphysiol.00954.2005. [DOI] [PubMed] [Google Scholar]
- Hendry SH, Jones EG. Reduction in number of immunostained GABAergic neurones in deprived-eye dominance columns of monkey area 17. Nature. 1986;320:750–753. doi: 10.1038/320750a0. [DOI] [PubMed] [Google Scholar]
- Hensch TK. Critical period plasticity in local cortical circuits. Nat Rev Neurosci. 2005;6:877–888. doi: 10.1038/nrn1787. [DOI] [PubMed] [Google Scholar]
- Hensch TK, Fagiolini M. Excitatory-inhibitory balance and critical period plasticity in developing visual cortex. Prog Brain Res. 2005;147:115–124. doi: 10.1016/S0079-6123(04)47009-5. [DOI] [PubMed] [Google Scholar]
- Hensch TK, Fagiolini M, Mataga N, Stryker MP, Baekkeskov S, Kash SF. Local GABA circuit control of experience-dependent plasticity in developing visual cortex. Science. 1998;282:1504–1508. doi: 10.1126/science.282.5393.1504. [DOI] [PMC free article] [PubMed] [Google Scholar]
- Herminghaus S, Frolich L, Gorriz C, Pilatus U, Dierks T, Wittsack HJ, Lanfermann H, Maurer K, Zanella FE. Brain metabolism in Alzheimer disease and vascular dementia assessed by in vivo proton magnetic resonance spectroscopy. Psychiatry Res. 2003;123:183–190. doi: 10.1016/s0925-4927(03)00071-4. [DOI] [PubMed] [Google Scholar]
- Herrero JL, Roberts MJ, Delicato LS, Gieselmann MA, Dayan P, Thiele A. Acetylcholine contributes through muscarinic receptors to attentional modulation in V1. Nature. 2008;454:1110–1114. doi: 10.1038/nature07141. [DOI] [PMC free article] [PubMed] [Google Scholar]
- Hurlbert SH. Pseudoreplication and the design of ecological field experiments. Ecological monographs. 1984;54:187–211. [Google Scholar]
- Iwai Y, Fagiolini M, Obata K, Hensch TK. Rapid critical period induction by tonic inhibition in visual cortex. J Neurosci. 2003;23:6695–6702. doi: 10.1523/JNEUROSCI.23-17-06695.2003. [DOI] [PMC free article] [PubMed] [Google Scholar]
- Jiang J, Zhu W, Shi F, Liu Y, Li J, Qin W, Li K, Yu C, Jiang T. Thick visual cortex in the early blind. J Neurosci. 2009;29:2205–2211. doi: 10.1523/JNEUROSCI.5451-08.2009. [DOI] [PMC free article] [PubMed] [Google Scholar]
- Kahn DM, Krubitzer L. Massive cross-modal cortical plasticity and the emergence of a new cortical area in developmentally blind mammals. Proc Natl Acad Sci U S A. 2002;99:11429–11434. doi: 10.1073/pnas.162342799. [DOI] [PMC free article] [PubMed] [Google Scholar]
- Kanowski M, Kaufmann J, Braun J, Bernarding J, Tempelmann C. Quantitation of simulated short echo time 1H human brain spectra by LCModel and AMARES. Magn Reson Med. 2004;51:904–912. doi: 10.1002/mrm.20063. [DOI] [PubMed] [Google Scholar]
- Katzner S, Busse L, Carandini M. GABAA inhibition controls response gain in visual cortex. J Neurosci. 2011;31:5931–5941. doi: 10.1523/JNEUROSCI.5753-10.2011. [DOI] [PMC free article] [PubMed] [Google Scholar]
- Kirkwood A, Rozas C, Kirkwood J, Perez F, Bear MF. Modulation of long-term synaptic depression in visual cortex by acetylcholine and norepinephrine. J Neurosci. 1999;19:1599–1609. doi: 10.1523/JNEUROSCI.19-05-01599.1999. [DOI] [PMC free article] [PubMed] [Google Scholar]
- Kleinfeld D, Blinder P, Drew PJ, Driscoll JD, Muller A, Tsai PS, Shih AY. A guide to delineate the logic of neurovascular signaling in the brain. Front Neuroenergetics. 2011;3:1. doi: 10.3389/fnene.2011.00001. [DOI] [PMC free article] [PubMed] [Google Scholar]
- Klinge C, Eippert F, Roder B, Buchel C. Corticocortical connections mediate primary visual cortex responses to auditory stimulation in the blind. J Neurosci. 2010;30:12798–12805. doi: 10.1523/JNEUROSCI.2384-10.2010. [DOI] [PMC free article] [PubMed] [Google Scholar]
- Lecrux C, Hamel E. The neurovascular unit in brain function and disease. Acta Physiol (Oxf) 2011;203:47–59. doi: 10.1111/j.1748-1716.2011.02256.x. [DOI] [PubMed] [Google Scholar]
- Lepore N, Voss P, Lepore F, Chou YY, Fortin M, Gougoux F, Lee AD, Brun C, Lassonde M, Madsen SK, Toga AW, Thompson PM. Brain structure changes visualized in early- and late-onset blind subjects. Neuroimage. 2010;49:134–140. doi: 10.1016/j.neuroimage.2009.07.048. [DOI] [PMC free article] [PubMed] [Google Scholar]
- Lewis LB, Fine I. The effects of visual deprivation after infancy. In: Levin LA, et al., editors. Adler's Physiology of the Eye. Elsevier; 2011. pp. 750–767. [Google Scholar]
- MacKay S, Meyerhoff DJ, Constans JM, Norman D, Fein G, Weiner MW. Regional gray and white matter metabolite differences in subjects with AD, with subcortical ischemic vascular dementia, and elderly controls with 1H magnetic resonance spectroscopic imaging. Arch Neurol. 1996;53:167–174. doi: 10.1001/archneur.1996.00550020079018. [DOI] [PMC free article] [PubMed] [Google Scholar]
- Mangia S, Tkac I, Gruetter R, Van De Moortele PF, Giove F, Maraviglia B, Ugurbil K. Sensitivity of single-voxel 1H-MRS in investigating the metabolism of the activated human visual cortex at 7 T. Magn Reson Imaging. 2006;24:343–348. doi: 10.1016/j.mri.2005.12.023. [DOI] [PubMed] [Google Scholar]
- Mangia S, Tkac I, Gruetter R, Van de Moortele PF, Maraviglia B, Ugurbil K. Sustained neuronal activation raises oxidative metabolism to a new steady-state level: evidence from 1H NMR spectroscopy in the human visual cortex. J Cereb Blood Flow Metab. 2007;27:1055–1063. doi: 10.1038/sj.jcbfm.9600401. [DOI] [PubMed] [Google Scholar]
- McCoy PA, Huang HS, Philpot BD. Advances in understanding visual cortex plasticity. Curr Opin Neurobiol. 2009;19:298–304. doi: 10.1016/j.conb.2009.05.010. [DOI] [PMC free article] [PubMed] [Google Scholar]
- Mescher M, Merkle H, Kirsch J, Garwood M, Gruetter R. Simultaneous in vivo spectral editing and water suppression. NMR Biomed. 1998;11:266–272. doi: 10.1002/(sici)1099-1492(199810)11:6<266::aid-nbm530>3.0.co;2-j. [DOI] [PubMed] [Google Scholar]
- Mishina M, Senda M, Kiyosawa M, Ishiwata K, De Volder AG, Nakano H, Toyama H, Oda K, Kimura Y, Ishii K, Sasaki T, Ohyama M, Komaba Y, Kobayashi S, Kitamura S, Katayama Y. Increased regional cerebral blood flow but normal distribution of GABAA receptor in the visual cortex of subjects with early-onset blindness. Neuroimage. 2003;19:125–131. doi: 10.1016/s1053-8119(03)00051-x. [DOI] [PubMed] [Google Scholar]
- Morales B, Choi SY, Kirkwood A. Dark rearing alters the development of GABAergic transmission in visual cortex. J Neurosci. 2002;22:8084–8090. doi: 10.1523/JNEUROSCI.22-18-08084.2002. [DOI] [PMC free article] [PubMed] [Google Scholar]
- Morishita H, Hensch TK. Critical period revisited: impact on vision. Curr Opin Neurobiol. 2008;18:101–107. doi: 10.1016/j.conb.2008.05.009. [DOI] [PubMed] [Google Scholar]
- Morishita H, Miwa JM, Heintz N, Hensch TK. Lynx1, a cholinergic brake, limits plasticity in adult visual cortex. Science. 2010;330:1238–1240. doi: 10.1126/science.1195320. [DOI] [PMC free article] [PubMed] [Google Scholar]
- Movshon JA, Van Sluyters RC. Visual neural development. Annu Rev Psychol. 1981;32:477–522. doi: 10.1146/annurev.ps.32.020181.002401. [DOI] [PubMed] [Google Scholar]
- Mullins PG, McGonigle DJ, O'Gorman RL, Puts NA, Vidyasagar R, Evans CJ, Edden RA. Current practice in the use of MEGA-PRESS spectroscopy for the detection of GABA. Neuroimage. 2012 doi: 10.1016/j.neuroimage.2012.12.004. [DOI] [PMC free article] [PubMed] [Google Scholar]
- Murphy PC, Sillito AM. Cholinergic enhancement of direction selectivity in the visual cortex of the cat. Neuroscience. 1991;40:13–20. doi: 10.1016/0306-4522(91)90170-s. [DOI] [PubMed] [Google Scholar]
- Muthukumaraswamy SD, Edden RA, Jones DK, Swettenham JB, Singh KD. Resting GABA concentration predicts peak gamma frequency and fMRI amplitude in response to visual stimulation in humans. Proc Natl Acad Sci U S A. 2009;106:8356–8361. doi: 10.1073/pnas.0900728106. [DOI] [PMC free article] [PubMed] [Google Scholar]
- Muthukumaraswamy SD, Evans CJ, Edden RA, Wise RG, Singh KD. Individual variability in the shape and amplitude of the BOLD-HRF correlates with endogenous GABAergic inhibition. Hum Brain Mapp. 2012;33:455–465. doi: 10.1002/hbm.21223. [DOI] [PMC free article] [PubMed] [Google Scholar]
- Near J, Simpson R, Cowen P, Jezzard P. Efficient gamma-aminobutyric acid editing at 3T without macromolecule contamination: MEGA-SPECIAL. NMR Biomed. 2011;24:1277–1285. doi: 10.1002/nbm.1688. [DOI] [PubMed] [Google Scholar]
- Nicolakakis N, Hamel E. Neurovascular function in Alzheimer's disease patients and experimental models. J Cereb Blood Flow Metab. 2011;31:1354–1370. doi: 10.1038/jcbfm.2011.43. [DOI] [PMC free article] [PubMed] [Google Scholar]
- Noppeney U. The effects of visual deprivation on functional and structural organization of the human brain. Neurosci Biobehav Rev. 2007;31:1169–1180. doi: 10.1016/j.neubiorev.2007.04.012. [DOI] [PubMed] [Google Scholar]
- Pellerin L. How astrocytes feed hungry neurons. Mol Neurobiol. 2005;32:59–72. doi: 10.1385/MN:32:1:059. [DOI] [PubMed] [Google Scholar]
- Provencher SW. Estimation of metabolite concentrations from localized in vivo proton NMR spectra. Magn Reson Med. 1993;30:672–679. doi: 10.1002/mrm.1910300604. [DOI] [PubMed] [Google Scholar]
- Provencher SW. LcModel and LcMgui User's Manual. 2000 http://s-provenchercom/pages/lcm-manualshtml.
- Puts NAJ, Barker PB, Edden RAE. Measuring the longitudinal relaxation time of GABA in vivo at 3 tesla. Journal of Magnetic Resonance Imaging. 2012:n/a–n/a. doi: 10.1002/jmri.23817. [DOI] [PMC free article] [PubMed] [Google Scholar]
- Rakic P, Suner I, Williams RW. A novel cytoarchitectonic area induced experimentally within the primate visual cortex. Proc Natl Acad Sci U S A. 1991;88:2083–2087. doi: 10.1073/pnas.88.6.2083. [DOI] [PMC free article] [PubMed] [Google Scholar]
- Rauschecker JP, Tian B, Korte M, Egert U. Crossmodal changes in the somatosensory vibrissa/barrel system of visually deprived animals. Proc Natl Acad Sci U S A. 1992;89:5063–5067. doi: 10.1073/pnas.89.11.5063. [DOI] [PMC free article] [PubMed] [Google Scholar]
- Rice JR, Milbrandt RH, Madsen EL, Frank GR, Boote EJ, Blechinger JC. Anthropomorphic 1H MRS head phantom. Medical physics. 1998;25:1145–1156. doi: 10.1118/1.598306. [DOI] [PubMed] [Google Scholar]
- Rokem A, Silver MA. Cholinergic enhancement augments magnitude and specificity of visual perceptual learning in healthy humans. Curr Biol. 2010;20:1723–1728. doi: 10.1016/j.cub.2010.08.027. [DOI] [PMC free article] [PubMed] [Google Scholar]
- Rossner S, Kumar A, Witzemann V, Schliebs R. Development of laminar expression of the m2 muscarinic cholinergic receptor gene in rat visual cortex and the effect of monocular visual deprivation. Brain Res Dev Brain Res. 1994;77:55–61. doi: 10.1016/0165-3806(94)90213-5. [DOI] [PubMed] [Google Scholar]
- Rothman DL, Petroff OA, Behar KL, Mattson RH. Localized 1H NMR measurements of gamma-aminobutyric acid in human brain in vivo. Proc Natl Acad Sci U S A. 1993;90:5662–5666. doi: 10.1073/pnas.90.12.5662. [DOI] [PMC free article] [PubMed] [Google Scholar]
- Sabatier J, Gilard V, Malet-Martino M, Ranjeva JP, Terral C, Breil S, Delisle MB, Manelfe C, Tremoulet M, Berry I. Characterization of choline compounds with in vitro 1H magnetic resonance spectroscopy for the discrimination of primary brain tumors. Invest Radiol. 1999;34:230–235. doi: 10.1097/00004424-199903000-00013. [DOI] [PubMed] [Google Scholar]
- Sadato N, Pascual-Leone A, Grafman J, Deiber MP, Ibanez V, Hallett M. Neural networks for Braille reading by the blind. Brain. 1998;121(Pt 7):1213–1229. doi: 10.1093/brain/121.7.1213. [DOI] [PubMed] [Google Scholar]
- Sanabria-Bohorquez SM, De Volder AG, Arno P, Sibomana M, Coppens A, Michel C, Veraart C. Decreased benzodiazepine receptor density in the cerebellum of early blind human subjects. Brain Res. 2001;888:203–211. doi: 10.1016/s0006-8993(00)03049-3. [DOI] [PubMed] [Google Scholar]
- Satlin A, Bodick N, Offen WW, Renshaw PF. Brain proton magnetic resonance spectroscopy (1H-MRS) in Alzheimer's disease: changes after treatment with xanomeline, an M1 selective cholinergic agonist. Am J Psychiatry. 1997;154:1459–1461. doi: 10.1176/ajp.154.10.1459. [DOI] [PubMed] [Google Scholar]
- Sato H, Hata Y, Masui H, Tsumoto T. A functional role of cholinergic innervation to neurons in the cat visual cortex. J Neurophysiol. 1987;58:765–780. doi: 10.1152/jn.1987.58.4.765. [DOI] [PubMed] [Google Scholar]
- Schubert F, Gallinat J, Seifert F, Rinneberg H. Glutamate concentrations in human brain using single voxel proton magnetic resonance spectroscopy at 3 Tesla. Neuroimage. 2004;21:1762–1771. doi: 10.1016/j.neuroimage.2003.11.014. [DOI] [PubMed] [Google Scholar]
- Shimony JS, Burton H, Epstein AA, McLaren DG, Sun SW, Snyder AZ. Diffusion tensor imaging reveals white matter reorganization in early blind humans. Cereb Cortex. 2006;16:1653–1661. doi: 10.1093/cercor/bhj102. [DOI] [PMC free article] [PubMed] [Google Scholar]
- Shu N, Li J, Li K, Yu C, Jiang T. Abnormal diffusion of cerebral white matter in early blindness. Hum Brain Mapp. 2009;30:220–227. doi: 10.1002/hbm.20507. [DOI] [PMC free article] [PubMed] [Google Scholar]
- Sillito AM, Kemp JA. Cholinergic modulation of the functional organization of the cat visual cortex. Brain Res. 1983;289:143–155. doi: 10.1016/0006-8993(83)90015-x. [DOI] [PubMed] [Google Scholar]
- Soares DP, Law M. Magnetic resonance spectroscopy of the brain: review of metabolites and clinical applications. Clin Radiol. 2009;64:12–21. doi: 10.1016/j.crad.2008.07.002. [DOI] [PubMed] [Google Scholar]
- Suh BC, Hille B. Recovery from muscarinic modulation of M current channels requires phosphatidylinositol 4,5-bisphosphate synthesis. Neuron. 2002;35:507–520. doi: 10.1016/s0896-6273(02)00790-0. [DOI] [PubMed] [Google Scholar]
- Tigges M, Tigges J, Rees H, Rye D, Levey AI. Distribution of muscarinic cholinergic receptor proteins m1 to m4 in area 17 of normal and monocularly deprived rhesus monkeys. J Comp Neurol. 1997;388:130–145. [PubMed] [Google Scholar]
- Tropea D, Van Wart A, Sur M. Molecular mechanisms of experience-dependent plasticity in visual cortex. Philos Trans R Soc Lond B Biol Sci. 2009;364:341–355. doi: 10.1098/rstb.2008.0269. [DOI] [PMC free article] [PubMed] [Google Scholar]
- Turrigiano GG, Nelson SB. Homeostatic plasticity in the developing nervous system. Nat Rev Neurosci. 2004;5:97–107. doi: 10.1038/nrn1327. [DOI] [PubMed] [Google Scholar]
- Uhl F, Franzen P, Podreka I, Steiner M, Deecke L. Increased regional cerebral blood flow in inferior occipital cortex and cerebellum of early blind humans. Neurosci Lett. 1993;150:162–164. doi: 10.1016/0304-3940(93)90526-q. [DOI] [PubMed] [Google Scholar]
- Valenzuela MJ, Jones M, Wen W, Rae C, Graham S, Shnier R, Sachdev P. Memory training alters hippocampal neurochemistry in healthy elderly. Neuroreport. 2003;14:1333–1337. doi: 10.1097/01.wnr.0000077548.91466.05. [DOI] [PubMed] [Google Scholar]
- Van Essen DC, Harwell J, Hanlon D, Dickson J, Koslow SH, Subramaniam S, editors. Databasing the Brain: From Data to Knowledge. John Wiley & Sons; NJ: 2005. Surface-Based Atlases and a Database of Cortical Structure and Function; pp. 369–387. John Wiley & Sons, NJ, pp. 369-387. [Google Scholar]
- Veraart C, De Volder AG, Wanet-Defalque MC, Bol A, Michel C, Goffinet AM. Glucose Utilization in human visual cortex is abnormally elevated in blindness of early onset but decreased in blindness of late onset. Brain Res. 1990;510:115–121. doi: 10.1016/0006-8993(90)90735-t. [DOI] [PubMed] [Google Scholar]
- Wanet-Defalque MC, Veraart C, De Volder A, Metz R, Michel C, Dooms G, Goffinet A. High metabolic activity in the visual cortex of early blind human subjects. Brain Res. 1988;446:369–373. doi: 10.1016/0006-8993(88)90896-7. [DOI] [PubMed] [Google Scholar]
- Wang XC, Du XX, Tian Q, Wang JZ. Correlation between choline signal intensity and acetylcholine level in different brain regions of rat. Neurochem Res. 2008;33:814–819. doi: 10.1007/s11064-007-9509-4. [DOI] [PubMed] [Google Scholar]
- Wess J. Molecular biology of muscarinic acetylcholine receptors. Crit Rev Neurobiol. 1996;10:69–99. doi: 10.1615/critrevneurobiol.v10.i1.40. [DOI] [PubMed] [Google Scholar]
- Wiesel TN, Hubel DH. Comparison of the effects of unilateral and bilateral eye closure on cortical unit responses in kittens. J Neurophysiol. 1965a;28:1029–1040. doi: 10.1152/jn.1965.28.6.1029. [DOI] [PubMed] [Google Scholar]
- Wiesel TN, Hubel DH. Extent of recovery from the effects of visual deprivation in kittens. J Neurophysiol. 1965b;28:1060–1072. doi: 10.1152/jn.1965.28.6.1060. [DOI] [PubMed] [Google Scholar]
- Wobbrock JO, Findlater L, Gergle D, Higgins JJ. The Aligned Rank Transform for nonparametric factorial analyses using only ANOVA procedures. Proceedings of the ACM Conference on Human Factors in Computing Systems (CHI '11); Vancouver, British Columbia: ACM Press, New York; 2011. pp. 143–146. [Google Scholar]
- Wurtman RJ, Blusztajn JK, Maire JC. “Autocannibalism” of choline-containing membrane phospholipids in the pathogenesis of Alzheimer's disease-A hypothesis. Neurochem Int. 1985;7:369–372. doi: 10.1016/0197-0186(85)90127-5. [DOI] [PubMed] [Google Scholar]
- Yoon JH, Maddock RJ, Rokem A, Silver MA, Minzenberg MJ, Ragland JD, Carter CS. GABA concentration is reduced in visual cortex in schizophrenia and correlates with orientation-specific surround suppression. J Neurosci. 2010;30:3777–3781. doi: 10.1523/JNEUROSCI.6158-09.2010. [DOI] [PMC free article] [PubMed] [Google Scholar]
- Zimmerman DW. A Note on the Influence of Outliers on Parametric and Nonparametric Tests. J Gen Psychol. 1994;121:391–402. [Google Scholar]
- Zinke W, Roberts MJ, Guo K, McDonald JS, Robertson R, Thiele A. Cholinergic modulation of response properties and orientation tuning of neurons in primary visual cortex of anaesthetized Marmoset monkeys. Eur J Neurosci. 2006;24:314–328. doi: 10.1111/j.1460-9568.2006.04882.x. [DOI] [PMC free article] [PubMed] [Google Scholar]