Abstract
The human visual attention system is geared toward detecting the most salient and relevant events in an overwhelming stream of information. There has been great interest in measuring how many visual events can be processed at a time, and most of the work has suggested that the limit is three to four. However, attention to a visual stimulus can also be driven by a synchronous auditory event. The present work indicates that a fundamentally different limit applies to audiovisual processing, such that at most only a single audiovisual event can be processed at a time. This limited capacity is not due to a limitation in visual selection; participants were able to process about four visual objects simultaneously. Instead, we propose that audiovisual orienting is subject to a fundamentally different capacity limit than pure visual selection is.
Keywords: multisensory processing, attention, capacity, vision
Visual selective attention is crucial for the ability to select salient or relevant visual events. An important question is how many such events can be detected and processed at a time. Previous work has arrived at a visual-capacity estimate of about 3 to 4 individual units of processing. For example, Yantis and Johnson (1990) and Wright (1994) found that about four flashed locations can be prioritized in search, and other researchers have found that similar numbers of items can be easily enumerated and tracked across space (for reviews, see Cavanagh & Alvarez, 2005, and Trick & Pylyshyn, 1994). Ultimately, this limit of 4 appears to reflect the capacity to individuate, or index, visual events in a visual short-term or working memory system (Awh, Barton, & Vogel, 2007; Cowan, 2001; Luck & Vogel, 1997; Pashler, 1988; Pylyshyn, 2001; Sperling, 1960).
However, visual stimulation is not the only way to make a visual event stand out. Synchronizing a visual event with an auditory or tactile signal makes it salient among a multitude of nonsynchronized visual stimuli (Ngo & Spence, 2010; Van der Burg, Cass, Olivers, Theeuwes, & Alais, 2010; Van der Burg, Olivers, Bronkhorst, & Theeuwes, 2008b; Van der Burg, Olivers, Bronkhorst, & Theeuwes, 2009), even when the auditory or tactile signal is irrelevant to the task (Matusz & Eimer, 2011; Van der Burg, Olivers, Bronkhorst, & Theeuwes, 2008a). A recent electroencephalogram study (Van der Burg, Talsma, Olivers, Hickey, & Theeuwes, 2011) revealed that such audiovisual events elicit very early (~50 ms) activity, followed by components indicative of attentional capture (N2pc; Luck & Hillyard, 1994) and visual memory (contralateral delay activity, CDA; contralateral negative slow wave, CNSW; Klaver, Talsma, Wijers, Heinze, & Mulder, 1999; Vogel & Machizawa, 2004).
These findings raise the question as to how many visual events can be prioritized when synchronized to a sound. To date, the majority of studies investigating multisensory integration have used a single combination of two sensory signals (e.g., one sound with one visual event; see, e.g., Alais & Burr, 2004; Chen & Spence, 2011; Jack & Thurlow, 1973; Thomas, 1941). But in principle, multiple visual events might bind to an auditory signal as long as they appear within the temporal window of integration (i.e., the boundary interval during which multisensory integration occurs; Colonius & Diederich, 2004; Slutsky & Recanzone, 2001). In that case, the capacity for registering sound-driven visual events would ultimately be restricted by the visual processing limitations discussed earlier. Thus, the measured capacity of audiovisual integration would be capped by the three- to four-item limit on visual working memory.
However, there are reasons to hypothesize a more restricted capacity. From an ecological point of view, it would make sense to bind only one visual event to a specific sound. In natural scenes, individual, object-related sounds (unlike the sound of the wind or a babbling brook) come from a single source (Alais & Burr, 2004; Beierholm, Kording, Shams, & Ma, 2009; Soto-Faraco, Kingstone, & Spence, 2003). Thus, in the current work, we tested whether audiovisual orienting may be subject to a fundamentally different limit than other measures of on-line visual capacity are.
Experiment 1
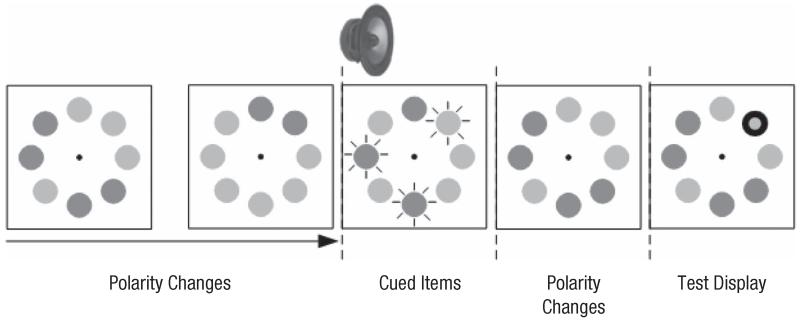
We adopted the pip-and-pop paradigm (Van der Burg et al., 2008b) to determine the capacity for detecting audiovisual events. In Experiment 1a, participants saw 24 black and white discs (see Fig. 1). Every 150 ms, a randomly selected subset of 1 to 8 discs changed polarity from black to white or the reverse. The penultimate change was synchronized with a spatially uninformative auditory signal. The discs that changed at this time were the targets. Participants were asked to remember which discs were the targets and to determine whether or not a probe presented at the end of the trial fell on one of them. To investigate whether the capacity estimated on the basis of this procedure would generalize across different display conditions, in Experiment 1b, we manipulated the display density (16 or 24 discs), and in Experiment 1c, we manipulated the stimulus onset asynchrony (SOA) from one change to the next (150 or 200 ms). (Audiovisual binding is less ambiguous under 200-ms separations of visual events than under 150-ms separations; Van der Burg et al., 2010.) Experiment 1d controlled for the possibility that the sound, rather than specifically binding to the visual signal, simply acted as a general temporal marker or warning signal that could improve detection of a concurrent visual event. This experiment compared the effect of a concurrent sound with that of a concurrent non-specific visual signal (i.e., a ring drawing attention to the entire array of discs; cf. Van der Burg et al., 2008b).
Fig. 1.
Illustration of the events in a trial in Experiment 1a. Every 150 ms, a random subset of 24 discs (only 8 are drawn here) changed in luminance. The penultimate change was synchronized with a sound (here, 3 items are marked for illustrative purposes). At the end of the trial, participants were asked whether or not a probed disc was one of the target (i.e., auditorily cued) items.
For each participant, capacity was estimated by adopting a simple model that is equivalent to Cowan’s (2001) K. In our study, we manipulated the number of visual events n (i.e., the number of discs that changed polarity in synchrony with the auditory signal). If n is smaller than the capacity, then the proportion correct (p) is expected to be optimal; that is,
| (1) |
If the number of visual events exceeds the capacity, the expected proportion correct is given by the probability that the event fell within the observer’s capacity plus the probability of a correct guess when an event falls outside capacity (here, .5):
| (2) |
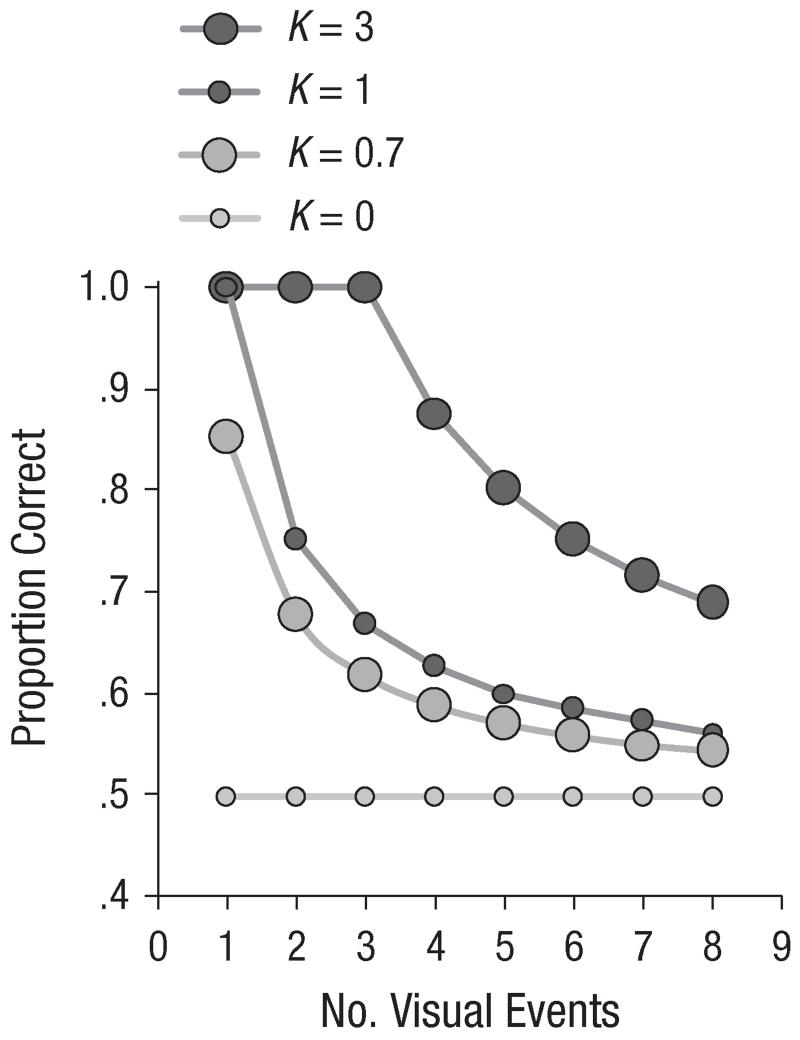
Figure 2 shows the predictions of the model for different numbers of visual events (n = 1–8) and different capacity levels (K = 0–3).
Fig. 2.
Predicted proportion correct as a function of the number of visual events, for four different capacities (K).
Method
Participants
Nine students (7 females, 2 males; mean age = 19.6 years, range = 18–23 years), 8 students (6 females, 2 males; mean age = 21.0 years, range = 19–25 years), 8 students (6 females, 2 males; mean age = 20.0 years, range = 18–23 years), and 10 students (5 females, 5 males; mean age = 22.8 years, range = 20–26 years) participated in Experiments 1a through 1d, respectively. They received course credits or money for their participation. All participants were naive as to the purpose of the experiment. In each of Experiments 1a, 1b, and 1d, the data of 1 participant were excluded from analyses because the participant had an overall proportion of correct responses near chance level (.50, .53, and .51, respectively).
Design and procedure
Experiments were run in a dimly lit room. Participants were seated 80 cm from the monitor and wore headphones. Each trial began with a white fixation dot (0.08°, 95.36 cd/m2) presented for 1,000 ms at the center of the screen. Participants then viewed a changing visual display consisting of black (< 0.5 cd/m2) and white (95.36 cd/m2) discs (radius = 0.65°) on a gray (10.10 cd/m2) background. In Experiments 1a, 1c, and 1d, there were 24 discs, and in Experiment 1b, the set size was 16 or 24 discs (50% of the trials each, in random order). Polarity was randomly determined for each disc at the start of a trial. All discs were randomly placed on an imaginary circle (radius = 6.5°) around the fixation dot. In Experiments 1a, 1b, and 1d, the displays changed every 150 ms. In Experiment 1c, the interval was either 150 ms or 200 ms (50% of the trials each, in random order). The total number of display changes on a given trial was randomly determined (9–17), and each display change consisted of a randomly determined number of discs (1–8) changing polarity (from black to white or the reverse).
In Experiments 1a, 1b, and 1c, the penultimate display change was always accompanied by a synchronous sound, a 60-ms, 500-Hz tone. In Experiment 1d, it could instead be accompanied by a displaywide visual cue. The visual cue was a set of two green concentric rings (0.1° wide; inner ring: radius = 5.72°; outer ring: radius = 7.28°) that were presented for 60 ms and surrounded the array of discs. The onset of the auditory and visual cues was synchronized with the polarity change of the discs. In Experiments 1a and 1d, the number of discs that changed polarity in synchrony with the cue (i.e., the number of visual events) was varied from 1 to 8. In Experiments 1b and 1c, the number of visual events was 1, 2, 3, 4, or 8.
After all polarity changes, the display became static, and a probe was presented (a red circle; radius = 0.5°; 16.89 cd/m2), either on one of the target discs (valid probe) or on a nontarget disc (invalid probe). Probe validity was 50%. Participants were asked to press the “j” key on the computer keyboard when the probe was valid and the “n” key when the probe was invalid. The dependent variable was the proportion correct.
In Experiment 1a, number of visual events and probe validity were randomly mixed within 10 blocks of 48 trials. In Experiment 1b, set size, number of visual events, and probe validity were randomly mixed within 10 blocks of 80 trials. In Experiment 1c, SOA, number of visual events, and probe validity were randomly mixed within 10 blocks of 80 trials. In Experiment 1d, number of visual events and probe validity were randomly mixed within 14 blocks of 48 trials. Cue modality (auditory vs. visual) was manipulated between blocks, in counterbalanced, alternating order, and participants were informed about the cue modality prior to each block.
Prior to the experimental blocks, participants received five practice blocks of 16 trials each (number of visual events was fixed to 1). After each practice or experimental block, participants received feedback about their overall proportion correct.
Model fitting
The proportion correct, p, was derived from Equations 1 and 2 with capacity K as the free parameter, which was optimized by minimizing the root-mean-square error (RMSE, the root of the averaged squared differences) between the model and the data. The model had one variable, n, which followed the number of visual events (1–8). Fitting was done within Microsoft Excel Solver and was initiated from several starting values of K. The outcome with the smallest RMSE was selected. The model was fitted to each individual’s data.
Results
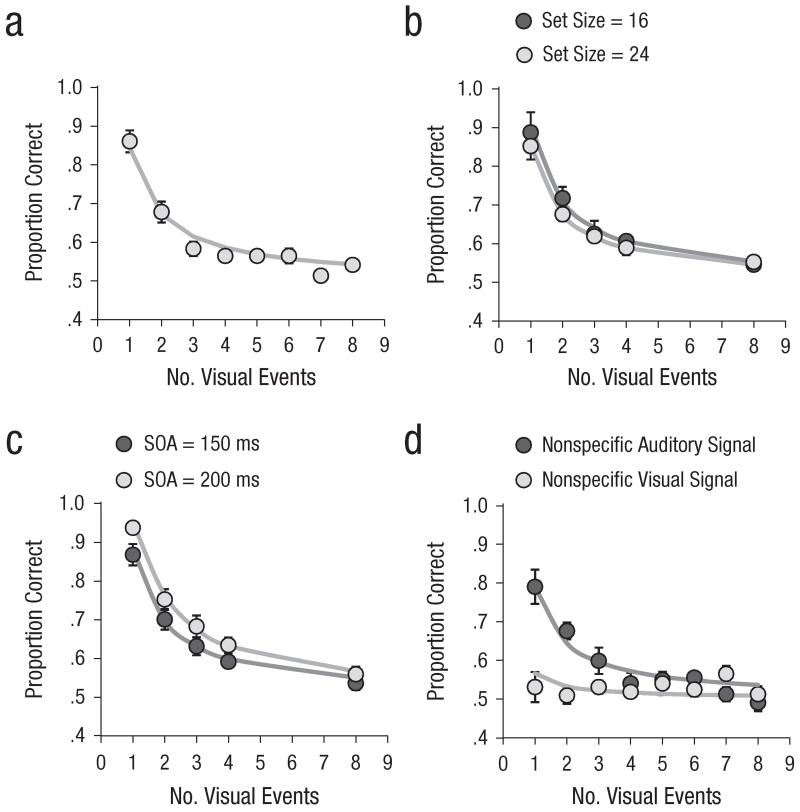
The results of Experiment 1 are presented in Figure 3. Results from practice blocks were excluded from analyses. The figure suggests good model fit, as was confirmed by low RMSEs (0.036–0.060). Overall R2 was high, at .86 to .92.
Fig. 3.
Results of Experiment 1: mean proportion correct (circles) and model fit (solid lines) as a function of number of visual events in (a) Experiment 1a, (b) Experiment 1b, (c) Experiment 1c, and (d) Experiment 1d. Results are shown separately for the two set sizes in Experiment 1b, the two stimulus onset asynchronies (SOAs) in Experiment 1c, and the two cue modalities in Experiment 1d. The error bars represent the overall standard errors of individuals’ mean proportion correct (some error bars are too small to be visible here).
In Experiment 1a, the overall proportion correct was .61 (false alarm rate = .13). An analysis of variance (ANOVA) revealed a reliable main effect of the number of visual events, F(7, 49) = 45.9, p < .001, as the proportion correct decreased with increasing number of visual events. On average, the estimated capacity was smaller than 1 (0.69; range = 0.48–0.95).
In Experiment 1b, the overall proportion correct was .67 (false alarm rate = .09). An ANOVA with set size and number of visual events as within-subjects variables yielded a reliable main effect of the number of visual events, F(4, 24) = 53.5, p < .001. The set-size effect and the two-way interaction failed to reach significance, ps ≥ .19. On average, the capacity was 0.84 when the set size was 16 (range = 0.47–1.22) and 0.71 when the set size was 24 (range = 0.54 to 0.95); set size did not have a reliable effect on estimated capacity, p > 0.1.
In Experiment 1c, the overall proportion correct was .69 (false alarm rate = .09). An ANOVA with SOA and number of visual events as within-subjects variables revealed reliable main effects of the number of visual events, F(4, 28) = 99.0, p < .001, and SOA, F(1, 7) = 37.0, p < .001. Overall proportion correct was better when the SOA was 200 ms (.71) than when the SOA was 150 ms (.61). The two-way interaction was not reliable (F < 1). On average, the capacity was 0.79 when the SOA was 150 ms (range = 0.44–1.13) and 1.05 when the SOA was 200 ms (range = 0.70–1.56). This difference in capacity was reliable, t(7) = 5.2, p = .001.
In Experiment 1d, the overall proportion correct was .56 (false alarm rate = .25). An ANOVA with cue modality and number of visual events as within-subjects variables yielded a reliable main effect of the number of visual events, F(7, 56) = 7.0, p < .001. The main effect of cue modality and the two-way interaction were also reliable, F(1, 8) = 14.3, p = .005, and F(7, 56) = 13.3, p < .001, respectively. Participants were able to use the nonspecific information in the visual cues, as performance was better than chance level in this condition, t(8) = 2.5, p < .05. However, the estimated capacity was better when auditory signals accompanied the targets (0.58; range = 0.24–0.85) than when visual signals accompanied the targets (0.13; range = 0–0.36), t(8) = 6.5, p < .001. Thus, the benefits of audiovisual cues go beyond temporal warning alone.
Discussion
The results show that even though participants could reliably detect a single visual event presented in synchrony with an auditory signal (confirming Van der Burg et al., 2008b), overall performance declined dramatically when more than one visual event was synchronized with the sound. More specifically, the model fits lead to the conclusion that at most one visual event can be linked to a sound at a time. The set-size manipulation had no effect on audiovisual capacity, whereas a slower rate of display change did reliably improve capacity. This latter effect was likely due to the reduced likelihood of misbindings (i.e., binding the sound with a distractor disc instead of with a target disc; see Van der Burg et al., 2010, for a detailed discussion). However, even under these conditions, the capacity of audiovisual orienting did not exceed 1.
The results are unlikely due to general temporal cuing or warning effects. As we have shown before, such effects have a different time course than audiovisual-integration effects (Van der Burg et al., 2008b). Moreover, in Experiment 1d, a general cue of a visual nature (i.e., a cue that, like the sound cue, was not specific to any of the items) yielded little to no benefit in performance (i.e., the proportion correct and capacity were both low). Thus, simple temporal knowledge about when to expect the target events was insufficient for detecting the synchronized targets. Instead, we suggest that the capacity limit in the audiovisual condition reflects the capacity limit of binding an auditory signal to a visual event (Van der Burg et al., 2011).
Experiment 2
Although the results of Experiment 1 point toward a dramatically lower capacity for audiovisual orienting compared with standard visual orienting, we considered the possibility that the capacity of visual orienting itself might be low with the dynamic displays we used. Thus, our goal in Experiment 2 was to directly compare audiovisual and visual capacity for each participant. Audiovisual capacity was determined as in Experiment 1a. Visual capacity was determined by measuring performance in almost precisely the same task, except that target discs were indicated by a brief change in color instead of a synchronous sound. Thus, unlike in Experiment 1d, the visual signal was specific to the target items.
In addition to comparing absolute capacity estimates in the audiovisual and visual tasks, we were able to examine individual differences in capacity. As has been found in past studies of on-line visual capacity, we observed considerable variation across observers in the number of positions that captured attention in the audiovisual and visual conditions (see, e.g., Awh et al., 2007; Cowan, 1995; Kane, Bleckley, Conway, & Engle, 2001). Our findings regarding individual differences provide insight into the question of whether the audiovisual limitations we observed were in fact caused by visual limitations. If this were the case, then one might expect a positive correlation between audiovisual capacity and visual capacity.
Method
Sixteen students (10 females, 6 males; mean age = 22.5 years, range = 19–29 years) participated in Experiment 2. The experiment was identical to Experiment 1a, except that we included a visual condition to determine visual capacity. In this condition, in the penultimate display change, the target discs became temporarily (i.e., for 150 ms) green, until the next display change. The task in this visual condition was identical to the task in the audiovisual condition. Number of visual events and probe validity were randomly mixed within 14 blocks of 48 trials. Cue modality (audiovisual vs. visual) was manipulated between blocks, in counterbalanced, alternating order. Participants were informed about the modality prior to each block.
Results and discussion
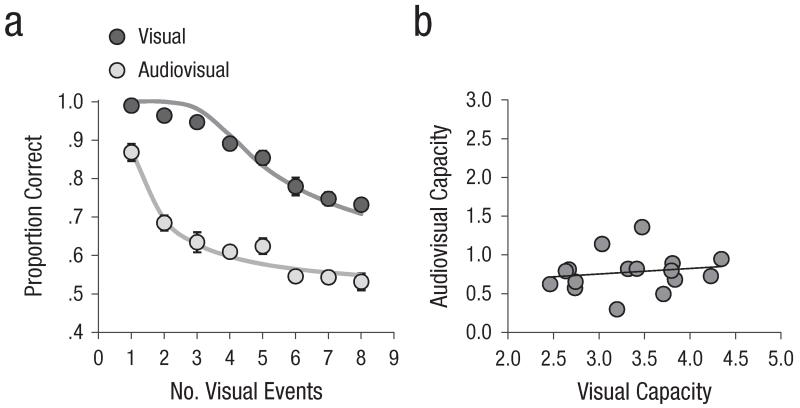
The results of Experiment 2 are presented in Figure 4. Overall proportion correct was .75 (false alarm rate = .14). Data were subjected to an ANOVA with cue modality and number of visual events as within-subjects variables. The ANOVA yielded a reliable main effect of the number of visual events, F(7, 105) = 80.2, p < .001. The main effect of cue modality and the two-way interaction were also reliable, F(1, 15) = 475.6, p < .001, and F(7, 105) = 7.1, p < .001, respectively. On average, audiovisual capacity was 0.78 (range = 0.30–1.36), whereas visual capacity was 3.34 (range = 2.64–4.34); the difference between these two estimates was reliable, t(15) = 16.5, p < .001. The overall RMSE (0.056) was low. Figure 4b presents audiovisual capacity as a function of visual capacity for each participant. The Pearson correlation between audiovisual and visual capacity was low (.13, p > .6).
Fig. 4.
Results of Experiment 2: (a) mean proportion correct (circles) and model fit (solid lines) as a function of number of visual events for each modality (visual vs. audiovisual) and (b) audiovisual capacity as a function of visual capacity (circles represent results for individual participants, and the solid line represents the trend line corresponding to the correlation between audiovisual capacity and visual capacity). The error bars represent the overall standard errors of individuals’ mean proportion correct (some error bars are too small to be visible here).
This experiment corroborates the idea that audiovisual capacity is limited to 1 and that the severe audiovisual limit observed in Experiment 1 was not a by-product of limitations in visual orienting capacity. Our results are consistent with past estimates of on-line visual capacity, as we observed a visual capacity greater than 3 (see also Cowan, 2001; Luck & Vogel, 1997; Pashler, 1988); in addition, there was no note-worthy correlation between visual capacity and the capacity to bind visual stimuli to a sound.
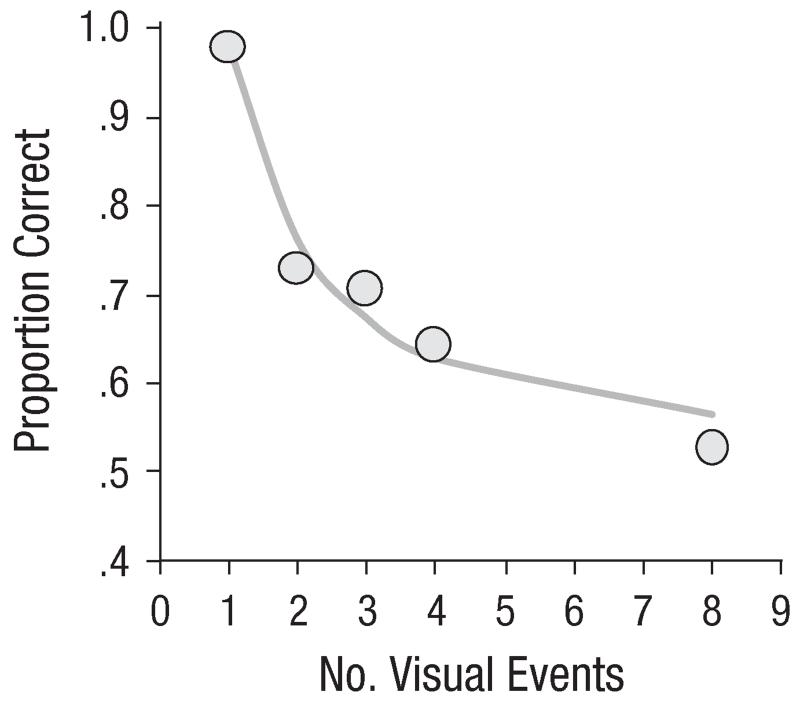
One might argue that the low capacity estimate in the audiovisual condition was due to the fact that the audiovisual events were less salient than the cues that were used in the visual task, rather than to qualitatively different capacities for audiovisual and visual orienting. One argument against cue salience as the determining factor for capacity is illustrated in Figure 5, which shows performance for 8 participants (from different experiments) who, during their entire experimental session, made at most one error in the audiovisual condition on trials with a single target. Thus, these observers found it very easy to detect one audiovisual event. Yet even for these observers, performance dropped steeply when there was more than one such event, such that their average capacity across all trials was estimated at 1.05.
Fig. 5.
Overall performance (and model fit) for 8 participants (Experiments 1 and 2) who performed at ceiling (≤ 1 error) when a single visual event was synchronized with the tone.
General Discussion
Even though participants could reliably detect a single visual event that was in synchrony with a sound (as in Van der Burg et al., 2008b), overall performance declined substantially when more than one visual event was synchronized with the auditory signal. As Experiment 2 showed, this decline was not due to a limitation in visual orienting capacity per se.
Our results for visual orienting capacity fall in line with the three- to four-item limit that has previously been observed using a wide array of experimental approaches (Cowan, 2001). Nevertheless, the estimated capacity for detecting audiovisual events did not exceed 1 (M = 0.75 across all experiments). Note that the capacity estimation model we used explicitly assumes that there are no encoding limits or attentional lapses affecting performance, and thus likely leads to a slight under-estimation of the real visual and audiovisual capacities. However, even when such lapses or difficulties were assumed to be negligible (for the data underlying Fig. 5), audiovisual capacity still did not exceed 1. It is clear that audiovisual integration capacity is severely limited compared with visual orienting capacity.
The question remains why the capacity to bind visual events to a sound is limited to at most one visual event. Rather than this merely being an information processing limitation, there may be a more adaptive, functional reason for it: A capacity of one object is consistent with the visual system being tuned to the fact that in natural environments, a sound in principle does not originate from more than one visual source. It therefore makes sense to bind a sound to only one object. Such binding is also consistent with the finding that participants perceive temporally aligned audiovisual events as coming from the same source object even when they are presented from discordant locations (i.e., the ventriloquism illusion; Alais & Burr, 2004; Thomas, 1941).
If only one of multiple visual candidates is going to be associated with a sound, which one is integrated with it? One possibility is that the auditory signal is integrated with what happens to be the most dominant or salient synchronized visual event at that moment. This possibility could be tested by systematically manipulating the relative salience of these events. Another possibility is that one object happens to be more attended than others at the time the sound is presented, and the sound then attaches to that object. For example, research has indicated that audiovisual integration in multiple-object displays occurs largely automatically (Matusz & Eimer, 2011; Van der Burg et al., 2008a, 2008b; Van der Burg et al., 2011), but that this automaticity is nevertheless partly dependent on the size of the attentional window (Van der Burg, Olivers, & Theeuwes, 2012). The more observers distribute their attention across the display, the more likely they are to detect the single visual event that was synchronized with the auditory signal, whereas focusing on a central location appears to be more detrimental. Therefore, it may be the case that in the current experiments, integration occurred for the single most attended object in the display, at the expense of other synchronized objects.
We conclude that the visual system not only has an intra-sensory capacity limitation (a maximum of three to four objects), but also has a separate, and even stricter, intersensory limitation such that attention is captured by only one audiovisual event at a time. We propose that this limitation occurs early in the processing chain (see, e.g., Van der Burg et al., 2011; Giard & Peronnét, 1999), independently of limits in purely visual selection.
Footnotes
Declaration of Conflicting Interests
The authors declared that they had no conflicts of interest with respect to their authorship or the publication of this article.
References
- Alais D, Burr D. The ventriloquism effect results from near-optimal bimodal integration. Current Biology. 2004;14:257–262. doi: 10.1016/j.cub.2004.01.029. [DOI] [PubMed] [Google Scholar]
- Awh E, Barton B, Vogel EK. Visual working memory represents a fixed number of items, regardless of complexity. Psychological Science. 2007;18:622–628. doi: 10.1111/j.1467-9280.2007.01949.x. [DOI] [PubMed] [Google Scholar]
- Beierholm U, Kording KP, Shams L, Ma WJ. Advances in neural information processing systems. Vol. 20. MIT Press; Cambridge, MA: 2009. Comparing Bayesian models of multisensory cue combination without mandatory integration; pp. 81–88. [Google Scholar]
- Cavanagh P, Alvarez GA. Tracking multiple targets with multifocal attention. Trends in Cognitive Sciences. 2005;9:349–354. doi: 10.1016/j.tics.2005.05.009. [DOI] [PubMed] [Google Scholar]
- Chen YC, Spence C. The crossmodal facilitation of visual object representations by sound: Evidence from the backward masking paradigm. Journal of Experimental Psychology: Human Perception and Performance. 2011;37:1784–1802. doi: 10.1037/a0025638. [DOI] [PubMed] [Google Scholar]
- Colonius H, Diederich A. Multisensory interaction in saccadic reaction time: A time-window-of-integration model. Journal of Cognitive Neuroscience. 2004;16:1000–1009. doi: 10.1162/0898929041502733. [DOI] [PubMed] [Google Scholar]
- Cowan N. Attention and memory: An integrated framework. Oxford University Press; New York, NY: 1995. [Google Scholar]
- Cowan N. The magical number 4 in short-term memory: A reconsideration of mental storage capacity [Target article and commentaries] Behavioral & Brain Sciences. 2001;24:87–185. doi: 10.1017/s0140525x01003922. [DOI] [PubMed] [Google Scholar]
- Giard MH, Peronnét F. Auditory-visual integration during multimodal object recognition in humans: A behavioral and electrophysical study. Journal of Cognitive Neuroscience. 1999;11:473–490. doi: 10.1162/089892999563544. [DOI] [PubMed] [Google Scholar]
- Jack CE, Thurlow WR. Effects of degree of visual association and angle of displacement on the “ventriloquism” effect. Perceptual & Motor Skills. 1973;37:967–979. doi: 10.1177/003151257303700360. [DOI] [PubMed] [Google Scholar]
- Kane MJ, Bleckley MK, Conway ARA, Engle RW. A controlled-attention view of working-memory capacity. Journal of Experimental Psychology: General. 2001;130:169–183. doi: 10.1037//0096-3445.130.2.169. [DOI] [PubMed] [Google Scholar]
- Klaver P, Talsma D, Wijers AA, Heinze HJ, Mulder G. An event-related brain potential correlate of visual short-term memory. NeuroReport. 1999;10:2001–2005. doi: 10.1097/00001756-199907130-00002. [DOI] [PubMed] [Google Scholar]
- Luck SJ, Hillyard SA. Spatial filtering during visual search: Evidence from human electrophysiology. Journal of Experimental Psychology: Human Perception and Performance. 1994;20:1000–1014. doi: 10.1037//0096-1523.20.5.1000. [DOI] [PubMed] [Google Scholar]
- Luck SJ, Vogel EK. The capacity of visual working memory for features and conjunctions. Nature. 1997;390:279–281. doi: 10.1038/36846. [DOI] [PubMed] [Google Scholar]
- Matusz PJ, Eimer M. Multisensory enhancement of attentional capture in visual search. Psychonomic Bulletin & Review. 2011;18:904–909. doi: 10.3758/s13423-011-0131-8. [DOI] [PubMed] [Google Scholar]
- Ngo MK, Spence C. Auditory, tactile, and multisensory cues facilitate search for dynamic visual stimuli. Attention, Perception, & Psychophysics. 2010;72:1654–1665. doi: 10.3758/APP.72.6.1654. [DOI] [PubMed] [Google Scholar]
- Pashler H. Familiarity and visual change detection. Perception & Psychophysics. 1988;44:369–378. doi: 10.3758/bf03210419. [DOI] [PubMed] [Google Scholar]
- Pylyshyn Z. Visual indexes, preconceptual objects, and situated vision. Cognition. 2001;80:127–158. doi: 10.1016/s0010-0277(00)00156-6. [DOI] [PubMed] [Google Scholar]
- Slutsky DA, Recanzone GH. Temporal and spatial dependency of the ventriloquism effect. NeuroReport. 2001;12:7–10. doi: 10.1097/00001756-200101220-00009. [DOI] [PubMed] [Google Scholar]
- Soto-Faraco S, Kingstone A, Spence C. Multisensory contributions to the perception of motion. Neuropsychologia. 2003;41:1847–1862. doi: 10.1016/s0028-3932(03)00185-4. [DOI] [PubMed] [Google Scholar]
- Sperling G. The information available in brief visual presentations. Psychological Monographs: General and Applied. 1960;74(11):1–29. [Google Scholar]
- Thomas GJ. Experimental study of the influence of vision on sound localization. Journal of Experimental Psychology. 1941;28:167–177. [Google Scholar]
- Trick LM, Pylyshyn ZW. Why are small and large numbers enumerated differently? A limited-capacity preattentive stage in vision. Psychological Review. 1994;101:80–102. doi: 10.1037/0033-295x.101.1.80. [DOI] [PubMed] [Google Scholar]
- Van der Burg E, Cass J, Olivers CNL, Theeuwes J, Alais D. Efficient visual search from synchronized auditory signals requires transient audiovisual events. PLoS ONE. 2010;5(5):e10664. doi: 10.1371/journal.pone.0010664. Retrieved from http://www.plosone.org/article/info%3Adoi%2F10.1371%2Fjournal.pone.0010664. [DOI] [PMC free article] [PubMed] [Google Scholar]
- Van der Burg E, Olivers CNL, Bronkhorst AW, Theeuwes J. Audiovisual events capture attention: Evidence from temporal order judgments. Journal of Vision. 2008a;8(5) doi: 10.1167/8.5.2. Article 2. Retrieved from http://www.journalofvision.org/content/8/5/2.full. [DOI] [PubMed] [Google Scholar]
- Van der Burg E, Olivers CNL, Bronkhorst AW, Theeuwes J. Pip and pop: Non-spatial auditory signals improve spatial visual search. Journal of Experimental Psychology: Human Perception and Performance. 2008b;34:1053–1065. doi: 10.1037/0096-1523.34.5.1053. [DOI] [PubMed] [Google Scholar]
- Van der Burg E, Olivers CNL, Bronkhorst AW, Theeuwes J. Poke and pop: Tactile-visual synchrony increases visual saliency. Neuroscience Letters. 2009;450:60–64. doi: 10.1016/j.neulet.2008.11.002. [DOI] [PubMed] [Google Scholar]
- Van der Burg E, Olivers CNL, Theeuwes J. The attentional window modulates capture by audiovisual events. PLoS ONE. 2012;7(7):e39137. doi: 10.1371/journal.pone.0039137. Retrieved from http://www.plosone.org/article/info%3Adoi%2F10.1371%2Fjournal.pone.0039137. [DOI] [PMC free article] [PubMed] [Google Scholar]
- Van der Burg E, Talsma D, Olivers CNL, Hickey C, Theeuwes J. Early multisensory interactions affect the competition among multiple visual objects. NeuroImage. 2011;55:1208–1218. doi: 10.1016/j.neuroimage.2010.12.068. [DOI] [PubMed] [Google Scholar]
- Vogel EK, Machizawa MG. Neural activity predicts individual differences in visual working memory capacity. Nature. 2004;428:748–751. doi: 10.1038/nature02447. [DOI] [PubMed] [Google Scholar]
- Wright RD. Shifts of visual attention to multiple simultaneous location cues. Canadian Journal of Experimental Psychology. 1994;48:205–217. doi: 10.1037/1196-1961.48.2.205. [DOI] [PubMed] [Google Scholar]
- Yantis S, Johnson DN. Mechanisms of attentional priority. Journal of Experimental Psychology: Human Perception and Performance. 1990;16:812–825. doi: 10.1037//0096-1523.16.4.812. [DOI] [PubMed] [Google Scholar]


