Abstract
Globally, more than 800 million people are undernourished while >2 billion people have one or more chronic micronutrient deficiencies (MNDs). More than 6% of global mortality and morbidity burdens are associated with undernourishment and MNDs. Here we show that, in 2011, 3.5 and 1.1 billion people were at risk of calcium (Ca) and zinc (Zn) deficiency respectively due to inadequate dietary supply. The global mean dietary supply of Ca and Zn in 2011 was 684 ± 211 and 16 ± 3 mg capita−1 d−1 (±SD) respectively. Between 1992 and 2011, global risk of deficiency of Ca and Zn decreased from 76 to 51%, and 22 to 16%, respectively. Approximately 90% of those at risk of Ca and Zn deficiency in 2011 were in Africa and Asia. To our knowledge, these are the first global estimates of dietary Ca deficiency risks based on food supply. We conclude that continuing to reduce Ca and Zn deficiency risks through dietary diversification and food and agricultural interventions including fortification, crop breeding and use of micronutrient fertilisers will remain a significant challenge.
Food security is essential to human wellbeing1,2,3,4 and a central component of the Millennium Development Goals (MDGs) of the United Nations (UN)5. Food security exists when “all people, at all times, have physical, social and economic access to sufficient safe and nutritious food that meets their dietary needs and food preferences for an active and healthy life”4 and therefore includes consideration of the macro and micro-nutrient components of the diet. For example, >800 million people are undernourished6, and >2 billion people are likely to be at risk of one or more micronutrient deficiencies (MNDs), notably the minerals Ca, iodine (I), iron (Fe), selenium (Se), Zn, and vitamins (e.g. vitamin A)1,3,7,8,9,10. Micronutrients have pivotal roles in human health and MNDs can retard growth and cognitive development, impair immunological functioning and increase the risks of non-communicable diseases including skeletal, cardiovascular and metabolic disorders10,11. It has been estimated that Fe and Zn deficiency reduce the Gross Domestic Product (GDP) of developing countries by 2–5%1. Although the estimated prevalence of inadequate dietary energy supply decreased from 18.7% to 11.3% at global and 23.4% to 13.5% for developing countries between 1990/2 and 2011/146, trends in MNDs for all essential mineral nutrients at various geospatial scales have not been quantified over this period.
Determining the prevalence of MNDs is challenging12. For some micronutrients (e.g. Fe, I, Se, Zn), body tissues or urine can be analysed directly for micronutrients and micronutrient-responsive enzymes9,10,13. Where reliable tissue biomarkers are lacking and for larger population sizes, MND risks can be quantified from dietary analyses or surveys incorporating food composition data14. However, many countries lack nationally-representative surveys and food composition tables. Data from surveys are also affected by behavioural change and systematic misreporting15. The Food and Agriculture Organization (FAO) of the United Nations (UN) uses national food balance sheets (FBSs) as a proxy for food consumption to estimate the global prevalence of undernourishment16. The FBSs of the FAO are currently available from 1961–201117 and represent net per capita food supply calculated from national production, trade, transport losses, storage, non-food uses, livestock feed, etc., but with no adjustment for household waste or inter- and intra-household variation in access to food18. Per capita micronutrient supply can be estimated by multiplying the edible portion of each food item (derived from energy values provided by the FAO in kcal capita−1 d−1)7 by its micronutrient concentration compiled in food composition tables19,20. The per capita supply of a mineral is then compared to a demographically-weighted requirement threshold for a population, termed the WtdEAR, which represents the daily intake that meets the requirements of half the healthy individuals in that population21,22. FBS and food composition data were used to estimate a global prevalence of dietary Zn deficiency of 17% in 2003–077, however, the prevalence of dietary Ca deficiency has not previously been reported.
Here, the prevalence of Ca and Zn deficiency risks and their recent temporal trends were determined for 145 countries with populations >1 million. Food supply data (see Supplementary Table S1 online) for 94 food items (see Supplementary Table S2 online) between 1992 and 2011 were integrated with food composition data for Ca and Zn from the United States Department of Agriculture19, and phytate data from Tanzania20 (see Supplementary Table S3 online). Food composition data were assumed to remain constant over time and location. Intakes of Ca and Zn were based on per capita supply adjusted for edible portions using per capita energy supply data (see Supplementary Table S4 online). An inter-individual coefficient of variation of 25% was applied to net food supply7,8,22. Demographic (age and gender distributions) data were obtained from the UN Department of Economic and Social Affairs Population Division23 (see Supplementary Table S5 online). A single WtdEAR per country was estimated for each element and year from World Health Organization (WHO) vitamin and mineral requirements data21 (see Supplementary Table S6 online). Thus, the WtdEAR changes slightly between countries and years due to the difference in the population composition and size of the various countries although the EAR for each age/gender group did not change with time. Those with intakes of Ca and Zn less than the WtdEAR were classed as being at risk of dietary deficiency. This approach assumes (1) minimal correlation between requirement and intake, (2) that the distribution of requirement is symmetrical around the WtdEAR, (3) that the variability in intake is greater than the variability in requirement8,12. Data were analysed and visualised using Microsoft Excel 2013, Microsoft Access 2013, IBM SPSS Statistics 21, Tableau Software 8.2, and ArcGIS 10.2.1. For regional-, continental- and global-level analyses, national-level data were weighted by the population size of each country.
Results and discussion
The supplies and deficiency risks of Ca and Zn are presented at various spatial (global, continental, regional and country), and temporal (from 1992 to 2011) scales (means ± SD unless stated).
Calcium supply and deficiency risk
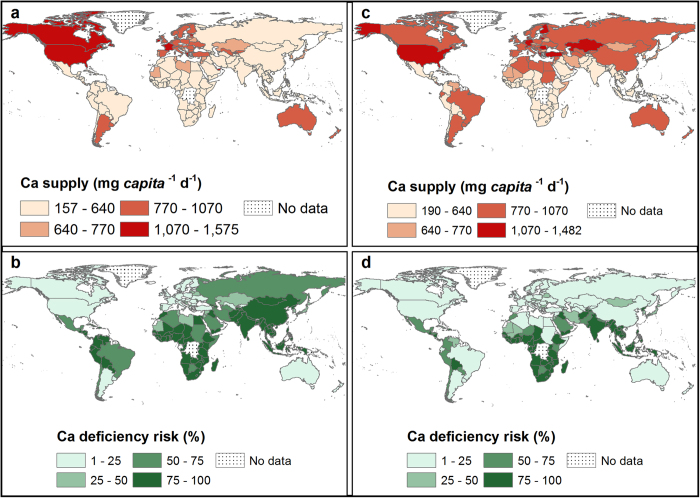
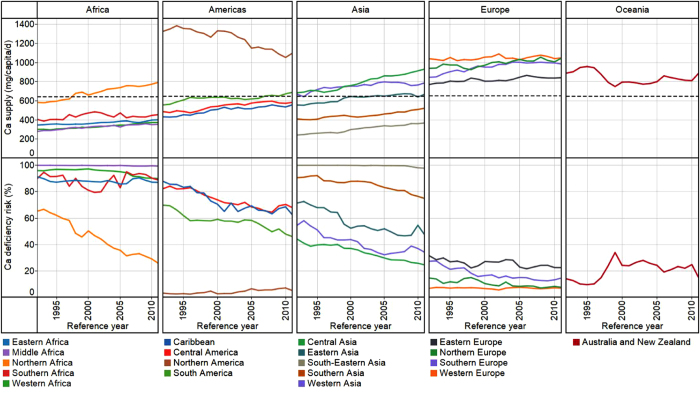
At a global scale, in 2011, Ca supply was 684 ± 211 mg capita−1 d−1 and Ca deficiency risk was 51 ± 32% (3.5 billion people). In 1992, Ca supply was 547 ± 230 mg capita−1 d−1 and Ca deficiency risk was 76 ± 23% (4.1 billion people) (see Supplementary Table S7 online). These reflect an overall increase in global food supply between 1992 and 201124,25. In 2011, the WtdEAR for Ca at a global level was 644 ± 3 mg d−1. At a continental scale, Ca supply in 2011 was 474 ± 188, 858 ± 234, 639 ± 223, 982 ± 130, and 936 ± 50 mg capita−1 d−1 for Africa, Americas, Asia, Europe, and Oceania respectively (see Supplementary Table S8 online). The mean Ca deficiency risk in 2011 was 80 ± 31, 29 ± 27, 57 ± 36, 11 ± 7 and 11 ± 4% for Africa, Americas, Asia, Europe and Oceania respectively (see Supplementary Table S8 online). Regionally, Ca supply in 2011 ranged from 356 ± 295 mg capita−1 d−1 in South-Eastern Asia to 1126 ± 269 mg capita−1 d−1 in Northern America, representing Ca deficiency risks of 98 ± 3 and 4 ± 1% (Figs. 1 and 2 and see Supplementary Table S9 online). At a country level, Ca supply ranged from 157 mg capita−1 d−1 in Mozambique in 1992 to 1640 mg capita−1 d−1 in the United States of America in 1994 (Supplementary Table S6). In 1992, 86 out of 137 countries had Ca deficiency risk >50%, which decreased to 69 out of 145 countries in 2011 (Fig. 1; and see Supplementary Table S6 online).
Figure 1. Ca supply (mg capita−1 d−1) and deficiency risk (%).
Calcium supply in 1992 (a) and 2011 (c). Calcium deficiency risk in 1992 (b) and 2011 (d). Country boundaries were downloaded from the GADM Global Administrative Areas database (http://gadm.org/, Version 2, January 2012). Thematic mapping of Ca supply and deficiency risk was carried out in ArcGIS 10.2.1.
Figure 2. Regional temporal trends in population-weighted mean Ca supply (mg capita−1 d−1) and deficiency risk (%) between 1992 and 2011.
The horizontal broken lines represent the average WtdEAR for Ca. Line graphs were drawn using Tableau Software for Desktop version 8.2.
To our knowledge, these are the first global estimates of dietary Ca deficiency risks based on data for food supply, food composition, demography and EAR. In a study conducted in Africa by Joy et al.12, the deficiency risk of Ca was estimated to be 54%, compared to our estimate of 82% in 2009. This disparity can be attributed to the different food composition table used by Joy et al.12 because similar food supply, demographic and EAR data were used. However, there is general agreement about the existence of high Ca deficiency risk in Africa between the two studies. Interestingly, in a recent analysis of all age- sex- and country-specific groups from 187 countries26 (4862 observations), the median Ca intake was 611 (third-quintile range 553-658) mg capita d−1. These data are based on dietary recall surveys of milk consumption, as a proxy for Ca intake, but are remarkably consistent with our estimates of mean Ca intake based on food supply26.
Animal products were the major sources of dietary Ca, but there is variation between regions (see Supplementary Fig. S1 online). For example, in Central, North and South America, Central Asia, Europe, and Oceania, 50–70% of dietary Ca supply was from animal products. Fruits and vegetables contributed 10–40% of dietary Ca supply, but had a higher contribution in some regions (e.g., >50% in Eastern Asia, see Supplementary Fig. S1 online). Cereals contributed little Ca to the diet. The changes in the proportional dietary sources of Ca between 1992 and 2011 was small in most of the regions, reflecting food production and supply systems that are generally consistent over the time period.
Given the high prevalence of Ca deficiency risks, an important question is whether these translate into detrimental health outcomes such as rickets, which can be caused by vitamin D and/or Ca deficiency, or osteoporosis. A review by Pettifor27 indicated that nutritional rickets was more prevalent in infants and children in developing countries where the diet is based on cereal staples and the phytate content is high. In mid-latitude countries, where there is adequate sunlight to enable the production of vitamin D in the skin, rickets is mainly attributed to Ca deficiency unless exposure to sun is limited due to religious and cultural reasons28. Norhaizan and Nor Faizadatul29 reported 2.4 million cases of osteoporosis due to Ca deficiency in Malaysia in 2009, where Ca deficiency is likely to be prevalent based on Ca supply. It is noteworthy that when Ca intakes are low, the efficiency of Ca homeostasis can increase through reduced Ca excretion, thereby enabling populations with low intake of Ca to maintain a healthy skeleton and teeth30. Conversely, in populations with high intakes of animal products with high calcium and protein, and high sodium intakes, urinary Ca excretion increases balancing the plasma Ca30,31. Hence the manifestations of Ca deficiency risk in the form of rickets and osteoporosis may not be as conspicuous as the observed Ca deficiency risks. Clearly, there are many complex issues surrounding dietary Ca deficiency risk, which warrant much further investigation.
Zinc supply and deficiency risk
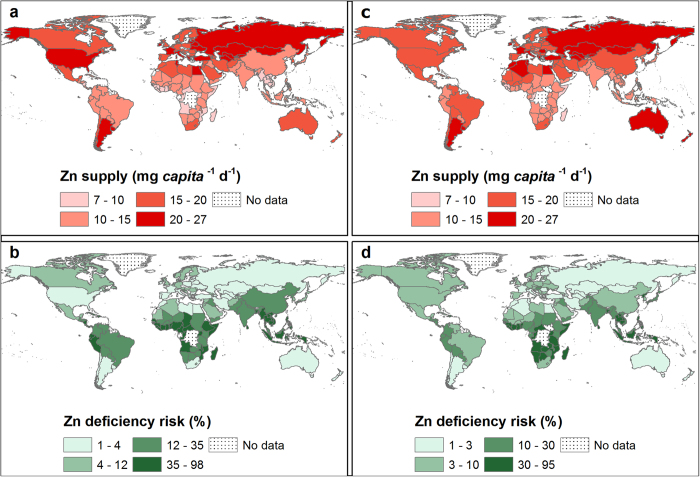
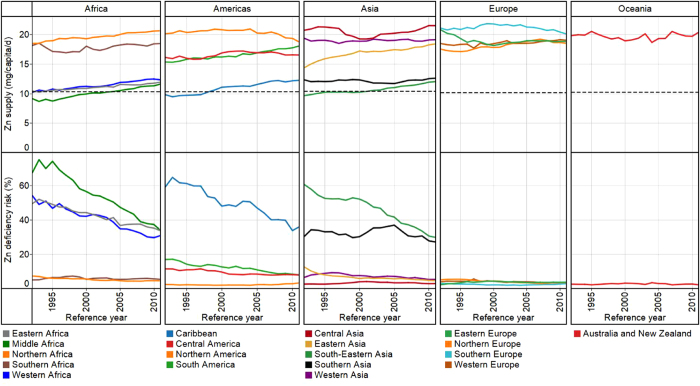
At a global scale, in 2011, Zn supply was 16 ± 3 mg capita−1 d−1 and Zn deficiency risk was 16 ± 14% (1.1 billion people). In 1992, Zn supply was 15 ± 3 mg capita−1 d−1 and Zn deficiency risk was 22 ± 19% (1.2 billion people) (see Supplementary Table S7 online). As seen for Ca, these data reflect an overall increase in global food supply between 1992 and 201124,25. In 2011, the WtdEAR for Zn at a global level was 10.3 ± 0.1 mg capita−1 d−1. At a continental scale, Zn supply in 2011 was 14 ± 4, 18 ± 3, 15 ± 4, 19 ± 2, and 20 ± 0 mg capita−1 d−1 for Africa, Americas, Asia, Europe, and Oceania respectively (see Supplementary Table S8 online). The mean Zn deficiency risk in 2011 was 25 ± 20%, 7 ± 10%, 17 ± 14%, 3 ± 2%, and 2 ± 0% for Africa, Americas, Asia, Europe and Oceania respectively. Regionally, Zn supply in 2011 ranged from 12 ± 6 mg capita−1 d−1 in Caribbean to 22 ± 7 mg capita−1d−1 in Central Asia, Zn deficiency risks ranged from 2 ± 0% in Australia and New Zealand to 36 ± 38% in Caribbean (Figs. 3 and 4 and see Supplementary Table S9 online). At country level, Zn supply ranged from 6 mg capita−1 d−1 in Rwanda in 1998 to 28 mg capita−1 d−1 in Uruguay in 1994, representing Zn deficiency risks of ~100% and 1% respectively (see Supplementary Table S6 online). In 1992, 48 out of 137 countries had Zn deficiency risk >25%, which decreased to 39 out of 145 countries in 2011 (Fig. 3 and see Supplementary Table S6 online).
Figure 3. Zn supply (mg capita−1 d−1) and deficiency risk (%).
Zinc supply in 1992 (a) and 2011 (c). Zinc deficiency risk in 1992 (b) and 2011 (d). Country boundaries were downloaded from the GADM Global Administrative Areas database (http://gadm.org/, Version 2, January 2012). Thematic mapping of Zn supply and deficiency risk was carried out in ArcGIS 10.2.1.
Figure 4. Regional temporal trends in population-weighted mean Zn supply (mg capita−1 d−1) and deficiency risk (%) between 1992 and 2011.
The horizontal broken lines represent the average WtdEAR for Zn. Line graphs were drawn using Tableau Software for Desktop version 8.2.
Our estimate of Zn deficiency risk (20%) is comparable to Wessells et al.7,32 global estimate of 17.3% in 2003-07 where they accounted for the impact of various factors to Zn absorption in their model. Joy et al.12 estimated the Zn deficiency risk for Africa in 2009 to be 40% as compared to our estimate of 26%. This discrepancy, as for Ca, is due to the different food composition data used.
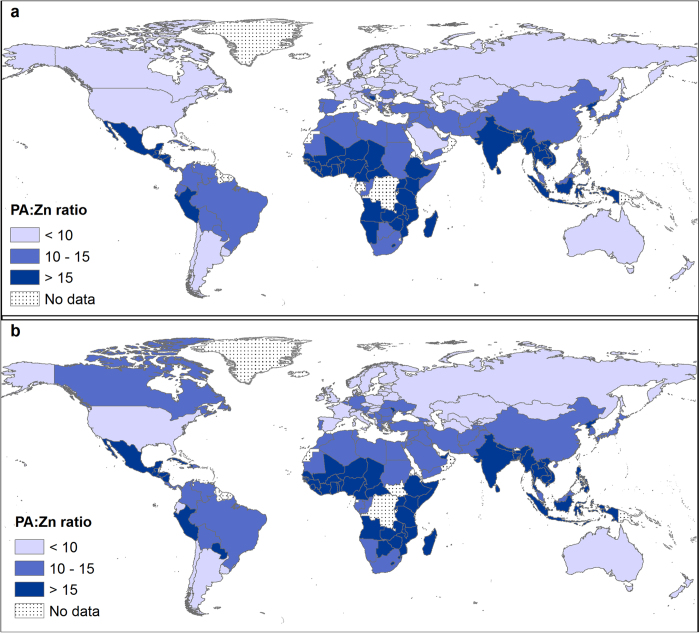
Dietary sources of Zn varied across regions. Animal products were the major sources of Zn (>40%) in North Africa; North and South America; North, South and West Europe; and Australia and New Zealand. In other regions, the major source of Zn was cereals (see Supplementary Fig. S1 online). The prevalence of deficiency risk and utilization of Zn is influenced by the quantity of Zn intake, and the overall dietary composition that either promotes or antagonises Zn bioavailability7,32,33. Among the anti-nutrient factors that reduce the absorption of Zn is the phytate (myoinositol hexakisphosphate). Phytate chelates with mono and divalent cations such as Zn. Due to the absence of intestinal digestive phytases, humans cannot digest phytate and hence chelated Zn cannot be utilized34,35. In 2011, dietary phytate supply ranged from 997 in Ecuador to 4179 mg capita−1 d−1 in Niger and 25-80% of the Zn supply in all regions originated from cereals which have high phytate content (see Supplementary Fig. S1, and Supplementary Table S6 online). Phytate:Zn (PA:Zn) ratios ranged between 5 and 27 (Fig. 5). Phytate:Zn ratio for most countries in this study were >15, the critical threshold level beyond which Zn absorption is considered to be inhibited35,36,37,38. This will compound the Zn deficiency risk of the population due to lower bioavailability13,33. Populations relying on plant-sourced foods with low Ca and Zn are also vulnerable to toxic metals that have similar properties to Ca and Zn, for example cadmium (Cd)39. Deficiencies in Ca and Zn may lead to organ accumulation and retention of dietary Cd40.
Figure 5.
Phytate:Zn (PA:Zn) molar ratio in 1992 (a) and 2011 (b), based on per capita PA and Zn supplies. Country boundaries were downloaded from the GADM Global Administrative Areas database (http://gadm.org/, Version 2, January 2012). Thematic mapping of PA:Zn ratio was carried out in ArcGIS 10.2.1.
Per capita income, Ca and Zn supplies, and deficiency risks
Calcium and Zn supplies were highly positively correlated with per capita Gross National Income based on purchasing power parity (GNI-PPP), across all countries and years (Table 1). Countries with lower GNI-PPP had higher Ca and Zn deficiency risks than those with high per capita GNI-PPP (see Supplementary Table S10 online), with strong positive correlations observed between GNI-PPP and Ca and Zn supplies (Table 1). These relationships imply that those living in countries with higher GNI-PPP purchase or produce more animal products, fruits, legumes and vegetables than those with lower GNI-PPP, which is consistent with observations from household surveys14. The green revolution of the 1960s was supported by high rates of investment in research on staple foods (mainly wheat, rice and maize)41,42. Lower-yielding cereal and legume landraces that were potentially better sources of essential micronutrients (e.g., Fe, Zn, Ca, and potassium) have generally been replaced with higher yielding cereal varieties43,44. This general decline in agro-biodiversity might therefore have compounded MNDs42.
Table 1. Relationship between Ca, Zn and energy supply, phytate:Zn molar ratio, and GNI-PPP.
| Ca supply | Zn supply | Phytate: Zn | GNI-PPP | |
|---|---|---|---|---|
| Zn supply | 0.817** | |||
| Phytate:Zn | −0.775** | −0.714** | ||
| GNI-PPP | 0.755** | 0.604** | −0.682** | |
| Energy supply | 0.832** | 0.770** | −0.641** | 0.825** |
Based on 2655 data points from 1992-2011 (see Supplementary Table S10 online).
**Spearman’s Rank Correlation is significant at P ≤ 0.01. GNI-PPP is gross national income converted to international dollars using purchasing power parity rates. An international dollar has the same purchasing power as a US Dollar in the US.
Calcium and Zn deficiency risks and Millennium Development Goal 1
At a global scale, if the Millennium Development Goal 1 (MDG1)5 target to halve hunger by 2015 is framed in terms of Ca deficiency risks, the 76% risk observed in 1992 should have decreased to 46% in 2011. However, the Ca deficiency risk was 51% in 2011. For Zn, the 22% risk in 1992 should have decreased to 13% in 2011 but was 16%. National level reductions in Ca and Zn deficiency risks were uneven. By 2011, 101 and 86 countries were not on target to halve Ca and Zn deficiency risks, respectively, by 2015 (see Supplementary Table S11 online). Out of these; 34, 19, 26, 20, and 2 countries fell short of halving Ca deficiency risks and 22, 14, 22, 26, and 2 countries fell short of halving Zn deficiency risks, from Africa, Americas, Asia, Europe and Oceania respectively.
Conclusion and limitations
In 2011, 3.5 and 1.1 billion people were at risk of Ca and Zn deficiency respectively. To our knowledge, these are the first global estimates of dietary Ca deficiency risks based on food supply. Our estimates of Zn deficiency risks are consistent with recent studies7,32. Supplies and deficiency risks of Ca and Zn differed geographically with countries in Asia and Africa accounting for >90% of the estimated Ca and Zn deficiency risks. At higher spatial resolution, differences in Ca and Zn supplies and deficiency risks between individual countries become pronounced.
This study uses data from several sources, each of which has its limitations. For example, food supply data are aggregated at national level with a fixed coefficient of variation in intake. Such data do not capture community and household level socio-economic factors which systematically affect intake, nor food wastage at a household level, nor seasonal variation in the type and quantity of food supply. All of these factors will, of course, affect deficiency risks for Ca and Zn. In addition, the rise in awareness of the roles that mineral micronutrients play in human health has led to increased research and development to biofortify food crops with micronutrients45,46,47,48,49,50,51,52,53. This may lead to change in the food composition in addition to future increases in food supply due to improvement in crop yields. However, the impact of changes in food composition on the reduction of deficiency risk of Ca and Zn due to fortification either through agronomic interventions or breeding could not be captured by this study mainly due to a lack of temporal, spatial, and varietal food composition data. Similarly, the effect of Ca fortification in cereals and milk is not addressed in this study due to lack of data. Therefore, whilst the information presented here can inform policy in a general sense, such analyses would become more useful at higher geospatial resolution (for example, at subnational levels). Further research could include assessing the health, and nutritional status of various age/gender/socioeconomic groups through biochemical, clinical and anthropometric measurements in countries with high deficiency risks of Ca and Zn21. Development of localized food composition tables and updating existing ones with information on new/under-utilised food crop varieties is crucial to improve the accuracy of estimating deficiency risks of Ca and Zn.
Possible solutions to Ca and Zn deficiency include: supplementation, direct fortification9,50, fertiliser application51,52,53 and plant breeding46. Supplementation is crucial in situations that require short term actions with high impact, for example, for pregnant women. However, supplementation and direct fortification of foodstuffs with Ca and Zn may not be economically feasible and cannot reach the majority of the population in developing countries who produce their own food42. Under such circumstances, agronomic intervention by applying Zn fertiliser either through foliar routes or to the soil can help increase the composition of Zn in food crops53. Similarly, breeding interventions through developing food crop varieties with the ability to absorb and accumulate more Zn and Ca from the soil and translocate them to the edible parts, or with lower phytate composition54, can potentially be pursued to increase the bioavailability of these nutrients. In addition, the production and provision of affordable animal products, and education on how to reduce the impact of phytate in plant source foods on Zn bioavailability (for example, soaking, germination, and fermentation) are essential22. We conclude that continuing to reduce Ca and Zn deficiency risks through dietary diversification42 and food and agricultural interventions including fortification9, crop breeding46 and use of micronutrient fertilisers49,53 will remain a significant challenge in the post-Millennium Development Goals (MDGs) era.
Materials and Methods
Food supply, food composition, Estimated Average Requirements (EARs) for Ca and Zn, and demographic data were compiled to assess global dietary Ca and Zn supplies and deficiency risks between 1992 and 2011. A total of 145 countries with population >1 million were included in this study. The EAR “cut-point” (EAR-CP) method was used to assess the prevalence of Ca and Zn deficiency risks.
Data sources
The four major datasets required for this research were food supply, food composition, EARs for Ca and Zn, and demographic data for each country. Food supply data from 1992 to 2011 were obtained from FAOSTAT17. Food composition data for Ca and Zn were obtained from the United States Department of Agriculture National Nutrient Database for Standard Reference 26 (USDA SR26) which was released in 201319, and the phytate composition of foods were obtained from the Tanzanian food composition table (TFC)20. The EAR for Ca and Zn were obtained from the FAO/WHO Human Vitamin and Mineral Requirements21. Demographic data were obtained from the United Nations, Department of Economic and Social Affairs Population Division, Population Estimates and Projection web page23. These data were compiled and integrated in to MS Access relational database management system to assess global dietary Ca and Zn supplies and deficiency risks.
Calcium and zinc supply
The 94 food items from FAOSTAT17 food supply data, reported in g capita−1 d−1, were matched55 with the food commodities in the nutrient composition data in the USDA SR26 food composition database (see Supplementary Table S2 online). Nutrient composition data were assumed to not change between 1992 and 2011. Per capita Ca and Zn supply was estimated by multiplying the edible portion of each food item (derived from energy values provided by the FAO in kcal capita−1 d−1)7,18. Calcium and Zn supply from each food commodity was summed to obtain the per capita nutrient supply (PCNS) per day for every reference year and country.
Calcium and zinc intakes and requirements
Calcium and Zn intakes were estimated to be the per capita Ca and Zn supply with a coefficient of variation of 25%7,32,56. The EAR was estimated and available for a given age and gender groups21. As supply data were available for the whole population at national level, the EAR was converted to single WtdEAR (Equation 1) based on the population size in each age and gender group for each country and year23. The EAR for a given age/gender group was assumed to remain unchanged while the WtdEAR varied with the population composition and size. The WtdEAR for Ca and Zn is a per capita intake level that fulfils the Ca and Zn needs of half of the apparently healthy individuals of the population in a given country in a specific year.
Estimated average requirement “cut-point” (EAR-CP)
Historical Ca and Zn deficiency risks were assessed using the EAR-CP as described and used by Carriquiry57, Joy et al.55 and Wuehler et al.8. The EAR-CP method provides an estimate of the number of people in a given country and year with intakes of Ca and Zn below the WtdEAR, which is termed as the deficiency risk in this paper. The EAR-CP method has been applied with the following underlying assumptions: little correlation between requirement and intake, the distribution of requirement is symmetrical around the EAR, and variability in intake is greater than the variability in requirement22,57,58.
Calculation of molar ratio of phytate:Zn
The dietary PA composition of the food items was obtained from the TFC20 and the PA supply for each country across the years was estimated by applying similar methods as for Ca and Zn supplies. Thence, the daily molar ratio of PA:Zn was calculated by dividing the molar intake of PA (molecular weight = 660 g mol−1) by the molar intake of Zn (molecular weight = 65.4 g mol−1).
Data analyses and visualisation
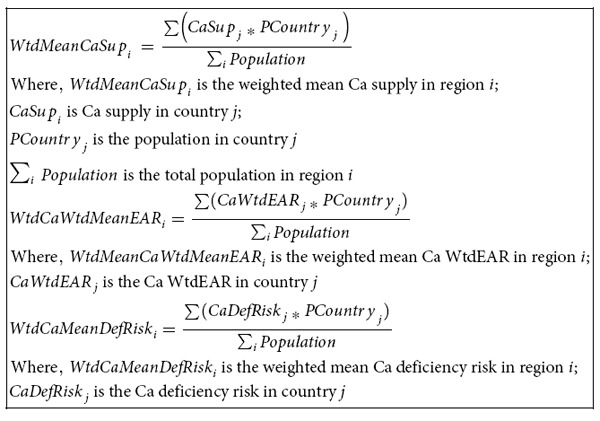
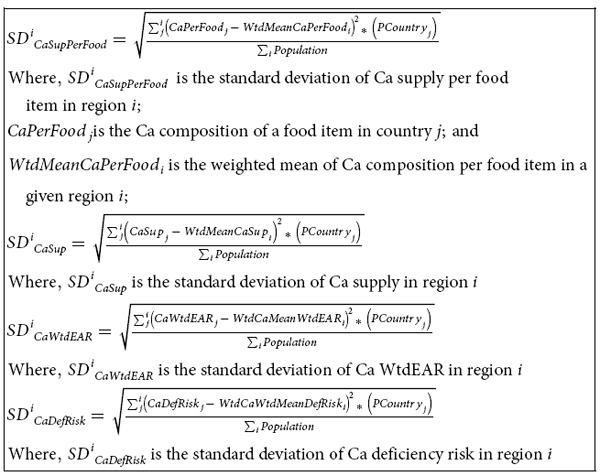
Descriptive statistics calculations were conducted in MS Excel. Visualisations were carried out in Tableau Software for desktop version 8.2, and ArcGIS 10.2.1. Correlation analyses was carried out using IBM SPSS Statistics version 21. The EAR, and aggregations of results (mean and standard deviations) at global, regional, and continental levels were weighted by the population sizes of the member countries (Equation 1) and (Equation 2).
Equation (1): Derivation of the weighted estimated average requirement (WtdEAR) for Ca and Zn.
 |
Equation (2): Aggregation of mean (a) and standard deviation (b) of supply, WtdEAR, and deficiency risk of Ca at regional level as an example.
a) Derivation of the mean of aggregated information at regional level.
 |
b) Derivation of the standard deviation of aggregated information at regional level.
 |
Additional Information
How to cite this article: Kumssa, D. B. et al. Dietary calcium and zinc deficiency risks are decreasing but remain prevalent. Sci. Rep. 5, 10974; doi: 10.1038/srep10974 (2015).
Supplementary Material
Acknowledgments
We thank Crops for the Future Crops for the Future for funding D.B.K.’s studentship.
Footnotes
Author Contributions D.B.K., M.R.B., E.L.A. and E.J.M.J. designed the study. D.B.K. collated the data, designed and developed the database, carried out data analyses and produced the initial draft of the manuscript. M.J.W., S.D.Y. and S.W. contributed to drafting the manuscript.
References
- Stein A. J. Rethinking the measurement of undernutrition in a broader health context: Should we look at possible causes or actual effects? Global Food Secur. 3, 193–199 (2014). [Google Scholar]
- FAO, IFAD & WFP. The state of food insecurity in the World: The multiple dimensions of food security. (Food and Agriculture Organization of the United Nations, International Fund for Agricultural Development, World Food Programme, Rome, 2013). [Google Scholar]
- Lim S. S. et al. A comparative risk assessment of burden of disease and injury attributable to 67 risk factors and risk factor clusters in 21 regions, 1990–2010: a systematic analysis for the Global Burden of Disease Study 2010. Lancet 380, 2224–2260 (2013). [DOI] [PMC free article] [PubMed] [Google Scholar]
- FAO. Rome declaration on World food security. (1996). Available at: http://www.fao.org/wfs/index_en.htm. (Accessed: 27 October 2014).
- UN. The Millennium Development Goals report 2013 (New York, 2013). [Google Scholar]
- FAO. The state of food insecurity in the World. (Food and Agriculture Organization of the United Nation, Rome, 2014). [Google Scholar]
- Wessells K. R. & Brown K. H. Estimating the global prevalence of zinc deficiency: results based on zinc availability in national food supplies and the prevalence of stunting. PloS ONE 7, e50568 (2012). [DOI] [PMC free article] [PubMed] [Google Scholar]
- Wuehler S. E., Peerson J. M. & Brown K. H. Use of national food balance data to estimate the adequacy of zinc in national food supplies: methodology and regional estimates. Public Health Nutr. 8, 812–819 (2005). [DOI] [PubMed] [Google Scholar]
- Zimmermann M. B. Iodine deficiency and excess in children: worldwide status in 2013. Endocr. Pract 19, 839–846 (2013). [DOI] [PubMed] [Google Scholar]
- Fairweather-Tait S. J. et al. Selenium in human health and disease. Antioxid. Redox. Signal. 14, 1337–1383 (2011). [DOI] [PubMed] [Google Scholar]
- WHO & FAO. Diet, nutrition and the prevention of chronic diseases: report of a joint WHO/FAO expert consultation, Geneva, 28 January-1 February 2002. Report No. WHO Technical Report Series 916, (World Health Organization, 2003). [PubMed] [Google Scholar]
- Joy E. J. M. et al. Dietary mineral supplies in Africa. Physiol. Plant. 151, 208–229 (2014). [DOI] [PMC free article] [PubMed] [Google Scholar]
- Gibson R. S. Principles of nutritional assessment. (Oxford University Press, 2005). [Google Scholar]
- Ecker O. & Qaim M. Analyzing nutritional impacts of policies: an empirical study for Malawi. World Dev. 39, 412–428 (2011). [Google Scholar]
- Archer E., Hand G. A. & Blair S. N. Validity of U.S. nutritional surveillance:National Health and Nutrition Examination Survey caloric energy intake data, 1971-2010. PLoS ONE 8, e76632 (2013). [DOI] [PMC free article] [PubMed] [Google Scholar]
- de Haen H., Klasen S. & Qaim M. What do we really know? Metrics for food insecurity and undernutrition. Food Policy 36, 760–769, (2011). [Google Scholar]
- FAO. FAOSTAT: Food supply. (2014). Available at: http://faostat3.fao.org/faostat-gateway/go/to/home/E. (Accessed: 20 June 2014).
- FAO. Food balance sheets: A handbook. (Food and Agriculture Organization of the United Nations, 2001). [Google Scholar]
- USDA. USDA National nutrient database for standard reference, release 26. (2013). Available at: http://www.ars.usda.gov/ba/bhnrc/ndl (Accessed: 20 November 2013).
- Lukmanji Z. et al. Tanzania food composition tables. (Muhimbili University of Health and Allied Sciences, Tanzania Food and Nutrition Centre and Harvard School of Public Health, 2008). [Google Scholar]
- WHO & FAO. Vitamin and mineral requirements in human nutrition. 2nd edn, (World Health Organization and Food and Agriculture Organization of the United Nations, 2004). [Google Scholar]
- IOM. Dietary reference intakes: applications in dietary assessment. (The National Academies Press, 2000). [PubMed] [Google Scholar]
- UN. World population prospects: The 2012 revision. (2013). Available at: http://esa.un.org/unpd/wpp/Excel-Data/population.htm. (Accessed: November 2013).
- Porkka M., Kummu M., Siebert S. & Varis O. From food insufficiency towards trade dependency: a historical analysis of global food availability. PLoS ONE 8, e82714 (2013). [DOI] [PMC free article] [PubMed] [Google Scholar]
- Remans R., Wood S. A., Saha N., Anderman T. L. & DeFries, R. S. Measuring nutritional diversity of national food supplies. Global Food Secur. 3, 174–182 (2014). [Google Scholar]
- Imamura F. et al. Dietary quality among men and women in 187 countries in 1990 and 2010: a systematic assessment. Lancet Glob. Health 3, e132–e142 (2015). [DOI] [PMC free article] [PubMed] [Google Scholar]
- Pettifor J. M. Vitamin D &/or calcium deficiency rickets in infants & children: a global perspective. Indian J. Med. Res. 127, 245–249 (2008). [PubMed] [Google Scholar]
- Gupta A. Vitamin D deficiency in India: prevalence, causalities and interventions. Nutrients 6, 729–775 (2014). [DOI] [PMC free article] [PubMed] [Google Scholar]
- Norhaizan M. & Ain Nor Faizadatul, A. Determination of phytate, iron, zinc, calcium contents and their molar ratios in commonly consumed raw and prepared food in Malaysia. Malays. J. Nutr. 15, 213–222 (2009). [PubMed] [Google Scholar]
- Nordin B. E. Calcium and osteoporosis. Nutrition 13, 664–686 (1997). [DOI] [PubMed] [Google Scholar]
- Umaretiya P. J., Thacher T. D., Fischer P. R., Cha S. S. & Pettifor J. M. Bone mineral density in Nigerian children after discontinuation of calcium supplementation. Bone 55, 64–68 (2013). [DOI] [PubMed] [Google Scholar]
- Wessells K. R., Singh G. M. & Brown K. H. Estimating the global prevalence of inadequate zinc intake from national food balance sheets: effects of methodological assumptions. PLoS ONE 7, e50565 (2012). [DOI] [PMC free article] [PubMed] [Google Scholar]
- Gibson R. S. A historical review of progress in the assessment of dietary zinc intake as an indicator of population zinc status. Adv. Nutr. 3, 772–782 (2012). [DOI] [PMC free article] [PubMed] [Google Scholar]
- Kumar V., Sinha A. K., Makkar H. P. S. & Becker K. Dietary roles of phytate and phytase in human nutrition: A review. Food Chem. 120, 945–959 (2010). [Google Scholar]
- Ma G. et al. Phytate intake and molar ratios of phytate to zinc, iron and calcium in the diets of people in China. Eur. J. Clin. Nutr. 61, 368–374 (2007). [DOI] [PubMed] [Google Scholar]
- Bindra G. S., Gibson R. S. & Thompson L. U. [Phytate][calcium]/[zinc] ratios in Asian immigrant lacto-ovo vegetarian diets and their relationship to zinc nutriture. Nutr. Res. 6, 475–483 (1986). [Google Scholar]
- Ellis R. et al. Phytate:zinc and phytate X calcium:zinc millimolar ratios in self-selected diets of Americans, Asian Indians, and Nepalese. J. Am. Diet. Assoc. 87, 1043–1047 (1987). [PubMed] [Google Scholar]
- Adams C. L. et al. Zinc absorption from a low-phytic acid maize. Am. J. Clin. Nutr. 76, 556–559 (2002). [DOI] [PubMed] [Google Scholar]
- Reeves P. G. & Chaney R. L. Marginal nutritional status of zinc, iron, and calcium increases cadmium retention in the duodenum and other organs of rats fed rice-based diets. Environ. Res. 96, 311–322 (2004). [DOI] [PubMed] [Google Scholar]
- Lalor G. C. Review of cadmium transfers from soil to humans and its health effects in the Jamaican environment. Sci. Total Environ. 400, 162–172, (2008). [DOI] [PubMed] [Google Scholar]
- Khush G. S. Green revolution: the way forward. Nat. Rev. Genet. 2, 815–822 (2001). [DOI] [PubMed] [Google Scholar]
- Pingali P. L. Green Revolution: Impacts, limits, and the path ahead. Proc. Natl Acad. Sci. USA 109, 12302–12308 (2012). [DOI] [PMC free article] [PubMed] [Google Scholar]
- Welch R. M. & Graham R. D. A new paradigm for world agriculture: meeting human needs: productive, sustainable, nutritious. Field Crops Res. 60, 1–10 (1999). [Google Scholar]
- Khoury C. K. et al. Increasing homogeneity in global food supplies and the implications for food security. Proc. Natl Acad. Sci. USA 111, 4001–4006 (2014). [DOI] [PMC free article] [PubMed] [Google Scholar]
- Yang X.-E., Chen W.-R. & Feng Y. Improving human micronutrient nutrition through biofortification in the soil–plant system: China as a case study. Environ. Geochem. Health 29, 413–428 (2007). [DOI] [PubMed] [Google Scholar]
- Cakmak I. Enrichment of cereal grains with zinc: agronomic or genetic biofortification? Plant Soil 302, 1–17 (2008). [Google Scholar]
- Zhao F.-J. & McGrath S. P. Biofortification and phytoremediation. Curr. Opin. Plant Biol. 12, 373–380 (2009). [DOI] [PubMed] [Google Scholar]
- Bouis H. E. & Welch R. M. Biofortification - a sustainable agricultural strategy for reducing micronutrient malnutrition in the global south. Crop Sci. 50, S20–S32 (2010). [Google Scholar]
- Rahman M. M. et al. Selenium biofortification in lentil (Lens culinaris Medikus subsp. culinaris): Farmers’ field survey and genotype×environment effect. Food Res. Int. 54, 1596–1604 (2013). [Google Scholar]
- Yip R. The challenge of improving iron nutrition: limitations and potentials of major intervention approaches. Eur. J. Clin. Nutr. 51 Suppl 4, S16–24 (1997). [PubMed] [Google Scholar]
- White P. J. & Broadley M. R. Biofortification of crops with seven mineral elements often lacking in human diets – iron, zinc, copper, calcium, magnesium, selenium and iodine. New Phytol. 182, 49–84 (2009). [DOI] [PubMed] [Google Scholar]
- Broadley M. R. & White P. J. Eats roots and leaves. Can edible horticultural crops address dietary calcium (Ca), magnesium (Mg) and potassium (K) deficiencies in humans? Proc. Nutr. Soc. 69, 601–612 (2010). [DOI] [PubMed] [Google Scholar]
- Joy E. J. M. et al. Zinc-enriched fertilisers as a potential public health intervention in Africa. Plant Soil 389, 1–24 (2015). [Google Scholar]
- Raboy V. Approaches and challenges to engineering seed phytate and total phosphorus. Plant Sci. 177, 281–296 (2009). [Google Scholar]
- Stadlmayr B. et al. INFOODS guidelines for food matching. (Food and Agriculture Organization, Rome, 2011). [Google Scholar]
- Joy E. J. M. et al. Risk of dietary magnesium deficiency is low in most African countries based on food supply data. Plant Soil 368, 129–137 (2012). [Google Scholar]
- Carriquiry A. L. Assessing the prevalence of nutrient inadequacy. Public Health Nutr. 2, 23–33 (1999). [DOI] [PubMed] [Google Scholar]
- Murphy S. P. & Poos M. I. Dietary reference intakes: summary of applications in dietary assessment. Public Health Nutr. 5, 843–849 (2002). [DOI] [PubMed] [Google Scholar]
Associated Data
This section collects any data citations, data availability statements, or supplementary materials included in this article.


