

Abstract
Mutations in the leucine-rich repeat kinase 2 (LRRK2) gene are the most common known genetic cause of Parkinson's disease, and LRRK2 is also linked to Crohn's and Hansen's disease. LRRK2 is expressed in many organs in mammals but is particularly abundant in the kidney. We find that LRRK2 protein is predominantly localized to collecting duct cells in the rat kidney, with much lower expression in other kidney cells. While genetic knockout (KO) of LRRK2 expression is well-tolerated in mice and rats, a unique age-dependent pathology develops in the kidney. The cortex and medulla of LRRK2 KO rat kidneys become darkly pigmented in early adulthood, yet aged animals display no overt signs of kidney failure. Accompanying the dark pigment we find substantial macrophage infiltration in LRRK2 KO kidneys, suggesting the presence of chronic inflammation that may predispose to kidney disease. Unexpectedly, the dark kidneys of the LRRK2 KO rats are highly resistant to rhabdomyolysis-induced acute kidney injury compared with wild-type rats. Biochemical profiling of the LRRK2 KO kidneys using immunohistochemistry, proteomic and lipidomic analyses show a massive accumulation of hemoglobin and lipofuscin in renal tubules that account for the pigmentation. The proximal tubules demonstrate a corresponding up-regulation of the cytoprotective protein heme oxygenase-1 (HO-1) which is capable of mitigating acute kidney injury. The unusual kidney pathology of LRRK2 KO rats highlights several novel physiological roles for LRRK2 and provides indirect evidence for HO-1 expression as a protective mechanism in acute kidney injury in LRRK2 deficiency.
Introduction
Genetic variation in the LRRK2 gene is linked to a number of diseases through genome-wide association studies including Parkinson's disease, Crohn's disease and Hansen's disease (1–5). The LRRK2 gene encodes a large multi-domain protein kinase with an ankyrin-like repeat region on the N-terminal side, a leucine-rich repeat region, a Rab-like GTPase domain, a tyrosine-kinase-like kinase domain and a WD40-like repeat domain near the C-terminus. Missense mutations in and near the LRRK2 enzymatic domains are the leading known genetic cause of late-onset Parkinson's disease (6,7). Enzymatically active LRRK2 kinase has a dimeric configuration and has been shown to auto-phosphorylate its own GTPase domain. This process is enhanced by pathological mutations, so therapeutics to reduce or ablate LRRK2 are under development (8–13). However, the physiological function of LRRK2 is still not clear, nor are the potential deleterious effects of reducing or ablating LRRK2 activity or expression (14,15).
LRRK2 is expressed in many cell types and tissues in mammals, with the highest expression in kidneys (16,17). To define the function of LRRK2 and its relationship to disease, and to understand the potential negative biological effects of inhibiting or ablating LRRK2, LRRK2 knockout (KO) rats and mice have been developed. Overall there is close homology between LRRK2 protein in mice (87% homology to humans) and rats (86% homology to humans), so phenotypes in KO animals provide a window into function that cannot be compensated for by other proteins. Several reports focusing on phenotypic analysis of LRRK2 KO mice and more recently rats have indicated that there are abnormalities in the kidney as well as homeostatic alterations of the immune system (17–22). In mice, progressive darkening of the kidneys begins as early as 6-months of age, although there is no evidence of overt kidney failure in LRRK2 KO mice aged 2 years (23). LRRK2 KO mice have an abnormal accumulation of α-synuclein (60-fold) along with other ubiquitinated proteins in the kidney, potentially due to defective lysosomal function (17).
Unanswered questions include the specific subset of renal cells that normally express LRRK2 protein, the nature of the dysfunction across the kidney due to the lack of LRRK2 expression in those cells, the source of pigmentation that develops over time, and whether the LRRK2 KO kidney phenotype represents a unique form of prodromal kidney disease that may render the kidney susceptible to injury. Through the course of our studies with LRRK2 KO rats in models of Parkinson's disease (24), we noticed that the dark pigmentation occurs in the LRRK2 KO rat kidney as early as 8 weeks post-natal, much earlier than in mice (19,23). To better understand the kidney pathology in LRRK2 KO rats, we challenged adult animals with heme-mediated glycerol-induced acute kidney injury (rhabdomyolysis) and found that the animals were surprisingly resistant to injury. To further understand the potential compensatory and protective mechanisms we defined and characterized the comparative morphological, biochemical and proteomic changes in LRRK2 KO rats. We report that LRRK2 KO kidneys are dark brown in color because of increases in hemoglobin, H-ferritin and abnormal accumulation of fucosylated glycans, which are the core constituents of lipofuscin. This accumulation of blood products triggers an up-regulation of cytoprotective factors like heme oxygenase-1 (HO-1), providing potential protection against kidney injury.
Results
LRRK2 KO rat kidneys show pigmentation but lack histological or morphological defects—localization of LRRK2 protein to kidney collecting duct cells
Compared with wild type (WT) kidneys, LRRK2 KO kidneys are dark brown in color with full pigmentation developed by 4 months (Fig. 1A). The entire thickness of the parenchyma of the LRRK2 KO kidney was dark brown in color with pigmentation preserved both in frozen optimal cutting temperature compound (OCT) as well as paraffin embedded blocks. In contrast, periodic acid-Schiff (PAS) and hematoxylin and eosin staining (H&E) demonstrated normal histological structure, including the glomeruli, in LRRK2 KO kidney sections (Fig. 1B and Supplementary Material, Fig. S1A). PAS staining of 12-month LRRK2 KO kidneys sections also demonstrated normal histology of the cortex, medulla and papilla with the exception of an increase in the number of mononuclear cells in the papilla and a more intense PAS stain (Supplementary Material, Fig. S1B). Previously, we developed an immunohistochemical protocol using optimized monoclonal antibodies to detect LRRK2 in the kidney (25,26). All LRRK2 antibodies have the propensity to detect other proteins although LRRK2 is the dominant species for several monoclonal antibodies when applied to rat tissue lysates (25). Application of the N241 monoclonal antibody to LRRK2 KO rat kidney lysates revealed two predominant LRRK2 isoforms of full-length protein (∼280 kDa) and a smaller truncated species (∼160 kDa) (Fig. 1C). These two isoforms are consistent with those detected in mouse kidney protein lysates using other LRRK2 antibodies (18). No LRRK2 protein could be detected in the LRRK2 KO lysates ensuring that the rats used in this study have no LRRK2 expression.
Figure 1.

Pigmentation in LRRK2 KO rats and LRRK2 localization in kidneys. (A) Discoloration in LRRK2 KO kidneys is apparent as early as 8 weeks post-natal. Shown are 4-month wild type (WT) and LRRK2 KO kidneys, cut in frozen optimal OCT that highlight the intense dark pigmentation in the LRRK2 KO cortex, with less pigment in the papilla and medulla. Twelve-month LRRK2 KO kidneys are comparably darker in color externally compared with WT kidneys. (B) PAS staining of 3-month WT and LRRK2 KO kidneys sections are shown. No morphological abnormalities or other evidence of kidney disease is apparent (see Supplementary Material, Fig. S1). Scale bar is 1 mm. (C) Western blot of total kidney protein lysates from 12-month-old WT and LRRK2 KO kidneys using anti-LRRK2 rabbit monoclonal antibody N241. LRRK2 can be detected as a ∼280 kDa species and a more intense ∼160 kDa isoform. (D–I) Images of immunofluorescence staining of LRRK2 (green color, C41-2 antibody) and Aquaporin-2, AQP2 (red color), from 5 µm thick cryosections of outer medulla and papilla from 3-month-old WT rat kidneys are shown. The most intense staining for LRRK2 (green) across the kidney localizes with the collecting duct marker AQP2 (red color, E and H). (J–L) Confocal images of matched LRRK2 KO sections cut in tandem and obtained with the same laser intensities as in panel D–I. Non-specific LRRK2 staining (green color) is punctate in appearance (magnification insets) whereas LRRK2 staining is diffuse (high magnification insets, panels G–I). All results shown are representative of at least three animals per group processed at the same time. Scale bar for D–F panels is 200 µm, G–L panels is 50 µm, and inset shows higher magnification of tubule cells.
To localize LRRK2 protein within the kidney, several markers were selected to define different kidney cell types including aquaporin-2 (AQP2, collecting duct cells), lotus tetragonolobus lectin (proximal tubules) and Na+K+ATPase alpha 1 subunit (high intensity in distal tubules). Immunofluorescence studies demonstrated that LRRK2 is specifically expressed in the renal collecting duct cells in the papilla and in the outer medulla (Fig. 1D–I). While we did see non-specific staining in the LRRK2 KO kidney with MJFF-C41-2 antibody, the LRRK2 signal was easily discernable from non-specific signal found in matched LRRK2 KO sections, and the distribution was consistent with immunohistochemical staining previously reported with the same antibody in the kidney (26). All of the specific LRRK2 signal co-localizes with the Aquaporin-2 signal, whereas the non-specific signal observed in both WT and LRRK2 KO sections does not (Fig. 1G–I, high magnification insets). LRRK2 expression in the cortical collecting ducts was much lower and difficult to resolve against non-specific background in the LRRK2 KO sections (Supplementary Material, Fig. S1C).
Increased macrophage infiltration in LRRK2 KO kidneys
Previous reports have indicated various and subtle alterations in immune system homeostasis in LRRK2 KO mice and rats (18,20–22,27). LRRK2 is expressed in myeloid cells of the innate immune system (24,28,29). Although morphologically the LRRK2 KO kidney appeared normal, PAS staining revealed increased numbers of mononuclear cells in the papillary region. Therefore, we used flow cytometry to quantify the number and proportion of bone marrow-derived cells in single-cell suspensions of enzymatically digested kidneys from male WT and LRRK2 KO rats. Cells were stained with the live/dead indicator, 7-aminoactinomycin D (7-AAD), and then characterized based on the rat surface markers CD45 (cluster of differentiation factor 45, leukocyte common antigen) and CD11b/c (ITGAM, CR3A, cluster of differentiation molecule 11).
LRRK2 KO kidneys exhibited ∼2-fold increase in the intra-renal CD45+ cell population as compared with WT kidneys (Fig. 2A). Further characterization of intra-renal CD45+ cells with CD11b/c demonstrated a modest but significant increase in the proportion of macrophages (defined as live cells, CD45+ and CD11b/c+) within the CD45+ cell population (Fig. 2B and C). We did not detect significant differences in the proportion of CD45+ CD11b/c+ cells in all other organs in LRRK2 KO rats including the liver, spleen, heart, testicles, blood, broncheo-alveolar lavage (BAL) fluid and bone marrow, compared with WT controls (Supplementary Material, Fig. S2). These data demonstrate that the tendency toward intra-organ macrophage accumulation in LRRK2 KO rats is specific to the kidney.
Figure 2.

Macrophages in LRRK2 KO kidneys. (A–E) Single cell suspensions were derived from enzymatically digested kidneys and analyzed by flow cytometry for the presence of intra-renal macrophages (CD45+ CD11b/c+). Cells were obtained from 4 WT and 5 LRRK2 KO rats. (A) Proportion of 7-AAD negative/CD45+ cells. (B) Representative flow cytometry histograms depicting the proportion of CD45+ staining positive for CD11b/c. (C) Graph showing a modest increase in the percentage of CD11b/c cells within 7-AAD negative/CD45+ cells obtained from the LRRK2 KO kidneys. (D) Immunofluorescence staining of CD68+ cells (green color) in 5 µm thick cryosections of cortex, medulla and papilla from 3-month-old WT and LRRK2 KO kidneys. Sale bar is 200 µm. (E) Semi-quantitative estimation of the number of CD68+ cells in cortex, medulla and papilla of WT and LRRK2 KO kidneys. Data are derived from 3 WT and 3 LRRK2 KO rats, at least five high power fields analyzed for cortex, medulla and papilla per animal. Higher magnification of a CD68+ cell (green) with blue-colored nucleus (DAPI) from (F) WT or (G) LRRK2 KO kidney sections. Scale bar for F and G is 15 µm. All column graphs depict group mean ± SEM, and *P < 0.05 (two-way Students T-test).
To identify the areas of macrophage accumulation in the kidney, we selected the myeloid cell marker CD68 (clone ED-1) that identifies phagocytic myeloid cells. CD68+ myeloid cells were quantified in WT and LRRK2 KO rat kidney sections. This approach corroborated the flow cytometry data, with an approximate doubling of CD68+ cells in LRRK2 KO sections (Fig. 2D and E). Figure 2F and G show higher magnification of a CD68+ cell (green) with blue-colored nucleus (DAPI) in WT and LRRK2 KO kidney sections.
LRRK2 KO rats are protected against heme-mediated glycerol-induced rhabdomyolysis
It is well established that phagocytic myeloid/macrophage cell infiltration influence kidney tubular damage, injury and repair by augmenting the inflammatory response (30–33). Macrophages are also considered critical in the progression of acute kidney injury for mediating inflammation or repair (33,34). Our data indicate that LRRK2 KO rat kidneys have increased CD68+ (immunohistochemistry) and CD45+/CD11b/c+ (flow-cytometry) macrophages. These results suggest that the LRRK2 KO kidneys may be inflamed and show different renal tubular damage and functional parameters when compared with WT kidneys (35). To test this hypothesis and further understand the impact of LRRK2 deficiency on kidney pathophysiology, we challenged 3-month LRRK2 KO male rats with glycerol-induced, heme-mediated acute kidney injury (rhabdomyolysis) and matched saline-injected animals as controls.
Baseline serum creatinine values in LRRK2 KO rodents have been described as normal, consistent with the lack of inherent kidney failure in these animals (18,27). To ensure that there were no baseline abnormalities in the rats used in this study, serum creatinine values for the WT and LRRK2 KO rats for Day 1 to Day 5 after saline injection (i.e., vehicle control) were measured and did not differ in between WT and LRRK2 KO rats (Fig. 3A). However, there was a striking difference in the renal function measured by serum creatinine levels for the WT versus LRRK2 KO rats Day 1 to Day 5 after 7.5 ml/kg of 50% glycerol injection (Day 1: WT, 1.59 ± 0.38 versus LRRK2 KO, 1.04 ± 0.14; day 2: WT, 2.13 ± 0.72 versus LRRK2 KO, 0.69 ± 0.10; Day 3: WT, 2.39 ± 0.96 versus LRRK2 KO, 0.50 ± 0.04; Day 4: WT, 2.03 ± 0.82 versus LRRK2 KO, 0.43 ± 0.04; Day 5: WT, 1.46 ± 0.55 versus LRRK2 KO, 0.39 ± 0.02 mg/dl, P < 0.05) (Fig. 3B). These results show that the LRRK2 KO rats were protected from injury. Levels of lactate dehydrogenase and creatine kinase at 24 h after glycerol injection were not significantly different between the WT and LRRK2 KO animals, indicating the same degree of muscle injury in both groups (Supplementary Material, Fig. S3).
Figure 3.

LRRK2 KO rats are protected against rhabdomyolysis. (A) Serum creatinine values measured after saline injection in 3-month WT and LRRK2 KO rats at baseline, Days 1, 2, 3, 4 and 5 post injections. Three WT and three LRRK2 KO rats are included in the saline-control group. (B) Serum creatinine values measured at baseline, Days 1, 2, 3, 4 and 5 after glycerol injections (7.5 ml/kg of 50% glycerol in water, half the dose injected in each anterior thigh; intramuscular injections) in 3-month WT and LRRK2 KO rats. Three WT rats and 5 LRRK2 KO rats are included in the glycerol-kidney injury group. *P < 0.05, two-way Student's T-test. (C) Semi-quantitative measurements of casts from PAS sections from WT and LRRK2 KO inner medulla treated with saline or glycerol. *P < 0.05; five high power fields analyzed each from three WT, three LRRK2 KO rats for saline injected group and three WT, five LRRK2 KO rats for glycerol injected group. (D–G) Representative PAS stained WT and LRRK2 KO outer medulla and (H and I) inner medulla kidney sections after 5 days of either saline or glycerol injections, as indicated. Scale bars are 200 µm for panels D–G, and 400 µm for H and I. Green arrows indicate the integrity of the brush border in the tubules. Inset shows the higher magnification of the tubule. Representative casts are indicated by arrow heads.
We also assessed the extent of injury by evaluating the loss of brush border in the proximal tubules and quantifying the number of tubular casts by examining PAS stained kidney sections. The number of casts for glycerol injected WT rats (61.6 ± 12.8) was significantly higher in the inner medulla as compared with LRRK2 KO rats (23.4 ± 4.7) (Fig. 3C, H and I). PAS stained kidney sections of the glycerol-injected WT and LRRK2 KO rats also revealed increased brush border loss in the proximal tubules of WT rats as compared with LRRK2 KO rats (Fig. 3F and G). The overall integrity of the brush border in the proximal tubules of the outer medulla in the saline injected WT and LRRK2 KO rats did not appear different (Fig. 3D and E). Overall, the LRRK2 KO kidneys exhibit less tubular damage and better renal function compared with age matched WT animals.
LRRK2 KO rat kidneys have distinct biochemical and proteomic profiles
In order to characterize the mechanism of protection from glycerol-induced acute kidney injury in the LRRK2 KO animals, we first explored protein changes in the LRRK2 KO kidneys. Whole-kidney protein lysates from 12-month WT and LRRK2 KO rats were resolved on acrylamide gels and imaged with colloidal Coomassie. A 14 kDa band of stronger intensity in LRRK2 KO lysates emerged as compared with the WT lysates, and excision of this band and MS/MS (tandem mass spectrometry) analysis revealed a possible match to hemoglobin-α (alpha) (Fig. 4A).
Figure 4.

Accumulation of hemoglobin-α in LRRK2 KO rat kidneys. (A) Colloidal Coomassie-stained acrylamide gel of total kidney lysates from 12-month WT and LRRK2 KO rats. Proteins corresponding to the indicated bands are abbreviated (details of the proteins in Table 1). The arrow indicated at ∼14 kDa band of protein up-regulated in the LRRK2 KO lysate was excised and identified by mass spectrometry as hemoglobin-α (HbA). (B) Spectral analysis of WT and LRRK2 KO whole-kidney lysates showing a spike of absorbance at ∼420 nm consistent with hemoglobin-α (36–40). (C) Western blot result of 6-month-old WT and LRRK2 KO kidneys shows increased hemoglobin-α protein expression in the LRRK2 KO kidneys. VDAC was used as loading control and did not vary between lysates with respect to total protein (∼10 µg loaded per lane). (D–I) LRRK2 KO kidneys have increased hemoglobin-α staining specifically in the renal tubules that colocalize with lysosome associated membrane protein 1 (LAMP-1) stained structures. Confocal images of immunofluorescence staining of hemoglobin-α (red) and LAMP-1 (LAMP-1; green) in outer medulla from 3-month WT and LRRK2 KO rat kidneys. Scale bar is 25 µm. (J) High-magnification confocal image of the colocalized hemoglobin-α (red) and LAMP-1 (green), scale bar is 25 µm.
Hemoglobin possesses strong spectral absorbance characteristics and can produce reddish to blackish hues in solution under physiological pH and oxidative conditions (36–40). Spectral analysis of lysates from the LRRK2 KO kidneys revealed a sharp spike in ∼420 nm absorbance (Fig. 4B), consistent with adult hemoglobin-α. Denaturing sodium dodecyl sulphate-polyacrylamide gel electrophoresis (SDS-PAGE) and western blot analysis of the lysates using an antibody specific for adult hemoglobin-α confirmed the accumulation of hemoglobin in the LRRK2 KO kidneys (Fig. 4C). Confocal microscopy demonstrated that there was an increase in hemoglobin staining in LRRK2 KO renal tubules in the cortex and outer medulla (Fig. 4G and Supplementary Material, Fig. S4) as compared with the WT kidneys (Fig. 4D and Supplementary Material, Fig. S4). In addition, there was an increased LAMP-1 (lysosome-associated membrane protein-1) staining in the renal tubules of the LRRK2 KO cortex and outer medulla (Fig. 4H and Supplementary Material, Fig. S4) as compared with the WT kidneys (Fig. 4D and Supplementary Material, Fig. S4). Hemoglobin deposits in the LRRK2 KO kidneys closely corresponded with pigmentation observed on a gross anatomical level (Fig. 4G–I, Supplementary Material, Fig. S4 and Fig. 1A). The intracellular localization revealed that the hemoglobin-positive structures co-localized with LAMP-1-positive vesicles (Fig. 4I and J) in LRRK2 KO kidney sections. As lysosomal degradation is the normal pathway for hemoglobin turnover (41), these results suggest that the LRRK2 KO kidney lysosomal system is not efficiently degrading hemoglobin in the kidney.
Our results are consistent with previous studies that show mouse LRRK2 KO kidneys have abnormal lysosomal function and increased LAMP-1 (a marker of late endosomes) cytoplasmic staining in the kidney tubules (17,27). We performed further global-proteomic mass spectrometry analysis from lysates as shown in Figure 4A to identify additional pathways of disruption. Protein lanes from the WT and LRRK2 KO lysates were excised and separated into eight equal segments and digested with trypsin (starting from top of the gel to the bottom of the gel: marker size range 188 to 3 kDa). Peptides were assigned into 803 protein groups using stringent quality control cutoff filters and peptides were quantified using label-free spectral counting to identify other proteins accumulating in the LRRK2 KO kidney (Fig. 5A). The top 10 protein changes are listed in Table 1.
Figure 5.
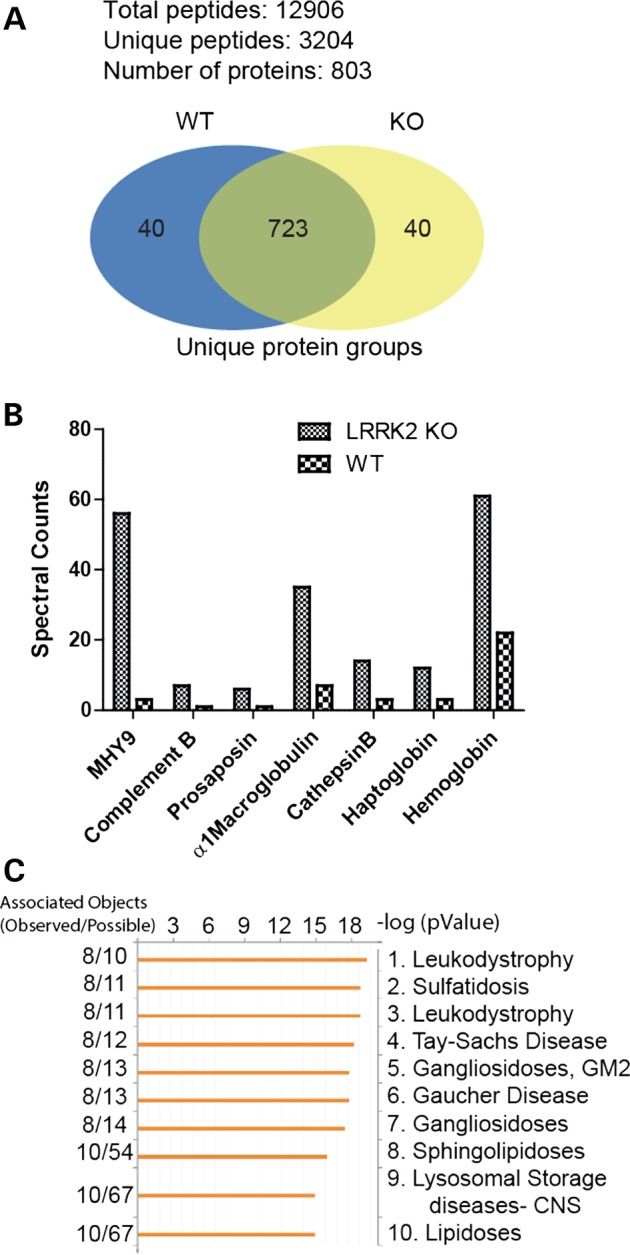
Accumulation of blood-products and lysosomal proteins in LRRK2 KO kidneys. Total protein lysates were derived from whole-kidney samples of WT and LRRK2 KO rats and analyzed by Accurate Mass Tag LC/MS/MS to identify proteins with differential abundance. (A) Of note, 12 906 peptides were quantified corresponding to 803 unique protein groups, with at least two peptides required for measuring a protein group, with the false-discovery rate set for 2%. (B) Examples of the most differentially expressed proteins up-regulated in LRRK2 KO kidney lysates are shown in this graph. These proteins correspond to abundant blood products (macroglobulin, haptoglobin and hemoglobin) as well as lysosomal proteins (prosaposin, cathepsin B). (C) All proteins differentially expressed in the LRRK2 KO kidney (2-fold up or down) were input into GeneGO for detection of enrichment of disease-associated proteins. The top 10 diseases associated with these proteins are given.
Table 1.
Overview of WT and LRRK2 KO kidney proteome analysis: top 10 protein changes
| Symbol | Protein name | Molecular weight (kDa) | Normalized spectral counts |
Fold change | |
|---|---|---|---|---|---|
| LRRK2 KO | LRRK2 WT | KO/WT | |||
| Myh9 | Myosin, heavy polypeptide 9, non-muscle | 226.25 | 56 | 3 | 18.7 |
| Scpep1 | Retinoid-inducible serine carboxypeptidase | 50.91 | 22 | 3 | 7.3 |
| CfB | Protein Cfb | 141.38 | 7 | 1 | 7.0 |
| Ttn | Titin | 3904.04 | 7 | 1 | 7.0 |
| Pyroxd2 | Pyridine nucleotide-disulfide oxidoreductase domain-containing protein 2 | 62.82 | 13 | 2 | 6.5 |
| Afm | Afamin, isoform CRA_c | 69.18 | 6 | 1 | 6.0 |
| Sgp-1 | Sulfated glycoprotein 1 | 61.07 | 6 | 1 | 6.0 |
| A1m | Alpha-1-macroglobulin | 167 | 35 | 7 | 5.0 |
| Ces4 | Liver carboxylesterase 4 | 62.25 | 5 | 1 | 5.0 |
| Ppp2r1b | Serine/threonine-protein phosphatase 2A 65 kDa regulatory subunit A beta isoform | 76.04 | 5 | 1 | 5.0 |
The overview of the proteomic analyses in this table is shown as an increase in abundance of proteins in LRRK2 KO kidneys versus WT kidneys with top 10 changes.
Of note, the largest observed change is a nearly 20-fold increase in myosin 9 (MYH9) in LRRK2 KO kidneys. MYH9 is associated with increased risk for chronic kidney disease (42), and a marker for focal segmental glomerulosclerosis (43). However, despite the up-regulation of MYH9 we observed no increase of urinary protein levels in LRRK2 KO rats (∼0.1 g/dl for both WT and KO, P > 0.05), consistent with previous studies (22). Other notable protein changes observed in the LRRK2 KO rat kidney included an accumulation of the most abundant protein in blood, α1-macroglobulin (Fig. 5B). Lysosomal-compartment resident proteins cathepsin B and prosaposin (sulfated glycoprotein 1) were also increased (also confirmed by western blot as shown in Supplementary Material, Fig. S6), indicative of up-regulation of lysosomal pathways and consistent with previously published results in the mouse LRRK2 KO kidneys (17,23). We also note that there was an increase in haptoglobin (along with hemoglobin), which has high affinity for binding hemoglobin (Supplementary Material, Fig. S6). The haptoglobin–hemoglobin complex is subsequently removed by the phagocytic myeloid/macrophage system (CD68+ cells that have accumulated in the LRRK2 KO kidney) in order to limit its oxidative injury (44). Our data also indicate that there was an up-regulation of complement B. Haptoglobin (an acute phase reactant) together with complement are up-regulated when there is an ongoing inflammatory process in stress conditions (45,46). Abnormal alterations in peripheral cells of LRRK2 KO rats have also been reported previously (22). Input of all proteins differentially abundant (greater or less than 2-fold) in the LRRK2 KO as compared with WT into GeneGO (https://portal.genego.com) showed a remarkable enrichment of genes associated with human lysosomal diseases and lipidoses, implicating a prominent role for LRRK2 in lysosomal function in both peripheral and renal cells (Fig. 5C).
Increased heme oxygenase-1 (HO-1) in LRRK2 KO rat kidneys
Our studies indicated that the LRRK2 KO rats are protected against heme-mediated glycerol induced acute kidney injury. In addition, our mass spectrometry and immunofluorescence studies indicate an increase in hemoglobin in LRRK2 KO rat kidneys. HO-1 is a well-known cytoprotective enzyme that catalyzes the breakdown of heme from heme-related proteins releasing iron (stored as H-ferritin, FtH), carbon monoxide (CO), and biliverdin (47). HO-1 is induced in response to oxidative stress (48,49). It has been previously reported that pre-conditioning rats with hemoglobin causes a robust induction of HO-1, which affords protection against kidney injury due to glycerol-induced rhabdomyolysis (50,51). Mice that transgenically over-express HO-1 protein are protected against kidney damage caused by rhabdomyolysis (52) and HO-1 KO mice are highly sensitive to acute kidney injury (53,54).
We therefore examined basal levels of HO-1 and FtH in 3-month WT and LRRK2 KO rat kidneys. Quantitative real-time polymerase chain reaction (PCR) confirmed that the HO-1 mRNA levels were significantly higher in the LRRK2 KO rat kidneys as compared with age matched WT rat kidneys (Fig. 6A). LRRK2 KO rats showed significantly increased HO-1 and FtH protein levels compared with age matched WT rats as confirmed by western blot analyses (Fig. 6B–D). Immunofluorescence staining studies revealed HO-1 and FtH increased specifically in renal tubules in the outer medulla (Fig. 6E and F left panels) in LRRK2 KO kidneys. The localization of HO-1 was confirmed by the Na+K+ATPase staining that contrasts distal tubules (intense signal) with that of proximal tubules or collecting ducts (faint signal). HO-1 colocalized only with the faint green staining of the proximal tubules or collecting ducts (Fig. 6F right panels). Figure 6G and H shows Na+K+ATPase staining the distal tubules with intense green stain and Na+K+ATPase also staining the proximal tubules with faint green stain, respectively. Importantly, the HO-1 staining did not colocalize with the AQP2 staining that demarcates cells that normally express LRRK2 (Supplementary Material, Fig. S5), highlighting the non-cell autonomous nature of dysfunction and subsequent compensation of the unique LRRK2 KO kidney phenotype.
Figure 6.

Increased heme oxygenase 1 (HO-1) in LRRK2 KO kidneys. (A) HO-1 mRNA expression levels were analyzed by quantitative real-time PCR for 3 month WT and LRRK2 KO rat kidneys. HO-1 mRNA levels normalized to β-actin and are represented as mean ± SEM from 4 WT and 4 LRRK2 KO rats. (B) Western blot results using anti-HO-1 and anti-H-ferritin (FtH) antibodies from whole-kidney lysates derived from 3 month WT and LRRK2 KO rats. Ponceau S staining of the membrane corresponds to total protein loaded per lane. (C and D) Densitometric analyses of the western blot results for HO-1 and FtH from WT and LRRK2 KO kidney lysates, normalized to Ponceau S (Fig. 6B). *P < 0.05 and ***P < 0.001, two-way Student's T-test, from four WT and three LRRK2 KO rats. (E) Representative images of immunofluorescence staining of FtH (red color) from 5 µm thick cryosections of outer medulla from 3 month WT and LRKR2 KO rats, and (F) HO-1 (red) and Na+K+ATPase (green). HO-1 (red) staining merges with Na+K+ATPase (green) staining in the proximal tubules but not distal tubules of the LRRK2 KO kidneys (bottom panel Fig. 6F). For E: scale bar indicates 400 µm. For F: scale bar indicates 200 µm. (G–H) Na+K+ATPase preferentially stains the distal tubules (intense green color) as compared with proximal tubules (faint green color).
Hypertension in LRRK2 KO rats
Hemoglobin is an important regulator of vasodilation via nitric oxide (NO) buffering (55). It has previously been noted that LRRK2 KO rats have lower red blood cell counts (at 8 months of age), lower hematocrit values (at 8 months of age) and a high reticulocyte count (at 2 months of age) (27). These results suggest that loss of LRRK2 causes chronic low-grade hemolysis, thereby causing increased release or decreased turnover of heme proteins that alter NO buffering. Previous reports also indicate that LRRK2 KO mice are hypertensive (18). Hemoglobin has high affinity for NO and hemoglobin bound to NO can limit the bioavailability of NO, likely contributing to increased blood pressure (56). As the LRRK2 KO rats show hemoglobin accumulation in the kidney, we compared diastolic and systolic blood pressures and found increased blood pressure in 3-month old LRRK2 KO rats compared with WT rats (Fig. 7 A). Mean arterial blood pressure in LRRK2 KO rats (119.5 ± 12.6 mm of Hg) was also significantly higher as compared with WT rats (101.4 ± 12.1 mm of Hg) (Fig. 7A). LRRK2 KO rats had significantly lower heart rate compared with the WT rats (LRRK2 KO, 412.8 ± 15.2 versus WT, 470.6 ± 64.3, beats per minute, P < 0.05) (Fig. 7B).
Figure 7.

Hypertension in LRRK2 KO rats. (A) Diastolic, systolic and mean arterial blood pressures were measured by Tail cuff in 3 month in WT and LRRK2 KO rats for and (B) heart rate (beats per minute). Columns show group mean values from at least seven WT and six LRRK2 KO rats, and error bars are ± SD. *P < 0.05, two-way Student's T-test. (mm Hg) millimeters of mercury.
LRRK2 KO rat kidneys have distinct lipid profile alterations
Abnormal accumulation of lipofuscin has been suspected in LRRK2 KO mouse kidney due to strong autofluorescence in kidney sections, and a more recent study using a carbol fuchsin and picric acid staining for residues of lysosomal digestion confirmed these findings (17,27). Lipofuscin is an intracellular, cytosolic, granular red/brown pigment consisting of autofluorescent lysosomal storage body material with aggregated and oxidatively-modified lipids (57). During routine processing of LRRK2 KO kidneys, the buoyancy of the pigmented kidneys was increased compared with WT kidneys processed in parallel in sucrose solutions (Fig. 8A), suggesting a fundamental difference in kidney composition and density possibly due to accumulation of abnormal lipids. Similar to reports in mice, we also detected large amounts of autofluorescence in LRRK2 KO kidney sections, and these deposits were quenched by using Sudan Black B, which selectively mitigates lipofuscin autofluorescence (Fig. 8B).
Figure 8.

Renal lipidosis in LRRK2 KO rats. (A) LRRK2 KO kidneys are buoyant in a dilute sucrose solution. (B) Autofluorescence in frozen sections from WT and LRRK2 KO kidneys analyzed by confocal microscopy with 555 nm excitation and emission captured from 580–630 nm. Treatment of sections with Sudan Black B reagent normalized the autofluorescence in LRRK2 KO rat kidneys. (C) Whole-kidneys lysates from WT and LRRK2 KO rats were processed through 3k-molecular weight cutoff filters; the flow-through (FT) and captured (Cap) fractions were delipidated and the lipid layer was removed, dried and reconstituted in methanol (tube shown). A white precipitate was observed only in LRRK2 KO 3k-Cap fractions (indicated by a white arrow). (D–E) MALDI-TOF analysis shows intensified lipids in LRRK2 KO 3K-Cap sample (from panel C) and shows high m/z species (1000–2000, panel E and see Supplementary Material, Table S1 for details of the peaks identified) that cannot be detected in WT kidney lysates. (F) Example database match of the high m/z species to a fucosylated glycan is shown.
To gain a better understanding of the lipid changes in the kidney, we performed a lipid extraction from whole-kidney lysates from both WT and LRRK2 KO kidneys and obtained a unique white-fluffy layer specific to the LRRK2 KO kidney upon reconstitution of the lipids into methanol (Fig. 8C). Matrix-assisted laser desorption/ionization time of flight (MALDI-TOF) analysis of the white-fluffy layer compared with solubilized lipids from WT kidneys revealed overall intensified lipid signatures in the usual m/z ranges in LRRK2 KO kidneys (Fig. 8D). However, very high m/z species of lipids (between 1200 and 2000 m/z) were identified specific to the LRRK2 KO kidney (Supplementary Material, Table S1). These species showed possible database matches to annotated oxidized fucosylated glycans. For example, the most abundant high m/z species (1592.27 m/z peak, Supplementary Material, Table S1) matches to a known component of lipofuscin (lipid map identification LMGP12120002, Fig. 8E and F). Taken together, these data suggest that LRRK2 KO rat kidneys are dark brown in color due to a profound accumulation of oxidatively modified hemoglobin and lipofuscin components.
Discussion
The LRRK2 gene came to initial notoriety because missense mutations in the enzymatic domains are the leading known genetic cause of inherited Parkinson's disease (2,6,58,59). Efforts are underway to develop therapeutics that might attenuate or ablate LRRK2 function (15). Complete germ-line KO of LRRK2 protein in mice or rats, while not mimicking therapeutic targeting of the protein, provides a reasonable foundation to understand normal physiological function of the gene product and identify potential unintended deleterious effects due to complete inhibition of LRRK2 expression. Despite evolutionary genomics data suggesting homologs of LRRK2 persist to even single cell organisms (60–62), removal of the expression of the gene (i.e., KO) from mice and rats is overall well-tolerated and Mendelian transmission of the deficient allele can be observed in these models (17,18).
Compensatory changes and the nature of phenotypes due to LRRK2 deletion are not well understood. Nevertheless, numerous subtle abnormalities have been noted in LRRK2 KO mice and rats. These rodent models show impaired autophagy–lysosomal pathways, metabolic dysfunction evidenced by increased insulin levels, variations in prolactin and growth hormone mRNA levels, and altered innate immune cell homeostasis in the inflammatory responses (17–19,22,23,28,63). However, in both mice and rats, the most striking phenotype is in the kidney and this phenotype begins early in life. The discoloration associated with the LRRK2 KO kidney is a phenotype often associated with acute kidney injury (64). Yet, the animals do not show loss of kidney function and live to normal ages. The discoloration (dark brown pigmentation) is readily evident in early adulthood in rats, apparently occurring much earlier in life than in LRRK2 KO mice (19,23).
Consistent with previous reports, the kidney presents with an overall normal architecture on routine histological examination, although there are noticeable accumulations of mononuclear cells. These are CD68+ cells that behave as professional phagocytic cells (65,66) which are possibly recruited to the kidney because of the accumulation of blood-products in the tubular cells. The abnormal accumulation of macrophages appears to be specific to the kidney because we could not see similar macrophage infiltration in any other organ evaluated. Inflammation mediated by macrophages is a well-known component in several models of kidney injury (33). Therefore, we hypothesized that the LRRK2 KO kidney represents a prodromal disease state that will have different responses as compared with the WT animals when challenged with an insult. We investigated the functional effect of challenging the LRRK2 KO rats with glycerol induced heme-mediated acute kidney injury. Surprisingly, the LRRK2 KO rats are protected and resistant to this form of kidney injury. Therefore, since it became clear we fundamentally did not understand the LRRK2 KO kidney phenotype, we performed a series of biochemical experiments to better identify the nature of the changes occurring in the LRRK2 KO kidney.
A combination of proteomic and lipidomic assays revealed accumulation of blood- and lysosomal products in the kidney. Strongly pigmented molecules that accumulate in the kidney include hemoglobin as well as oxidized lipids and other blood products that are not usually abundant in healthy kidneys. The reason for hemoglobin accumulation that occurs in the LRRK2 KO kidney is not clear. Several possibilities could explain this phenomenon. First, previous studies have reported the presence of anemia and reticulocytosis as early as 2 months of age in LRRK2 deficient rats (27). Compromised macrophage function in LRRK2 KO rats, normally responsible for degradation of the chemical components of red blood cells, could lead to excessive delivery of heme proteins to the kidney.
In mice, LRRK2 KO kidneys accumulate α-synuclein, a protein not normally expressed in kidney (17). Since some reticulocytes express the highest concentrations of α-synuclein (67), it seems probable that the deposition of α-synuclein in the LRRK2 KO kidney is comparable in magnitude to the other more abundant blood products such as hemoglobin and macroglobulin that also accumulate. However, recent studies by Nishi et al. (68) have shown that hemoglobin is synthesized locally in the rat kidney by glomerular mesangial cells, so we cannot rule out that LRRK2 KO may have local effects on hemoglobin production in compensation for loss of LRRK2 protein.
It is important to note that we found LRRK2 protein colocalizes with AQP2, a renal collecting duct marker, yet hemoglobin deposition (and HO-1 induction) occurs in the proximal tubules. It seems highly unlikely that local impaired lysosomal function in renal collecting duct cells can account for all the changes occurring in the LRRK2 KO kidney. For example, as stated, the recycling of heme proteins by macrophages may be impaired as macrophages and the reticuloendothelial system are the primary sites for heme and hemoglobin breakdown (69,70). LRRK2-deficient macrophages should therefore be explored in future studies for their ability to degrade hemoglobin and operate correctly in protein-recycling pathways. It is possible that the macrophage recruitment to the kidney may not reflect an inflammatory process, but instead a response to the accumulation of hemoglobin in the tubules. Although alternative-activation states for macrophages are becoming better understood (71), we were severely limited in defining the activation states of macrophages that accumulate in the rat LRRK2 KO kidney because of a lack of antibodies that can cross-react with rat (as opposed to human or mouse) proteins. It is clear that further studies will be required to identify the precise mechanism of hemoglobin accumulation in the LRRK2 KO rats.
Previous reports elucidate a possible role for LRRK2 physiology in oxidative stress (17,72,73). LRRK2 KO results in an accumulation of hemoglobin in the kidney and elicits the expected cytoprotective response of induction of HO-1. HO-1 is involved in breakdown of heme to CO, biliverdin and iron. All of these components are able to potently modify oxidative stress responses and should be considered when evaluating in vivo responses. Previous studies have illustrated the potent protective effects of pre-treatment with hemoglobin in the glycerol induced rhabdomyolysis model of acute kidney injury (50,51). This effect is dependent on up-regulation of HO-1, and is suggestive that the protection that LRRK2 KO rats show from glycerol-induced rhabdomyolysis may be dependent on HO-1. The effects of HO-1 up-regulation in LRRK2 deficiency in mediating protection from rhabdomyolysis might be explored with chemical inhibitors of HO enzyme activity like tin protoporphyrin (SnPP) in future studies. Administration of SnPP has been shown to worsen kidney damage in a rat model of glycerol induced acute kidney injury (50). Therefore, the use of SnPP to suppress HO enzyme activity in LRRK2 KO animals and subjecting them to glycerol induced acute kidney injury should make these animals more prone to glycerol induced damage. However, one caveat implicit to HO enzyme activity suppression using metalloporphyrins is that they may exert non-specific adverse biological effects unrelated to HO-1 suppression (74–76). Another possible approach to test the mechanistic link of HO-1 conferring protection to glycerol induced damage would be to generate LRRK2 and HO-1 double KO transgenic animals. As transgenic animals that over-express HO-1 are resistant to acute kidney injury (52) and HO-1 KO mice are highly sensitive to acute kidney injury (51), genetic KO of HO-1 may be preferred to force rhabdomyolysis sensitivity in the LRRK2 KO. The current unavailability of the HO-1 KO rat limited this approach in the current study, but may be the focus of future efforts.
Electron microscopic analyses of lung ultrastructure in 16-month-old LRRK2 KO rats have indicated abnormalities and increased numbers of lamellar bodies in type II pneumocytes (27), similar to the findings in the LRRK2 KO mice (18). Although we did not perform ultrastructural studies of lungs from the LRRK2 KO rats in this study, our flow cytometry analysis of lung revealed comparable populations of CD45+ CD11b/c+ cells as compared with WT rats, in contrast with LRRK2 KO kidneys that show elevated numbers of these cells. A recent report indicated that administration of LRRK2 kinase inhibitors in non-human primates induced off target lysosomal abnormalities in type II pneumocytes of the lung (77). In the non-human primates treated with LRRK2 inhibitors, there was a decrease (in contrast to the expected increase) in the urinary levels of di-docosahexaenoyl (22:6) bis(monoacylglycerol) phosphate (di-22:6-BMP) which is a biomarker of kidney lysosomal dysregulation (77). In addition, it has been reported that lipocalin-2 (marker for kidney injury) is significantly reduced in both the urine and plasma of LRRK2 KO animals (22). Together with our results in this report, these observations collectively imply that LRRK2 kinase inhibition might be well tolerated in the kidney.
In conclusion, our results provide a striking example of a presumed prodromal disease state that resulted in the opposite effect as initially hypothesized when challenged in a well-established disease model. Thus peripheral defects in LRRK2 KO rats as well as local changes in the kidney produce both compensatory cytoprotective changes as well as changes associated with kidney disease, but add to an overall protective effect from acute kidney injury. However, it is not clear whether the LRRK2 KO kidney phenotype can be reproduced through the removal of LRRK2 expression in kidney alone as macrophages appear to have a key role in the phenotype. It is also not clear whether ablation of LRRK2 kinase activity through long-term chronic LRRK2 kinase inhibition might also produce the LRRK2 KO kidney phenotype. These important questions will need to be addressed in future studies to understand potential adverse effects associated with targeting LRRK2 in diseases such as Parkinson's disease.
Materials and Methods
Animals
LRRK2 KO rats and WT controls on the Charles River Long-Evans background strain were purchased from Sigma Advance Genetic Engineering (SAGE, St. Louis, MO, USA) laboratories or Charles River Laboratories (Wilmington, MA, USA). Rats used in this study were bred and maintained at the University of Alabama at Birmingham. All protocols were approved by the University of Alabama at Birmingham Animal Care and Use Committee that is fully accredited by the AAALAC.
Histology and immunofluorescence staining
Rat organs were harvested and drop-fixed either in 10% neutral buffered formalin or 2% paraformaldehyde (PFA) for a time period of 2 h to overnight at 4°C. Formalin fixed tissues were paraffin embedded and sectioned onto slides at University of Alabama at Birmingham Comparative Pathology Laboratory. The PFA fixed tissues were immersed in 20% sucrose solution and embedded in Tissue-Tek OCT compound (Sakura Finetek U.S.A., Inc., CA, USA) and cryosectioned into 5 µm thick sections. For immunofluorescence staining, the slides were blocked with 1.5–3% normal horse serum in 1× phosphate buffered saline (PBS) or 1× PBS 0.05%Tween-20, and incubated with the following primary antibodies or their corresponding IgG controls and dilutions over night at 4°C: rabbit anti-LRRK2 MJFF2 (1:50 dilution, used with 1% SDS antigen retrieval step at room temperature for 5 min; C41-2 #3514-1, Epitomics, Burlingame, CA, USA); rabbit anti- hemoglobin-α (1:100, #sc21005, Santa Cruz Biotechnology, Dallas, TX, USA); goat anti-LAMP1 (1:100, #sc17768, Santa Cruz Biotechnology); rabbit anti-H-ferritin (1:100, #sc25617, Santa Cruz Biotechnology); mouse anti Na+K+ATPase alpha 1 subunit (1:100, #05369, EMD Millipore, Billerica, MA, USA); goat anti-Aquaporin2 (1:50, #sc9882, Santa Cruz Biotechnology); mouse anti-rat CD68 (1:100, #MCA341R, AbD Serotech, NC, USA). Incubation of rabbit or mouse or goat secondary antibodies conjugated to FITC or Texas red or Alexa Fluor 594 (30 min at room temperature; 1:100-1:200 dilution, Jackson ImmunoResearch Laboratories, West Grove, PA, USA; Life technologies, Grand Island, NY, USA) was subsequently done after washes. Autofluorescence eliminator reagent (#2160, EMD Millipore) was used as per manufacturer's recommendation for quenching lipofuscin specific autofluorescent signal. The slides were mounted using Vectashield HardSet Mounting Medium with DAPI (Vector Laboratories, CA, USA). The images were taken by Leica DMIRB epifluorescence microscope (Leica Microsystems, IL, USA) using Image PRO 5.1 software (Media Cybernetics, Inc, MD, USA) or a Leica TCS SP5 confocal microscope (Leica Microsystems).
Western blot analysis
Immunoblot analysis was performed as previously described (78). Briefly, frozen tissues were lysed in radioimmunoprecipitation buffer, 10–75 μg of protein electrophoresed in a 10–15% SDS-polyacrylamide gel, and transferred onto a Hybond C Extra membrane (Amersham Biosciences, Pittsburgh, PA, USA). Membranes were incubated with anti-HO-1 (1:5000 dilution; Stressgen, Farmingdale, NY, USA), anti-H-ferritin (1:1000, #sc25617, Santa Cruz Biotechnology), anti-voltage-dependent anion channel 1 (VDAC1) (1:5000, #ab14734, Abcam, USA), anti-haptoglobin (1:2000, #ab131236, Abcam), anti-cathepsin B (1:2000, #sc13985, Santa Cruz Biotechnology) and anti-LRRK2 (1:1000, N241, Neuromab, USA) antibodies followed by a peroxidase-conjugated goat anti-rabbit (or mouse) IgG antibody (1:3000–1:5000 dilution; Jackson ImmunoResearch Laboratories, West Grove, PA, USA). Horseradish peroxidase activity was detected using enhanced chemiluminescence. The membrane was stained with Ponceau S solution (#P7170, Sigma-Aldrich, St. Louis, MO, USA) to confirm loading and transfer.
Mass spectrophotometry and spectrophotometric analysis
Frozen kidney tissues procured from rats perfused with cold-PBS were lysed by Dounce homogenization followed by probe-type sonication in SDS-containing lysis buffer [50 mM Tris–HCl pH 7.4, 1% SDS, protease and phosphatase inhibitors (Complete tablets, Roche, Indianapolis, IN, USA)] and the extracts were stored at −80°C until further analysis. Frozen lysates were thawed at 4°C, and 1 ml aliquots were centrifuged at 12 000g at 4°C, for 10 min. The supernatant was transferred to a fresh tube, and protein was quantified using a bicinchoninic acid assay protein assay (Pierce, Thermo Scientific, Rockford, IL, USA). A small portion of each sample was diluted to 1 µg µl−1, and 100 µl were transferred to a UV transparent 96-well assay plate (Corning Incorporated, Corning, NY, USA) and analyzed for differences in spectral absorbance from 200–-999 nm with a Synergy 2 Multi-Mode plate reader (BioTek, Winooski, VT, USA). The remaining samples were concentrated and separated using Amicon Ultra 3 kDa molecular weight cutoff centrifugal filter devices (Millipore), and the buffer was exchanged into 100 mm ammonium bicarbonate. The two fractions included a “captured” and a “flow-through”, of which were split in half and one half each fraction were delipidated separately using the Bligh and Dyer method (79). The lipid containing layers were separated and concentrated to near dryness under argon, reconstituted in 50% methanol, and placed in a sonication bath to gently clarify the solution prior to analysis by MALDI-TOF-mass spectrometry. In the captured lipid fractions, each lipid extract was further centrifuged at 12 000g at 4°C, for 10 min, the supernatant was removed, and the resulting pellet was dissolved in 50 µl of 50:50 chloroform/methanol solution. Lipid extracts were analyzed using an UltraflexIII MALDI-TOF-MS (Bruker Daltronics, Billerica, MA, USA) operated in reflector mode after first mixing with an 80% ethanol/20% water saturated 2,5-dihydroxybenzoic acid matrix (Sigma-Aldrich) 50:50 with each sample and placed on a MALDI-TOF probe using a dried drop method. Each of the resulting spectra was generated in automatic mode by summing 500 individual spectra taken at 100 Hz from 500–5000 m/z.
For the proteomics analysis, an aliquot from each of the non-delipidated captured samples containing 15 µg of protein was denatured and separated on a 10% Bis–Tris gel (Invitrogen, Grand Island, NY, USA), and stained with colloidal Coomassie gel staining kit (Invitrogen) as per manufacturers' instructions. Each gel lane was cut into eight fractions, and enzymatically digested with Trypsin Gold (Promega, Madison, WI, USA) overnight according to manufacturer's instructions, followed by acidification to pH 3–4 with 10% formic acid for analysis by liquid chromatography-mass spectrometry.
Each peptide digest fraction was analyzed using a linear trap quadrupole XL (LTQ XL) ion trap mass spectrometer equipped with a nano-electrospray source, and a Surveyor Plus binary high-pressure liquid chromatography (HPLC) pump (Thermo Scientific) using a split flow configuration. Separations were carried out using a 100 µm × 13 cm pulled tip C-18 column (Jupiter C-18 300 A, 5 µm). The HPLC was set up with two mobile phases that included solvent A (0.1% FA in ddH2O), and solvent B (0.1% FA in 85% ddH2O/15% ACN), and was programmed as follows: 15 min at 0% B (2 µl/min, load and desalt), 100 min at 0%–50% B (∼0.5 nl/min, analyze), 20 min at 0% B (2 µl/min, equilibrate). During the first 15 min of loading and desalting, the source was set at 0.0 V. The LTQ XL was operated in data-dependent triple play mode, with a survey scan range of 300–1200 m/z, followed by an ultra-zoom scan used for charge state determination (∼20k resolution @ 400 m/z) and an MS2 scan, both carried out with 2.0 Da isolation widths on the three top most intense ions. MS data were collected in profile mode for all scan types. Charge state screening and dynamic exclusion were enabled with a minimum signal intensity of 2000, a repeat count of 2, and exclusion duration of 90 s for ions ± 1.5 m/z of the parent ion. The automatic gain control settings were 3 × 10⁴, 5 × 10³ and 1 × 10⁴ ions for survey, zoom and collision-induced dissociation (CID) modes, respectively. Scan times were set at 25, 50 and 100 ms for survey, zoom and CID modes, respectively. For CID, the activation time, activation Q and normalized collision energy were set at 30 ms, 0.25, and 35% respectively. The spray voltage was set at 1.9 kV following the first 15 min of loading, with a capillary temperature of 170°C.
The XCalibur RAW files were centroided and converted to MzXML and the mgf files were then created using both ReAdW and MzXML2Search, respectively (http://sourceforge.net/projects/sashimi/). The data were searched using SEQUEST (v27 rev12, .dta files), set for two missed cleavages, a precursor mass window of 0.45 Da, tryptic enzyme, variable modification M at 15.9949, and static modifications C at 57.0293. Searches were performed with a rat subset of the UniRef100 database, which included common contaminants such as digestion enzymes and human keratins. Identified peptides were filtered, grouped and quantified using ProteoIQ v2.3.04 (Premierbiosoft, Palo Alto, CA, USA). Only peptides with charge state of ≥2+ and a minimum peptide length of six amino acids were accepted for analysis. ProteoIQ incorporates the two most common methods for statistical validation of large proteome datasets, false discovery rate (FDR) and protein probability (80–82). Relative quantification was performed via spectral counting (83,84), and spectral count abundances were normalized between samples (85).The FDR was set at <1% cutoff, with a total group probability of ≥0.7 and peptides ≥2 assigned per protein.
Real-time quantitative PCR
RNA was isolated from rat kidneys using TRIzol reagent (Life technologies) as per manufacturer's instructions. SYBR green-based real-time PCR was done using cDNA products converted from total RNA (Life technologies). The ΔΔCt method was used for relative mRNA expression quantification. Primers for beta-actin (forward: 5′-CTGTATGCCTCTGGTCGTA-3’; reverse: 5′-CCATCTCTTGCTCGAAGTCT-3’) was used as loading control. HO-1 primer sequence used was forward: 5′-CGTGCAGAGAATTCTGAGTTC-3’; reverse: 5′-GACGCTTTACGTAGTGCTG -3’. Each reaction was performed in triplicates.
Isolation of leukocytes for flow cytometry
Leukocytes were isolated as previously described with minor modifications (78). Rats were anesthetized with isoflurane and perfused with 60 ml of ice-cold saline through the left ventricle to clear the kidney of leukocytes in the circulation. The kidney was minced and enzymatically digested using 1.67 Wünsch U/ml Liberase DL (Roche Diagnostics, Indianapolis, IN) in Dulbecco's modified Eagle's medium medium for 30 min at 37°C. Disaggregation was completed by pulling the homogenate through syringe needles with progressively smaller bores followed by passage through a 70 μm nylon filter (Fisher Scientific) to remove undigested material. After centrifugation, the pellet was suspended in NycoPrep 1.077 density-gradient solution (Axis-Shield PoC, Oslo, Norway), overlaid with PBS, and centrifuged at 1000g for 15 min at 4°C. The interphase, containing low-density cells, including macrophages and dendritic cells, was collected and washed with staining buffer (PBS, 0.5% bovine serum albumin, 0.01% sodium azide). The same cell isolation protocol was used for liver, spleen, heart, bone marrow, blood and testicles. Bronchial cells were isolated by lavage using 20 ml of PBS. Blood was collected via cardiac puncture and red blood cells (RBCs) were lysed for 5 min at room temperature using ammonium-chloride–potassium (ACK) lysing solution. Bone marrow was flushed from the femur and subjected to lysis in ACK solution to remove RBCs.
For analysis by flow cytometry, the cells were first stained on ice for 30 min with 7-aminoactinomycin D (eBioscience, San Diego, CA) viability staining solution and the following fluorochrome-conjugated anti-rat antibodies: phycoerythrin-conjugated CD11b/c (clone OX42) and allophycocyanin-conjugated CD45 (clone OX1), both antibodies purchased from eBioscience. Cells were then washed and analyzed on a FACS Caliber flow cytometer (BD Bioscience, San Jose, CA). Isotype-matched, fluorescently conjugated antibodies of irrelevant specificity were used as controls. Results were analyzed using FlowJo Software (Tree Star Inc, Ashland, OR).
Glycerol induced rhabdomyolysis
Glycerol-induced rhabdomyolysis was performed as previously described (49). Three-month-old WT and LRRK2 KO rats were administered saline or 7.5 ml/kg of 50% glycerol in water, half the dose injected intramuscularly in each anterior thigh. All the rats in this study were deprived of water 15 h prior to glycerol or saline injections. Serum was collected prior to dehydrating the rats for baseline assessment. Animals were monitored for up to 5 days post-injection. On Days 1–5 post-injection, renal function was evaluated by measurement of serum creatinine using mass spectrometry. Rats were euthanized 5 days after the injection for histology, protein, flow cytometry and RNA analysis.
Statistical and systems analyses
Statistical analyses were performed using Graphpad Prism 6 software (GraphPad Software, Inc. La Jolla, CA, USA). P values of <0.05 were considered significant. Pathway enrichment analysis was accomplished using MetaCore data-mining and pathway analysis (https://portal.genego.com/).
Supplementary Material
Funding
This work was supported by an interdisciplinary training in kidney-related research grant awarded from the National Institute of Diabetes and Digestive and Kidney Disease Institute (T32 DK007545 to A.A. and R.B.); UAB-UCSD O'Brien Core Center for Acute Kidney Injury Research funded by the National Institute of Diabetes and Digestive and Kidney Disease Institute (P30 DK079337 to A.A.); National Institute of Diabetes and Digestive and Kidney Disease Institute (R01 DK59600 to A.A.); National Institutes of Neurological Disorders and Stroke (R01 NS064934 and U18 NS082132 to A.B.W.); Career Development grant funded by the Office of Research and Development, Department of Veterans Affairs (K2 BX001581 to L.M.C.); and by the UAB Comprehensive Cancer Center Mass Spectrometry and Proteomics Shared Facility supported in part by the National Cancer Institute grant (P30 CA13148 to A.B.W).
Supplementary Material
Acknowledgements
The authors acknowledge additional technical expertise provided by Nour Sukar, Amie M Traylor, Kyoko Kojima and James Mobley for their assistance in completing this study.
Conflict of Interest statement. None declared.
References
- 1.International Parkinson’s Disease Genomics, C. and Wellcome Trust Case Control, C. (2011) A two-stage meta-analysis identifies several new loci for Parkinson's disease. PLoS Genet., 7, e1002142. [DOI] [PMC free article] [PubMed] [Google Scholar]
- 2.International Parkinson Disease Genomics, C. Nalls M.A., Plagnol V., Hernandez D.G., Sharma M., Sheerin U.M., Saad M., Simon-Sanchez J., Schulte C., Lesage S., Sveinbjörnsdóttir S., et al. (2011) Imputation of sequence variants for identification of genetic risks for Parkinson's disease: a meta-analysis of genome-wide association studies. Lancet, 377, 641–649. [DOI] [PMC free article] [PubMed] [Google Scholar]
- 3.Nalls M.A., Pankratz N., Lill C.M., Do C.B., Hernandez D.G., Saad M., DeStefano A.L., Kara E., Bras J., Sharma M., et al. (2014) Large-scale meta-analysis of genome-wide association data identifies six new risk loci for Parkinson’s disease. Nat. Genet., 46, 989–993. [DOI] [PMC free article] [PubMed] [Google Scholar]
- 4.Danoy P., Pryce K., Hadler J., Bradbury L.A., Farrar C., Pointon J., Australo-Anglo-American Spondyloarthritis C., Ward M., Weisman M., Reveille J.D., et al. (2010) Association of variants at 1q32 and STAT3 with ankylosing spondylitis suggests genetic overlap with Crohn’s disease. PLoS Genet., 6, e1001195. [DOI] [PMC free article] [PubMed] [Google Scholar]
- 5.Zhang F.R., Huang W., Chen S.M., Sun L.D., Liu H., Li Y., Cui Y., Yan X.X., Yang H.T., Yang R.D., et al. (2009) Genomewide association study of leprosy. N. Engl. J. Med., 361, 2609–2618. [DOI] [PubMed] [Google Scholar]
- 6.Zimprich A., Biskup S., Leitner P., Lichtner P., Farrer M., Lincoln S., Kachergus J., Hulihan M., Uitti R.J., Calne D.B., et al. (2004) Mutations in LRRK2 cause autosomal-dominant parkinsonism with pleomorphic pathology. Neuron, 44, 601–607. [DOI] [PubMed] [Google Scholar]
- 7.Paisan-Ruiz C., Jain S., Evans E.W., Gilks W.P., Simon J., van der Brug M., Lopez de Munain A., Aparicio S., Gil A.M., Khan N., et al. (2004) Cloning of the gene containing mutations that cause PARK8-linked Parkinson’s disease. Neuron, 44, 595–600. [DOI] [PubMed] [Google Scholar]
- 8.West A.B., Moore D.J., Choi C., Andrabi S.A., Li X., Dikeman D., Biskup S., Zhang Z., Lim K.L., Dawson V.L., et al. (2007) Parkinson’s disease-associated mutations in LRRK2 link enhanced GTP-binding and kinase activities to neuronal toxicity. Hum. Mol. Genet., 16, 223–232. [DOI] [PubMed] [Google Scholar]
- 9.Sheng Z., Zhang S., Bustos D., Kleinheinz T., Le Pichon C.E., Dominguez S.L., Solanoy H.O., Drummond J., Zhang X., Ding X., et al. (2012) Ser1292 autophosphorylation is an indicator of LRRK2 kinase activity and contributes to the cellular effects of PD mutations. Sci. Transl. Med., 4, 164ra161. [DOI] [PubMed] [Google Scholar]
- 10.West A.B., Moore D.J., Biskup S., Bugayenko A., Smith W.W., Ross C.A., Dawson V.L., Dawson T.M. (2005) Parkinson's disease-associated mutations in leucine-rich repeat kinase 2 augment kinase activity. Proc. Natl. Acad. Sci. U.S.A., 102, 16842–16847. [DOI] [PMC free article] [PubMed] [Google Scholar]
- 11.Webber P.J., Smith A.D., Sen S., Renfrow M.B., Mobley J.A., West A.B. (2011) Autophosphorylation in the leucine-rich repeat kinase 2 (LRRK2) GTPase domain modifies kinase and GTP-binding activities. J. Mol. Biol., 412, 94–110. [DOI] [PMC free article] [PubMed] [Google Scholar]
- 12.Sen S., Webber P.J., West A.B. (2009) Dependence of leucine-rich repeat kinase 2 (LRRK2) kinase activity on dimerization. J. Biol. Chem., 284, 36346–36356. [DOI] [PMC free article] [PubMed] [Google Scholar]
- 13.Greggio E., Zambrano I., Kaganovich A., Beilina A., Taymans J.M., Daniels V., Lewis P., Jain S., Ding J., Syed A., et al. (2008) The Parkinson disease-associated leucine-rich repeat kinase 2 (LRRK2) is a dimer that undergoes intramolecular autophosphorylation. J. Biol. Chem., 283, 16906–16914. [DOI] [PMC free article] [PubMed] [Google Scholar]
- 14.Cookson M.R. (2010) The role of leucine-rich repeat kinase 2 (LRRK2) in Parkinson's disease. Nat. Rev. Neurosci., 11, 791–797. [DOI] [PMC free article] [PubMed] [Google Scholar]
- 15.West A.B. (2015) Ten years and counting: moving leucine-rich repeat kinase 2 inhibitors to the clinic. Mov. Disord., 30, 180–189. [DOI] [PMC free article] [PubMed] [Google Scholar]
- 16.Biskup S., Moore D.J., Rea A., Lorenz-Deperieux B., Coombes C.E., Dawson V.L., Dawson T.M., West A.B. (2007) Dynamic and redundant regulation of LRRK2 and LRRK1 expression. BMC Neurosci., 8, 102. [DOI] [PMC free article] [PubMed] [Google Scholar]
- 17.Tong Y., Yamaguchi H., Giaime E., Boyle S., Kopan R., Kelleher R.J., 3rd, Shen J. (2010) Loss of leucine-rich repeat kinase 2 causes impairment of protein degradation pathways, accumulation of alpha-synuclein, and apoptotic cell death in aged mice. Proc. Natl. Acad. Sci. U.S.A., 107, 9879–9884. [DOI] [PMC free article] [PubMed] [Google Scholar]
- 18.Herzig M.C., Kolly C., Persohn E., Theil D., Schweizer T., Hafner T., Stemmelen C., Troxler T.J., Schmid P., Danner S., et al. (2011) LRRK2 protein levels are determined by kinase function and are crucial for kidney and lung homeostasis in mice. Hum. Mol. Genet., 20, 4209–4223. [DOI] [PMC free article] [PubMed] [Google Scholar]
- 19.Hinkle K.M., Yue M., Behrouz B., Dachsel J.C., Lincoln S.J., Bowles E.E., Beevers J.E., Dugger B., Winner B., Prots I., et al. (2012) LRRK2 knockout mice have an intact dopaminergic system but display alterations in exploratory and motor co-ordination behaviors. Mol. Neurodegener., 7, 25. [DOI] [PMC free article] [PubMed] [Google Scholar]
- 20.Greggio E., Civiero L., Bisaglia M., Bubacco L. (2012) Parkinson’s disease and immune system: is the culprit LRRKing in the periphery? J. Neuroinflamm., 9, 94. [DOI] [PMC free article] [PubMed] [Google Scholar]
- 21.Kim B., Yang M.S., Choi D., Kim J.H., Kim H.S., Seol W., Choi S., Jou I., Kim E.Y., Joe E.H. (2012) Impaired inflammatory responses in murine Lrrk2-knockdown brain microglia. PLoS One, 7, e34693. [DOI] [PMC free article] [PubMed] [Google Scholar]
- 22.Ness D., Ren Z., Gardai S., Sharpnack D., Johnson V.J., Brennan R.J., Brigham E.F., Olaharski A.J. (2013) Leucine-rich repeat kinase 2 (LRRK2)-deficient rats exhibit renal tubule injury and perturbations in metabolic and immunological homeostasis. PLoS One, 8, e66164. [DOI] [PMC free article] [PubMed] [Google Scholar]
- 23.Tong Y., Giaime E., Yamaguchi H., Ichimura T., Liu Y., Si H., Cai H., Bonventre J.V., Shen J. (2012) Loss of leucine-rich repeat kinase 2 causes age-dependent bi-phasic alterations of the autophagy pathway. Mol. Neurodegener., 7, 2. [DOI] [PMC free article] [PubMed] [Google Scholar]
- 24.Daher J.P., Volpicelli-Daley L.A., Blackburn J.P., Moehle M.S., West A.B. (2014) Abrogation of alpha-synuclein-mediated dopaminergic neurodegeneration in LRRK2-deficient rats. Proc. Natl. Acad. Sci. U.S.A., 111, 9289–9294. [DOI] [PMC free article] [PubMed] [Google Scholar]
- 25.Davies P., Hinkle K.M., Sukar N.N., Sepulveda B., Mesias R., Serrano G., Alessi D.R., Beach T.G., Benson D.L., White C.L., et al. (2013) Comprehensive characterization and optimization of anti-LRRK2 (leucine-rich repeat kinase 2) monoclonal antibodies. Biochem. J., 453, 101–113. [DOI] [PMC free article] [PubMed] [Google Scholar]
- 26.Fraser K.B., Moehle M.S., Daher J.P., Webber P.J., Williams J.Y., Stewart C.A., Yacoubian T.A., Cowell R.M., Dokland T., Ye T., et al. (2013) LRRK2 secretion in exosomes is regulated by 14–3–3. Hum. Mol. Genet., 22, 4988–5000. [DOI] [PMC free article] [PubMed] [Google Scholar]
- 27.Baptista M.A., Dave K.D., Frasier M.A., Sherer T.B., Greeley M., Beck M.J., Varsho J.S., Parker G.A., Moore C., Churchill M.J., et al. (2013) Loss of leucine-rich repeat kinase 2 (LRRK2) in rats leads to progressive abnormal phenotypes in peripheral organs. PLoS One, 8, e80705. [DOI] [PMC free article] [PubMed] [Google Scholar]
- 28.Moehle M.S., Webber P.J., Tse T., Sukar N., Standaert D.G., DeSilva T.M., Cowell R.M., West A.B. (2012) LRRK2 inhibition attenuates microglial inflammatory responses. J. Neurosci., 32, 1602–1611. [DOI] [PMC free article] [PubMed] [Google Scholar]
- 29.Thevenet J., Pescini Gobert R., Hooft van Huijsduijnen R., Wiessner C., Sagot Y.J. (2011) Regulation of LRRK2 expression points to a functional role in human monocyte maturation. PLoS One, 6, e21519. [DOI] [PMC free article] [PubMed] [Google Scholar]
- 30.Jo S.K., Sung S.A., Cho W.Y., Go K.J., Kim H.K. (2006) Macrophages contribute to the initiation of ischaemic acute renal failure in rats. Nephrol. Dial. Transplant., 21, 1231–1239. [DOI] [PubMed] [Google Scholar]
- 31.Belliere J., Casemayou A., Ducasse L., Zakaroff-Girard A., Martins F., Iacovoni J.S., Guilbeau-Frugier C., Buffin-Meyer B., Pipy B., Chauveau D., et al. (2014) Specific macrophage subtypes influence the progression of rhabdomyolysis-induced kidney injury. J. Am. Soc. Nephrol., in press. [DOI] [PMC free article] [PubMed] [Google Scholar]
- 32.Ricardo S.D., van Goor H., Eddy A.A. (2008) Macrophage diversity in renal injury and repair. J. Clin. Invest., 118, 3522–3530. [DOI] [PMC free article] [PubMed] [Google Scholar]
- 33.Anders H.J., Ryu M. (2011) Renal microenvironments and macrophage phenotypes determine progression or resolution of renal inflammation and fibrosis. Kidney Int., 80, 915–925. [DOI] [PubMed] [Google Scholar]
- 34.Nelson P.J., Rees A.J., Griffin M.D., Hughes J., Kurts C., Duffield J. (2012) The renal mononuclear phagocytic system. J. Am. Soc. Nephrol., 23, 194–203. [DOI] [PMC free article] [PubMed] [Google Scholar]
- 35.Kim J.H., Lee D.W., Jung M.H., Cho H.S., Jeon D.H., Chang S.H., Park D.J. (2014) Macrophage depletion ameliorates glycerol-induced acute kidney injury in mice. Nephron Exp. Nephrol., 128, 21–29. [DOI] [PubMed] [Google Scholar]
- 36.Salama A., Sayed A.E.-B.M., Nabil G.M., Elsaeid A., Elwan A. (2013) Spectral analysis for rat's hemoglobin molecule. Middle-East J. Sci. Res., 17, 72–76. [Google Scholar]
- 37.Zijlstra W.G., Buursma A., Falke H.E., Catsburg J.F. (1994) Spectrophotometry of hemoglobin: absorption spectra of rat oxyhemoglobin, deoxyhemoglobin, carboxyhemoglobin, and methemoglobin. Comp. Biochem. Physiol. B Comp. Biochem., 107, 161–166. [Google Scholar]
- 38.Olson J.S. (1976) Spectral differences between the alpha and beta heme groups within human deoxyhemoglobin. Proc. Natl. Acad. Sci. U.S.A., 73, 1140–1144. [DOI] [PMC free article] [PubMed] [Google Scholar]
- 39.Zijlstra W.G., Buursma A., Meeuwsen-van der Roest W.P. (1991) Absorption spectra of human fetal and adult oxyhemoglobin, de-oxyhemoglobin, carboxyhemoglobin, and methemoglobin. Clin. Chem., 37, 1633–1638. [PubMed] [Google Scholar]
- 40.Zijlstra W.G. (1956) [Quantitative determination of hemoglobin, oxyhemoglobin, carbon oxide hemoglobin and metahemoglobin in small blood specimens by means of spectrophotometry]. Klin. Wochenschr., 34, 384–389. [DOI] [PubMed] [Google Scholar]
- 41.Kurz T., Eaton J.W., Brunk U.T. (2011) The role of lysosomes in iron metabolism and recycling. Int. J. Biochem. Cell Biol., 43, 1686–1697. [DOI] [PubMed] [Google Scholar]
- 42.Bostrom M.A., Freedman B.I. (2010) The spectrum of MYH9-associated nephropathy. Clin. J. Am. Soc. Nephrol., 5, 1107–1113. [DOI] [PMC free article] [PubMed] [Google Scholar]
- 43.Kopp J.B., Smith M.W., Nelson G.W., Johnson R.C., Freedman B.I., Bowden D.W., Oleksyk T., McKenzie L.M., Kajiyama H., Ahuja T.S., et al. (2008) MYH9 is a major-effect risk gene for focal segmental glomerulosclerosis. Nat. Genet., 40, 1175–1184. [DOI] [PMC free article] [PubMed] [Google Scholar]
- 44.Abraham N.G., Drummond G. (2006) CD163-Mediated hemoglobin-heme uptake activates macrophage HO-1, providing an antiinflammatory function. Circ. Res., 99, 911–914. [DOI] [PubMed] [Google Scholar]
- 45.Li Q., Li Y.X., Stahl G.L., Thurman J.M., He Y., Tong H.H. (2011) Essential role of factor B of the alternative complement pathway in complement activation and opsonophagocytosis during acute pneumococcal otitis media in mice. Infect. Immun., 79, 2578–2585. [DOI] [PMC free article] [PubMed] [Google Scholar]
- 46.Baumann H., Gauldie J. (1994) The acute phase response. Immunol. Today, 15, 74–80. [DOI] [PubMed] [Google Scholar]
- 47.Gozzelino R., Jeney V., Soares M.P. (2010) Mechanisms of cell protection by heme oxygenase-1. Annu. Rev. Pharmacol. Toxicol., 50, 323–354. [DOI] [PubMed] [Google Scholar]
- 48.Seixas E., Gozzelino R., Chora A., Ferreira A., Silva G., Larsen R., Rebelo S., Penido C., Smith N.R., Coutinho A., et al. (2009) Heme oxygenase-1 affords protection against noncerebral forms of severe malaria. Proc. Natl. Acad. Sci. U.S.A., 106, 15837–15842. [DOI] [PMC free article] [PubMed] [Google Scholar]
- 49.Nath K.A. (2006) Heme oxygenase-1: a provenance for cytoprotective pathways in the kidney and other tissues. Kidney Int., 70, 432–443. [DOI] [PubMed] [Google Scholar]
- 50.Nath K.A., Balla G., Vercellotti G.M., Balla J., Jacob H.S., Levitt M.D., Rosenberg M.E. (1992) Induction of heme oxygenase is a rapid, protective response in rhabdomyolysis in the rat. J. Clin. Invest., 90, 267–270. [DOI] [PMC free article] [PubMed] [Google Scholar]
- 51.Nath K.A. (2014) Heme oxygenase-1 and acute kidney injury. Curr. Opin. Nephrol. Hypertens., 23, 17–24. [DOI] [PMC free article] [PubMed] [Google Scholar]
- 52.Kim J., Zarjou A., Traylor A.M., Bolisetty S., Jaimes E.A., Hull T.D., George J.F., Mikhail F.M., Agarwal A. (2012) In vivo regulation of the heme oxygenase-1 gene in humanized transgenic mice. Kidney Int., 82, 278–291. [DOI] [PMC free article] [PubMed] [Google Scholar]
- 53.Nath K.A., Haggard J.J., Croatt A.J., Grande J.P., Poss K.D., Alam J. (2000) The indispensability of heme oxygenase-1 in protecting against acute heme protein-induced toxicity in vivo. Am. J. Pathol., 156, 1527–1535. [DOI] [PMC free article] [PubMed] [Google Scholar]
- 54.Shiraishi F., Curtis L.M., Truong L., Poss K., Visner G.A., Madsen K., Nick H.S., Agarwal A. (2000) Heme oxygenase-1 gene ablation or expression modulates cisplatin-induced renal tubular apoptosis. Am. J. Physiol. Renal Physiol., 278, F726–F736. [DOI] [PubMed] [Google Scholar]
- 55.Helms C., Kim-Shapiro D.B. (2013) Hemoglobin-mediated nitric oxide signaling. Free Radic. Biol. Med., 61, 464–472. [DOI] [PMC free article] [PubMed] [Google Scholar]
- 56.Tsai A.G., Cabrales P., Manjula B.N., Acharya S.A., Winslow R.M., Intaglietta M. (2006) Dissociation of local nitric oxide concentration and vasoconstriction in the presence of cell-free hemoglobin oxygen carriers. Blood, 108, 3603–3610. [DOI] [PMC free article] [PubMed] [Google Scholar]
- 57.Brunk U.T., Terman A. (2002) Lipofuscin: mechanisms of age-related accumulation and influence on cell function. Free Radic. Biol. Med., 33, 611–619. [DOI] [PubMed] [Google Scholar]
- 58.Healy D.G., Falchi M., O'Sullivan S.S., Bonifati V., Durr A., Bressman S., Brice A., Aasly J., Zabetian C.P., Goldwurm S., et al. (2008) Phenotype, genotype, and worldwide genetic penetrance of LRRK2-associated Parkinson’s disease: a case–control study. Lancet Neurol., 7, 583–590. [DOI] [PMC free article] [PubMed] [Google Scholar]
- 59.Simon-Sanchez J., Schulte C., Bras J.M., Sharma M., Gibbs J.R., Berg D., Paisan-Ruiz C., Lichtner P., Scholz S.W., Hernandez D.G., et al. (2009) Genome-wide association study reveals genetic risk underlying Parkinson’s disease. Nat. Genet., 41, 1308–1312. [DOI] [PMC free article] [PubMed] [Google Scholar]
- 60.Bosgraaf L., Van Haastert P.J. (2003) Roc, a Ras/GTPase domain in complex proteins. Biochim. Biophys. Acta, 1643, 5–10. [DOI] [PubMed] [Google Scholar]
- 61.Marin I. (2006) The Parkinson disease gene LRRK2: evolutionary and structural insights. Mol. Biol. Evol., 23, 2423–2433. [DOI] [PubMed] [Google Scholar]
- 62.Marin I. (2008) Ancient origin of the Parkinson disease gene LRRK2. J. Mol. Evol., 67, 41–50. [DOI] [PubMed] [Google Scholar]
- 63.Nikonova E.V., Xiong Y., Tanis K.Q., Dawson V.L., Vogel R.L., Finney E.M., Stone D.J., Reynolds I.J., Kern J.T., Dawson T.M. (2012) Transcriptional responses to loss or gain of function of the leucine-rich repeat kinase 2 (LRRK2) gene uncover biological processes modulated by LRRK2 activity. Hum. Mol. Genet., 21, 163–174. [DOI] [PMC free article] [PubMed] [Google Scholar]
- 64.Boutaud O., Moore K.P., Reeder B.J., Harry D., Howie A.J., Wang S., Carney C.K., Masterson T.S., Amin T., Wright D.W., et al. (2010) Acetaminophen inhibits hemoprotein-catalyzed lipid peroxidation and attenuates rhabdomyolysis-induced renal failure. Proc. Natl. Acad. Sci. U.S.A., 107, 2699–2704. [DOI] [PMC free article] [PubMed] [Google Scholar]
- 65.Vasina E.M., Cauwenberghs S., Feijge M.A., Heemskerk J.W., Weber C., Koenen R.R. (2011) Microparticles from apoptotic platelets promote resident macrophage differentiation. Cell Death Dis., 2, e211. [DOI] [PMC free article] [PubMed] [Google Scholar]
- 66.Travaglione S., Falzano L., Fabbri A., Stringaro A., Fais S., Fiorentini C. (2002) Epithelial cells and expression of the phagocytic marker CD68: scavenging of apoptotic bodies following Rho activation. Toxicol. In Vitro, 16, 405–411. [DOI] [PubMed] [Google Scholar]
- 67.Scherzer C.R., Grass J.A., Liao Z., Pepivani I., Zheng B., Eklund A.C., Ney P.A., Ng J., McGoldrick M., Mollenhauer B., et al. (2008) GATA transcription factors directly regulate the Parkinson’s disease-linked gene alpha-synuclein. Proc. Natl. Acad. Sci. U.S.A., 105, 10907–10912. [DOI] [PMC free article] [PubMed] [Google Scholar]
- 68.Nishi H., Inagi R., Kato H., Tanemoto M., Kojima I., Son D., Fujita T., Nangaku M. (2008) Hemoglobin is expressed by mesangial cells and reduces oxidant stress. J. Am. Soc. Nephrol., 19, 1500–1508. [DOI] [PMC free article] [PubMed] [Google Scholar]
- 69.Hull T.D., Agarwal A., George J.F. (2014) The mononuclear phagocyte system in homeostasis and disease: a role for heme oxygenase-1. Antioxid. Redox Signal., 20, 1770–1788. [DOI] [PMC free article] [PubMed] [Google Scholar]
- 70.Ganz T. (2012) Macrophages and systemic iron homeostasis. J. Innate Immun., 4, 446–453. [DOI] [PMC free article] [PubMed] [Google Scholar]
- 71.Moehle M.S., West A.B. (2014) M1 and M2 immune activation in Parkinson’s disease: foe and ally? Neuroscience, in press. [DOI] [PMC free article] [PubMed] [Google Scholar]
- 72.Yang D., Li T., Liu Z., Arbez N., Yan J., Moran T.H., Ross C.A., Smith W.W. (2012) LRRK2 kinase activity mediates toxic interactions between genetic mutation and oxidative stress in a Drosophila model: suppression by curcumin. Neurobiol. Dis., 47, 385–392. [DOI] [PubMed] [Google Scholar]
- 73.Heo H.Y., Park J.M., Kim C.H., Han B.S., Kim K.S., Seol W. (2010) LRRK2 enhances oxidative stress-induced neurotoxicity via its kinase activity. Exp. Cell. Res., 316, 649–656. [DOI] [PubMed] [Google Scholar]
- 74.Lutton J.D., Abraham N.G., Drummond G.S., Levere R.D., Kappas A. (1997) Zinc porphyrins: potent inhibitors of hematopoieses in animal and human bone marrow. Proc. Natl. Acad. Sci. U.S.A., 94, 1432–1436. [DOI] [PMC free article] [PubMed] [Google Scholar]
- 75.Grundemar L., Ny L. (1997) Pitfalls using metalloporphyrins in carbon monoxide research. Trends Pharmacol. Sci., 18, 193–195. [DOI] [PubMed] [Google Scholar]
- 76.Serfass L., Burstyn J.N. (1998) Effect of heme oxygenase inhibitors on soluble guanylyl cyclase activity. Arch. Biochem. Biophys., 359, 8–16. [DOI] [PubMed] [Google Scholar]
- 77.Fuji R.N., Flagella M., Baca M., MA S.B., Brodbeck J., Chan B.K., Fiske B.K., Honigberg L., Jubb A.M., Katavolos P., et al. (2015) Effect of selective LRRK2 kinase inhibition on nonhuman primate lung. Sci. Transl. Med., 7, 273ra215. [DOI] [PubMed] [Google Scholar]
- 78.Hull T.D., Bolisetty S., DeAlmeida A.C., Litovsky S.H., Prabhu S.D., Agarwal A., George J.F. (2013) Heme oxygenase-1 expression protects the heart from acute injury caused by inducible Cre recombinase. Lab. Invest., 93, 868–879. [DOI] [PMC free article] [PubMed] [Google Scholar]
- 79.Bligh E.G., Dyer W.J. (1959) A rapid method of total lipid extraction and purification. Can. J. Biochem. Physiol., 37, 911–917. [DOI] [PubMed] [Google Scholar]
- 80.Keller A., Nesvizhskii A.I., Kolker E., Aebersold R. (2002) Empirical statistical model to estimate the accuracy of peptide identifications made by MS/MS and database search. Anal. Chem., 74, 5383–5392. [DOI] [PubMed] [Google Scholar]
- 81.Nesvizhskii A.I., Keller A., Kolker E., Aebersold R. (2003) A statistical model for identifying proteins by tandem mass spectrometry. Anal. Chem., 75, 4646–4658. [DOI] [PubMed] [Google Scholar]
- 82.Weatherly D.B., Atwood J.A., 3rd, Minning T.A., Cavola C., Tarleton R.L., Orlando R. (2005) A Heuristic method for assigning a false-discovery rate for protein identifications from Mascot database search results. Mol. Cell Proteomics, 4, 762–772. [DOI] [PubMed] [Google Scholar]
- 83.Old W.M., Meyer-Arendt K., Aveline-Wolf L., Pierce K.G., Mendoza A., Sevinsky J.R., Resing K.A., Ahn N.G. (2005) Comparison of label-free methods for quantifying human proteins by shotgun proteomics. Mol. Cell Proteomics, 4, 1487–1502. [DOI] [PubMed] [Google Scholar]
- 84.Liu H., Sadygov R.G., Yates J.R., 3rd. (2004) A model for random sampling and estimation of relative protein abundance in shotgun proteomics. Anal. Chem., 76, 4193–4201. [DOI] [PubMed] [Google Scholar]
- 85.Beissbarth T., Hyde L., Smyth G.K., Job C., Boon W.M., Tan S.S., Scott H.S., Speed T.P. (2004) Statistical modeling of sequencing errors in SAGE libraries. Bioinformatics, 20 (Suppl. 1), i31–i39. [DOI] [PubMed] [Google Scholar]
Associated Data
This section collects any data citations, data availability statements, or supplementary materials included in this article.