

Abstract
There are an increasing number of studies indicating that mitochondria are relevant targets in nanomaterial-induced toxicity. However, the underlying mechanisms by which nanoparticles (NPs) interact with these organelles and affect their functions are unknown. The aim of this study was to investigate the effects of cadmium telluride quantum dot (CdTe-QD) NPs on mitochondria in human hepatocellular carcinoma HepG2 cells. CdTe-QD treatment resulted in the enlargement of mitochondria as examined with transmission electron microscopy and confocal microscopy. CdTe-QDs appeared to associate with the isolated mitochondria as detected by their inherent fluorescence. Further analyses revealed that CdTe-QD caused disruption of mitochondrial membrane potential, increased intracellular calcium levels, impaired cellular respiration, and decreased adenosine triphosphate synthesis. The effects of CdTe-QDs on mitochondrial oxidative phosphorylation were evidenced by changes in levels and activities of the enzymes of the electron transport chain. Elevation of peroxisome proliferator-activated receptor-γ coactivator levels after CdTe-QD treatment suggested the effects of CdTe-QDs on mitochondrial biogenesis. Our results also showed that the effects of CdTe-QDs were similar or greater to those of cadmium chloride at equivalent concentrations of cadmium, suggesting that the toxic effects of CdTe-QDs were not solely due to cadmium released from the NPs. Overall, the study demonstrated that CdTe-QDs induced multifarious toxicity by causing changes in mitochondrial morphology and structure, as well as impairing their function and stimulating their biogenesis.
Keywords: cadmium telluride quantum dots, hepatocytes, mitochondria, membrane potential, electron transport chain, cellular respiration
Nanotechnology has potential applications in a wide variety of fields including medicine, cosmetics, electronics, textiles, and engineering. Although the use of nanomaterials is growing rapidly, there is increasing concern that these materials might pose potential risks to human health (Dreher, 2004; Xia et al., 2010). Indeed, there is a growing body of evidence showing the toxicity of nanomaterials in cell cultures and animal models (as reviewed by Boczkowski and Hoet, 2010). The toxicity of nanomaterials is proposed to be associated with their novel and unique physiochemical properties, including small size, large surface area, surface reactivity, and redox activity, that allow them to be transported across cell membranes or to be uptaken inside the exposed cells, resulting in altered subcellular structures and affecting cellular activity (Nel et al., 2006).
Quantum dots (QDs) are engineered nanoparticles (NPs) which are semiconductor metalloid-crystal structures of approximately 2–100 nm, containing about 200–10 000 atoms (Juzenas et al., 2008; Smith et al., 2008). QDs possess unique optical and electronic properties including tunable emission wavelength, broadband absorption spectrum, and photostability that make them useful materials in microelectronics and biomedical research (De Wild et al., 2003). Cadmium QDs including cadmium telluride quantum dots (CdTe-QDs) and cadmium selenide quantum dots have shown great potential for use as fluorescent tags in therapeutic targeting and in medical and molecular imaging (Chan et al., 2002; Gao et al., 2004; Zhu et al., 2013). Although the applications of these QDs are growing, there are concerns about their potential hazards to human health and the environment. However, the toxicity associated with these NPs and the underlying mechanisms have not been thoroughly evaluated.
The mitochondrion is one of the most important organelle in cells as it plays a critical role in cellular energy production. Adenosine triphosphate (ATP) production by mitochondria is achieved through oxidative phosphorylation involving the electron transport chain (ETC), the proteins of which are located in the inner membrane of the mitochondria. The ETC is composed of 5 complexes: Complex I (nicotinamide adenine dinucleotide–ubiquinone oxidoreductase), complex II (succinate–ubiquinone oxidoreductase), complex III (ubiquinone–cytochrome c reductase or cytochrome bc1 complex), complex IV (cytochrome c oxidase), and complex V (ATP Synthase) (Galante et al., 1979). In oxidative phosphorylation, electrons are transferred along complex I to IV from low redox potential to high redox potential, creating a proton gradient across the inner mitochondrial membrane, which is used by complex V to drive the synthesis of ATP (Duchen, 2004). Other crucial roles of the organelle include the maintenance of calcium homeostasis, intermediate metabolism, the generation of reactive oxygen species (ROS), and the initiation or progression of programed cell death (Zorov et al., 1997). Mitochondrial damage could result in changes in cell functions that inevitably lead to disease states. Diseases in which mitochondrial dysfunction has been identified as being the causative factor include metabolic syndrome, cancer, diabetes, cardiovascular diseases, and several neurodegenerative diseases (Wojtczak and Zabłocki, 2008).
Several studies have suggested that mitochondria are potentially relevant target organelles for NP toxicity (Oberdörster et al., 2005; Xia et al., 2006; Zhu et al., 2006). A study by Li et al. (2003) found that ultrafine particulate pollutants entered the mitochondria and induced mitochondrial damage and cellular vacuole formation. Similarly, Xia’s (2006) group showed that diesel exhaust particles (DEPs) caused morphological alterations in mitochondria, including swelling and loss of cristae, in human lung epithelial cells (BEAS-2B). Furthermore, a study on various test metal NPs, including silver, iron oxide, aluminum, molybdenum oxide, and titanium dioxide, showed that these NPs induced changes in mitochondrial membrane potential (Hussain et al., 2005). More recently, several studies have shown the effects of NPs, including copper oxide, silica, iron oxide, and fullerene NPs, on mitochondrial membrane potential and respiratory chain complex activities in different cell types and isolated mitochondria from rat organs (Baratli et al., 2013; Santos et al., 2014; Siddiqui et al., 2013; Sun et al., 2011; Xue et al., 2014). However, there is little known information on how NPs interact with mitochondria and affect their function.
This study aimed to investigate mitochondrial changes induced by CdTe-QDs. A human hepatocellular liver carcinoma cell line (HepG2) was used as an in vitro model to examine CdTe-QD toxicity. HepG2 is a relevant in vitro model for studying toxicity as the cell line retains many functions of human liver cells (Camp and Capitano, 2007). These cells are also an excellent model to investigate mitochondrial toxicity because of their high content of organelles and mitochondrial DNA (Pinti et al., 2003). Our previous studies have demonstrated the toxicity of CdTe-QDs on HepG2 and other cell lines (Nguyen et al., 2013a,b). CdTe-QDs have been shown to cause cytotoxicity and oxidative stress leading to extrinsic and intrinsic apoptosis (Nguyen et al., 2013a,b). Since mitochondria have been linked to oxidative stress and apoptotic pathways, studying the effects of CdTe-QDs on mitochondria is an important extension of toxicity investigation to reveal the details of the effects induced by these NPs in test cells that were observed in our previous studies. In this study, a set of cellular assays were used to examine the effects of CdTe-QDs on mitochondrial structure and function including mitochondrial morphology, membrane potential, calcium regulation, ATP production, cellular respiration, ETC, or oxidative phosphorylation coupling. The effect of CdTe-QDs on mitochondrial biogenesis was also investigated. CdTe-QDs were compared with those of cadmium chloride (CdCl2) with equivalent concentrations of cadmium. Elucidating the effects of CdTe-QDs on mitochondria will further our understanding of the intracellular behavior of these NPs within target cells as well as their mechanisms of toxicity. These results will ultimately add to our understanding of potential human health issues and introduce cellular biomarkers that may serve to warn against adverse effects of NPs.
MATERIALS AND METHODS
Chemicals and reagents
HepG2 cells were obtained from American Type Culture Collection (ATCC; Manassas, Virginia). CdTe-QDs were purchased from Nano Impex Canada (Mississauga, Ontario). CdTe-QDs were described by the manufacturer as CdTe/CdS core/shell QDs, encapsulated by polyacrylate polymer layers, with a size of 5 nm, a spectral emission of 540 nm, and a concentration of 10 mg/ml in water, 4.9 × 10¹³ particles/ml, and containing 10% of cadmium. MTT [3-(4,5-dimethylthiazol-2-yl)-2,5-diphenyl tetrazolium bromide], dimethyl sulfoxide (DMSO), CdCl2, and sodium tellurite (Na2TeO3) were obtained from Sigma-Aldrich (St. Louis, Missouri). Eagle’s Minimum Essential Medium (EMEM), fetal bovine serum (FBS), gentamicin, PBS, and calcium crimson were obtained from Life Technologies (Carlsbad, California). Tris base, 3-(N-morpholino)propanesulfonic acid (MOPS), sucrose, ethylene glycol tetraacetic acid (EGTA), rotenone, succinate, glutamate, malate, malonate, sodium cyanide (NaCN), and adenosine diphosphate (ADP) were purchased from Sigma-Aldrich. Glutaraldehyde, osmium tetroxide, and sodium cacodylate were purchased from Electron Microscopy Science (Hatfield, Pennsylvania).
Characterization of CdTe-QDs
The spectral properties and size characterization of test CdTe-QDs were carried out as described in our previous work (Nguyen et al., 2013a).
Inductively coupled plasma optical emission spectrometry (ICP-OES) analysis was used to determine the elemental concentrations in CdTe-QDs. First, CdTe-QD sample (2.5 mg/ml) was prepared in liquid chromatography/mass spectrometry (LC/MS) water containing 5% HNO3. The metal composition of particles was analyzed by ICP-OES using a Perkin Elmer Optima 5300DV Emission Spectrometer (Waltham, Massachusetts) with axial viewing and modified background correction. Elements of interest were confirmed using a minimum of 2 analytical wavelengths for each element. Five replicate readings were performed on each analyte.
Cell preparation and treatment with CdTe-QDs
HepG2 cells were cultured in EMEM supplemented with 10% FBS and 50 µg/ml gentamicin in a humidified tissue culture incubator at 37°C with 5% CO2. For the MTT assay, cells were seeded into 96-well plates at a density of 5 × 10⁴ cells/100 µL well. For transmission electron microscopy (TEM), confocal microscopy (including Mitotracker, membrane potential, and calcium detection), ATP detection, mitochondrial complex quantification, or proliferator-activated receptor-γ coactivator (PGC-1α) detection assay, cells were seeded on cover slips placed in 6-well plates at a concentration of 2 × 10⁵ cells/well in 2 ml of complete medium. For mitochondrial isolation or mitochondrial complex activity assay, cells were seeded on 75 cm2 culture flasks at a concentration of 1 × 10⁶ cells/flask. Cells were cultured for 24 h to 80% confluency and the medium was replaced before the exposures. Working solutions of CdTe-QDs and CdCl2 were prepared by diluting the stock solutions in PBS. For the MTT assay, cells were treated with different concentrations of CdTe-QDs and CdCl2 (containing 0.01–1 µg/ml of cadmium) for different durations. Cells were also treated with different concentrations of Na2TeO3 (containing 0.00033–0.33 µg/ml of tellurium) for the same durations. The concentrations of tellurium were based on the mass ratio of tellurium:cadmium in CdTe-QDs, which is 0.33:1, based on the ICP-OES results. For other assays, cells were treated with 10 µg/ml (or 4.9 × 10⁵ particles/cell) of CdTe-QDs (containing 1 µg/ml of cadmium) and 1.63 µg/ml of CdCl2 (containing 1 µg/ml of cadmium) for 24 h. Treatments with PBS were used as negative controls. For ATP, ETC concentration and activity, and PCG-α assays, the same protein concentrations of the controls and treated samples were used. CdTe-QDs alone were tested with reagents of the ATP and PCG-α assays to examine the interference of the NPs with the assay systems. All measurements were conducted in duplicate in 3 independent experiments.
Cytotoxicity using the MTT assay
The MTT assay was conducted as described in Nguyen et al. (2013a). Briefly, following the treatment of cells with CdTe-QDs, CdCl2, or Na2TeO3, the medium was removed and replaced with fresh medium (100 µl/well). A total of 10-µl stock MTT (10 mg/ml) was added to each well and cells were incubated for 1 h at 37°C. The medium was removed and cells were rinsed with PBS (100 µl/well). Cells were lysed and formazan was solubilized with DMSO (100 µl/well). Absorbance was measured at 505 nm using a multiwall scanning spectrophotometer (Molecular Devices, Sunnyvale, California).
TEM for mitochondrial morphology
HepG2 cells were treated with CdTe-QDs (10 µg/ml containing 1 µg/ml of cadmium) for 24 h. Cells were then fixed with 2.5% glutaraldehyde in 66.7 mM cacodylate buffer (pH 7.4) for 1 h, washed twice with 100mM cacodylate buffer for 10 min, and then processed with standard procedures. Post fixation was done with 1% osmium tetroxide in 100mM cacodylate buffer, pH 7.4. The monolayers of the cells were dried through a series of alcohols, infiltrated with epoxy resin, and embedded onto resin-filled Beem capsule molds. The blocks were then ultrathin sectioned and stained first with uranyl acetate and then with lead citrate, and analyzed with a Joel 1230 transmission electron microscope.
Mitochondrial isolation
Mitochondria from HepG2 cells were isolated as previously described by Frezza et al. (2007) with minor modifications. Briefly, cells were washed with PBS and collected into a 50 ml tube. The tube was centrifuged at 1000 × g for 5 min at 4°C. The cell pellet was then resuspended in 3 ml of isolation buffer (10mM Tris–MOPS, 100mM sucrose, and 1mM EGTA/Tris), transferred to a homogenizing glass tube and homogenized at 1400 rpm with 40 strokes using an IKA EUROSTAR Power Control-Visc Stirrer (IKA works, Inc, Wilmington, North Carolina). The sample was then centrifuged at 600 × g for 10 min at 4°C. The collected supernatant was then centrifuged at 10 000 × g for 10 min at 4°C. The pellet containing mitochondria was resuspended in isolation buffer on ice and protein concentration was determined using BCA kit (Pierce, Rockford, Illinois).
Determination of CdTe-QDs in mitochondrial enrichment
Isolated mitochondrial samples (100 µl) from PBS and CdTe-QD-treated cells were added to a 96-well opaque plate and fluorescence was measured at excitation of 485 nm and emission of 540 nm with a SpectraMax GEMINI XS microplate spectrofluorometer (Molecular Devices, Sunnyvale, California).
Mitochondrial membrane potential measurements by confocal microscopy
Cells were grown to 80% confluency on glass cover slips placed inside 6-well tissue culture grade plates. After treatment with either CdTe-QDs or CdCl2 for 24 h, or carbonylcyanide m-chlorophenylhydrazone (CCCP) (as a positive control) for 1 h, cells were washed and loaded with 100nM of the fluorescent potential-dependent indicator, tetramethylrhodamine ethyl ester (TMRE) (Immunochemistry Technologies LLC, Bloomington, Minnesota) for 30 min at 37 °C. Cells were washed with assay buffer and observed with a Nikon TE2000 microscope attached to a C1 confocal unit.
Calcium level detection
Cells were grown to 80% confluency on glass cover slips inside 6-well tissue culture grade plates. After treatment with CdTe-QDs or CdCl2 for 24 h, cells were washed and treated with calcium crimson at a concentration of 10 µM for 20 min. Cells were then washed with PBS and the cover slip containing the monolayer of cells was mounted on a slide and viewed immediately with a Nikon TE2000 microscope attached to a C1 confocal unit.
Mitochondrial complex quantification assay
The mitochondrial complex levels were measured using a BeadPlex mitochondrial oxidative phosphorylation kit from EMD (Gibbstown, New Jersey), according to the manufacturer’s instructions. Briefly, after treatment, cells were rinsed with ice-cold PBS and then homogenized in supplied lysis buffer containing protease inhibitors. The cell lysates were centrifuged at 12 000 rpm for 20 min at 4°C and the supernatants were collected and diluted in assay buffer. Each standard or sample (50 µl) was added to the corresponding well in a filter 96-well plate containing 25 µl of anticomplex-conjugated beads and 25 µl of detection antibody. The plate was incubated for 3 h on a shaker at RT and then washed 3 times with wash buffer before 50 µl/well of prediluted streptavidin-conjugated phycoerythrin was added. The plate was incubated for 30 min on a shaker at RT. After being washed, 120 µl of wash buffer was added to each well. The plate was shaken for 1 min and analyzed with the Bio-Plex 100 Array System (Bio-Rad, Hercules, California).
Mitochondrial complex activity assay
Mitochondrial complexes I, II, III, IV, and V activities were measured using enzyme activity ELISA and MitoTox OXPHOS activity assay kits from Mitosciences (Eugene, Oregon) following the manufacturer’s instructions with minor modifications. For complexes I, II, IV, and V, controls and CdTe-QD- or CdCl2-treated cells were first lysed in lysis buffer containing detergent and incubated on ice for 30 min. The samples were centrifuged at 16 000 rpm for 20 min at 4°C and supernatants were collected. Samples (200 µl for complexes I and IV, 50 µl for complexes II and V) were added to assigned wells in the microplate provided for each corresponding assay. The plate was incubated for 3 h at room temperature (RT). After washing, 200 µl of substrate solution was added to each well, except in the assays for complexes II and V, lipid mix (40 µl) was added to each well, and the plate was incubated for 45 min at RT, before adding substrate solution. The plate was placed immediately in a microplate reader and the absorbance was measured in kinetic mode at 450, 600, 550, or 340 nm for complexes I, II, IV, or V, respectively.
For complex III, the activity of the complex was performed using untreated isolated mitochondria of HepG2 cells. Briefly, 10 µl of CdTe-QDs or CdCl2 (containing 1 µg/ml of cadmium) was added to each assigned well of a 96-well plate containing 100 µl of assay solution (25mM sodium succinate, 37mM KH2PO4, 12 M rotenone, 0.18 mM NaCN, and 200 M oxidized cytochrome c). Untreated isolated mitochondrial solution (20 µl) was added to each well and the plate was placed immediately in a microplate reader and the absorbance was measured in kinetic mode at 550 nm.
Cellular respiration assay
Oxygen consumption was monitored in 96-well plate format using a phosphorescent oxygen-sensitive probe as previously described (Hynes et al., 2006) with minor modifications. Briefly, oxygen probe (Luxcel Biosciences, Cork, Ireland) was reconstituted in 10 ml of respiratory buffer to a concentration of approximately 100nM. To each well of a 96-well plate, 100 µl of this solution was added. CdTe-QDs (1 µl well, 10 µg/ml or containing 1 µg/ml of cadmium), rotenone (complex I inhibitor), or malonate (complex II inhibitor) was added to the assigned wells. After this process, 50 µl of mitochondrial stock solution (1.0 mg/ml) was added to each well followed by 50 μl of a 50/50mM glutamate/malate mixture or 100mM succinate with or without ADP (6.6 mM final concentration) in incubation buffer. Finally, 100 μl of heavy mineral oil was added to each well and the plate was placed in a SpectroMax Gemini (Molecular Devices), equilibrated at 30°C, and measured kinetically at 380/650 nm excitation/emission for every 5 min over a period of 120 min. Time profiles of fluorescence intensity in each well were analyzed using Excel (Microsoft) software, to determine the rates of oxygen consumption based on the known relationship between probe fluorescence and oxygen concentration (Hynes et al., 2006). Rates of change of dissolved oxygen were subsequently determined from the slopes of these concentration profiles.
ATP level detection
ATP quantification was carried out using ATP colorimetric assay kit from Biovision (Mountain View, CA). Cells were lysed in ATP assay buffer. The samples were centrifuged at 15 000 × g for 2 min at 4°C and the supernatants were collected for the assay. Samples were diluted with ATP buffer and added to the corresponding wells on a microplate. CdTe-QDs alone were added to separate wells to test for the interference of the NPs with the assay system. To each well, 44 µl of ATP buffer, 2 µl of ATP probe, 2 µl of ATP converter, and 2 µl of developer solution were added. The plate was incubated for 30 min at RT and absorbance was measured at 570 nm in a microplate reader.
PGC-1α level detection
PGC-1α level was measured using PGC-1α ELISA assay kit from BioSource (San Diego, California). In brief, cells were lysed with 2 freeze–thaw cycles in ice-cold PBS and centrifuged at 5000 × g for 5 min at 4°C. The supernatant was collected and assayed immediately. Each of the samples or standards (100 µl) was added to the assigned well in the provided 96-well plate and incubated for 2 h at 37°C. CdTe-QDs alone were added to separate wells to test for the interference of the NPs with the assay system. Biotin antibody (100 µl) was then added to each well and the plate was incubated for 1 h at 37°C. After 3 washes, 100 µl of avidin-HRP was added to each well. After 1 h incubation and washes, 90 µl of 3,3′,5,5′-tetramethylbenzidine was added to each well followed by 15 min incubation. Stop solution (50 µl) was then added to each well and the absorbance was measured at 450 nm in a microplate reader.
Statistical analysis
Results were compared using one-way ANOVA followed by Dunnett’s test for comparison of treatment groups with the negative control group and Tukey’s test for pairwise comparisons among treatment groups. All data were expressed as mean ± standard deviation. A value of P < 0.05 was considered as statistically significant.
RESULTS
Characterization of CdTe-QDs
Spectral and size properties of CdTe-QDs that were used in this study have been recently published by us (Nguyen et al., 2013a).
ICP-OES analysis of CdTe-QDs showed that the levels of arsenic, calcium, chromium copper, iron, mercury, magnesium, manganese, and lead in the NP solution were below the detection limit (Table 1). The concentration of cadmium and tellurium in the sample was 0.246 (246) and 0.081 mg/ml (81 ppm), respectively (Table 1). Since the concentration of CdTe-QDs that was used for the ICP-MS analysis was 2.5 mg/ml, the ICP-OES result showed that these NPs contained 9.84% of cadmium and 3.24% of tellurium content. The cadmium content in CdTe-QDs from the ICP-OES analysis was approximate to the 10% content of cadmium in CdTe-QDs that was claimed by the manufacturer.
TABLE 1.
Inductively Coupled Plasma Optical Emission Spectrometry Analysis for Determination of Elements in CdTe-QDs
| Element | Concentration (ppm) |
|---|---|
| Arsenic | <2.1 |
| Calcium | 2.6 ± 0.0 |
| Chromium | <0.2 |
| Copper | <0.5 |
| Iron | <0.1 |
| Mercury | <4.1 |
| Magnesium | <0.7 |
| Manganese | <0.2 |
| Lead | <0.6 |
| Cadmium | 246 ± 5 |
| Tellurium | 81 ± 20 |
Elements of interest were confirmed using a minimum of 2 analytical wavelengths for each element. Five replicate readings were performed on each analyte.
Cytotoxicity
Cytotoxicity of CdTe-QDs, CdCl2, and Na2TeO3 in HepG2 cells was examined for changes in bioreduction activity using the MTT assay to estimate cellular capacity to reduce MTT to its formazan. Both CdTe-QDs and CdCl2 caused cytotoxicity in HepG2 cells in a time- and dose-dependent manner (Fig. 1A), while Na2TeO3 treatment resulted in no significant cytotoxic effects (Fig. 1B). At the same concentration of cadmium, CdTe-QDs induced greater cytotoxic effects, compared with CdCl2. For CdTe-QDs, the earliest changes were observed at 6 h with 0.1 µg/mL cadmium, and the lowest observable effects were observed with 0.01 µg/mL at 12 h exposure. At the longest exposure duration (24 h), CdTe-QDs caused maximal effects being approximately 60% relative to the controls (Fig. 1). Examination by microscopy showed that, even at this high dose and exposure, cells had not detached (data not shown) and most still retained at least some capacity to reduce MTT to formazan, albeit at a much lower level compared with PBS-treated controls.
FIG. 1.

Cytotoxicity in HepG2 cells as assessed by loss of 3-(4,5-dimethylthiazol-2-yl)-2,5-diphenyl tetrazolium bromide bioreduction activity of cadmium telluride quantum dots (CdTe-QDs), cadmium chloride (CdCl2), and sodium tellurite (Na2TeO3)-treated cultures relative to PBS-treated controls. A, Cells were treated with different concentrations of CdTe-QD and CdCl2, at equivalent concentrations of cadmium, for 6, 12, and 24 h. The concentrations of CdTe-QDs and CdCl2 were expressed in cadmium concentrations. B, Cells were treated with different concentrations of Na2TeO3 for 6, 12, and 24 h. The concentrations of Na2TeO3 were expressed in tellurium concentrations that corresponded to the concentrations of cadmium in CdTe-QDs used in (A). Data points represent the means of 3 independent experiments done in duplicate ± standard deviations. The asterisks (*) indicate statistically significant differences compared with PBS-treated controls (P < 0.001). The number (#) sign indicates statistically significant differences of CdCl2 compared with the CdTe-QD-treated group (P < 0.05).
Mitochondrial Morphology
The effects of CdTe-QDs on HepG2 morphology were studied using TEM. TEM results revealed changes in mitochondrial structure and shape including mitochondrial swelling and loss of cristae (Figs. 2B and D) compared with mitochondria from control cells (Figs. 2A and C). However, TEM results did not show the localization of the NPs inside the treated cells or their mitochondria.
FIG. 2.

Transmission electron micrographs of HepG2 cells showing the effects of CdTe-QDs on mitochondrial morphology and structure. A and C, PBS-treated controls at low and high magnifications. B and D, CdTe-QD-treated cells at low and high magnifications. Abbreviations: n, nuclear; m, mitochondrion.
Detection of CdTe-QDs in Isolated Mitochondria
To examine the association of CdTe-QDs with mitochondria, mitochondria from CdTe-QD-treated and control cultures were isolated and measured by fluorimetry at 540 nm (emission wavelength for green CdTe-QDs). The results showed that mitochondria from the CdTe-treated cultures gave 2.5- to 3-fold (P < 0.05) higher fluorescence intensity (FI) at 540 nm compared with the controls, demonstrating that CdTe-QDs were associated with relatively high levels of these organelles (Fig. 3).
FIG. 3.

Fluorometric detection of CdTe-QDs in enriched mitochondrial fractions. Fluorescence intensity was measured at an excitation of 485 nm and emission of 540 nm. Each data point represents the mean ± standard deviation. The asterisks (*) indicate statistically significant differences compared with the PBS-treated controls (P < 0.05).
Mitochondrial Membrane Potential
Loss or disruption of mitochondrial membrane potential was investigated by staining CdTe-QD- or CdCl2-treated and control cells with TMRE. The TMRE staining showed that both CdTe-QDs and CdCl2 caused a decrease in overall fluorescence, compared with the controls (Figs. 4A–C), indicating a disruption in the membrane potential. In this assay, CCCP, a depolarizing agent, was used as the positive control and also resulted in a decrease in TMRE fluorescence (Fig. 4D).
FIG. 4.
Confocal micrographs of HepG2 cells showing the effects on mitochondrial membrane potential induced by CdTe-QDs and CdCl2, at an equivalent concentration of cadmium, using TMRE staining. A, PBS-treated controls; B, cells treated with CdTe-QDs, which appeared as green dots/aggregates on the micrograph; C, cells treated with CdCl2; and D, cells treated with carbonylcyanide m-chlorophenylhydrazone, as the positive control.
Intracellular Calcium Level
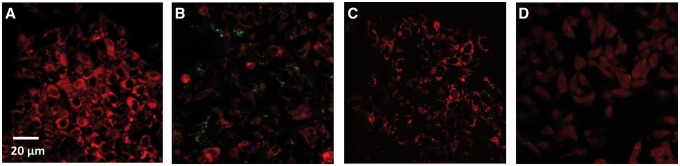
The level of intracellular calcium was measured from confocal micrographs using a calcium indicator dye. The staining results showed that the treatment with CdTe-QDs led to a significant increase in fluorescence intensity compared with the controls (7.4-fold, P < 0.05) (Figs. 5B and D). The results revealed that CdTe-QDs caused elevated intracellular Ca2+ levels. Treatment of CdCl2 also resulted in increase in calcium levels; however, at the same concentration of cadmium, the effect of CdCl2 was much less compared with that of CdTe-QDs (Figs. 5C and D).
FIG. 5.

Confocal micrographs showing intracellular Ca2+ levels in HepG2 cells detected using calcium crimson after being treated for 24 h with PBS (A), 10 µg/ml CdTe-QDs (B), and CdCl2 (C). Intracellular Ca2+ is indicated with red fluorescence. D, The total area of red fluorescence (pixels squared: px2) was analyzed with image analysis software using 3 micrographs for each sample. Each data point represents the mean ± standard deviation. The asterisks (*) indicate statistically significant differences compared with the PBS-treated controls (P < 0.05). The number (#) sign indicates statistically significant difference compared with the CdTe-QD-treated group (P < 0.05).
Cellular Respiration
Cellular respiration is usually measured by assessing the rate of oxygen consumption. In this study, cellular respiration was measured using a phosphorescent oxygen-sensitive probe to monitor the oxygen consumption in isolated mitochondria. Respiratory substrates, ADP, and inhibitors for respiratory chain complexes were used to study the effect of CdTe-QDs on different states of cellular respiration. To study the effect on state 2 (or basal respiration), either glutamate/malate (substrate for complex I) or succinate (substrate for complexes II and III) was added to a mitochondrial sample with or without CdTe-QDs. The oxygen consumption was measured in a microplate reader. The depletion of oxygen in the sample is reflected as an increase in fluorescence intensity. For state 3 respiration, exogenous ADP was added together with each substrate.
The results showed that CdTe-QDs induced significant decreases in the rates of oxygen, compared with the controls (Figs. 6A and B), indicating the inhibition in oxygen consumption in the mitochondrial respiratory chain induced by the NPs. The CdTe-QD inhibitory effect was greater for respiration with succinate than for that with glutamate/malate as the substrate. For both substrates, the inhibition appeared greater for state 3 than for state 2 (Figs. 6A and B). In this assay, the inhibitors of mitochondrial complexes such as rotenone (complex I) and malonate (complex II) were included as the positive controls, which also showed inhibition of oxygen consumption.
FIG. 6.

Effects of CdTe-QDs on cellular respiration expressed in rates of O2 consumption from isolated mitochondria. A, State 2 and state 3 respiration performed with complex I substrate, glutamate/malate. Rotenone, a complex I inhibitor, was used as the positive control. B, State 2 and state 3 respiration performed with complex II substrate, succinate. Malonate, a complex II inhibitor, was used as the positive control. Data points represent the means of 3 independent experiments ± standard deviations. The asterisks (*) indicate statistically significant differences compared with controls (P < 0.05).
ATP Content
ATP content was determined to assess the effects of CdTe-QDs on ATP synthesis in test cells. CdTe-QDs (10 µg/ml, containing 1 µg/ml of cadmium) caused a significant decrease (2.28-fold, P < 0.05) in ATP concentration compared with the controls. Treatment of CdCl2 also induced a significant reduction in ATP level, but the effect was less severe compared with that of CdTe-QDs (Fig. 7). For this assay, the possible interference of CdTe-QDs with the assay system was tested by having CdTe-QDs alone in the wells with assay reagents. These wells showed absorbance values similar to the background (data not shown), indicating that CdTe-QDs do not interfere with the assay results.
FIG. 7.

Effects of CdTe-QDs on ATP content in HepG2 cells. Cells were treated with CdTe-QDs and CdCl2, at an equivalent concentration of cadmium (1 µg/ml), for 24 h. Data points represent the means of 3 independent experiments ± standard deviations. The asterisks (*) indicate statistically significant differences compared with controls (P < 0.001). The number (#) sign indicates statistically significant difference compared with the CdTe-QD-treated group (P < 0.05).
Electron Transport Chain Component Enzyme Level and Activity
The quantity of mitochondrial complexes was determined using BeadPlex array assays. HepG2 cells were treated with CdTe-QDs or CdCl2 (1 µg/ml of cadmium) for 24 h. The results showed that CdTe-QDs caused significant decreases (P < 0.05) in the levels of complexes II, III, and IV, compared with the controls and an increase in the level of complex V (Fig. 8A). CdCl2 treatment resulted in similar effects on the complex levels (Fig. 8A).
FIG. 8.

Effects of CdTe-QDs on mitochondrial electron transport chain (ETC) complexes. A, Changes in ETC complex concentrations. B, Changes in ETC complex activities. Cells were treated with CdTe-QDs and CdCl2, at an equivalent concentration of cadmium (1 µg/ml), for 24 h. Data points represent the means of 3 independent experiments ± standard deviations. The asterisks (*) indicate statistically significant differences compared with controls (P < 0.05).
The effects of CdTe-QDs on mitochondrial complexes were further examined for changes in the activities of specific complex components. The results showed that CdTe-QDs caused little or no change in the activities of complexes I and V, but caused significant decreases (P < 0.05) in the activities of complexes II, III, and IV (Fig. 8B). Similar effects on the activities of the complexes were observed with CdCl2 (Fig. 8B).
PGC-1α Level
The effect of CdTe-QDs on mitochondrial biogenesis was investigated by examining the change in PGC-1α, which is a transcriptional coactivator that regulates mitochondrial biogenesis. The level of PGC-1α was measured using ELISA. Our results showed that the treatment of CdTe-QDs (10 µg/ml, containing 1 µg/ml of cadmium) caused a significant increase (18.2-fold, P < 0.05) in PGC-1α levels in HepG2 cells at 24 h, compared with the controls (Fig. 9). Treatment of CdCl2, at the same cadmium concentration, also resulted in significant increase in PGC-1α level, but the fold change induced by CdCl2 was less compared with that of CdTe-QDs (Fig. 9). The interference of CdTe-QDs with the assay system was tested in a similar manner to that of the ATP assay. CdTe-QDs showed no interference with the assay results as the wells that contained CdTe-QDs alone with the assay reagents showed the absorbance values similar to the background (data not shown).
FIG. 9.
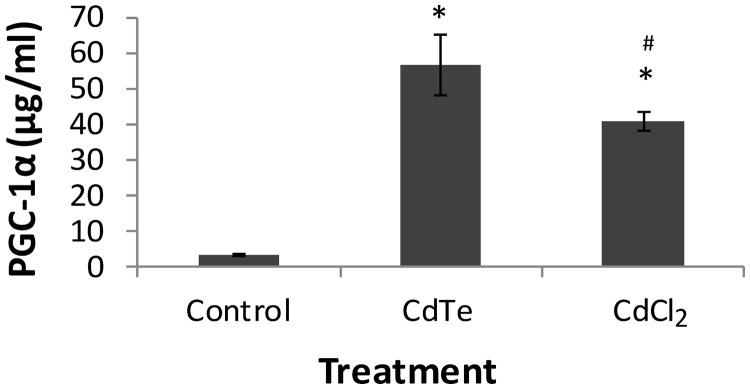
Effects of CdTe-QDs on mitochondrial biogenesis expressed as changes in PGC-1α levels. Cells were treated with CdTe-QDs and CdCl2, at an equivalent concentration of cadmium (1 µg/ml), for 24 h. Data points represent the means of 3 independent experiments ± standard deviations. The asterisks (*) indicate statistically significant differences compared with controls (P < 0.05). The number (#) sign indicates statistically significant difference compared with the CdTe-QD-treated group (P < 0.05).
DISCUSSION
Potential health effects of nanomaterials have been studied intensively in the past few decades. However, the detailed mechanisms of NP toxicity are poorly understood. Cadmium-based QD toxicity has been reported in in vitro and in vivo studies (as reviewed by Hardman, 2006). In addition, our previous studies have shown that CdTe-QDs caused suppression in immune responses to bacteria, oxidative stress, and apoptosis via both extrinsic and intrinsic (mitochondrial) pathways (Nguyen et al., 2013a,b). It is important to investigate further the underlying mechanisms by which these NPs interact with, and affect the functions of cellular components. In particular, mitochondria have been suggested as possible targets for NPs. The aim of this study was to investigate the effects of CdTe-QDs on mitochondrial structure and function. Toward this goal, several hypothesis-driven experiments were developed for screening the mitochondrial toxicity caused by CdTe-QDs and also for investigating the mechanisms underlying the impacts on these organelles following QD exposures.
In initial experiments, cytotoxicity in HepG2 induced by CdTe-QDs was examined. The assay included CdCl2 at equivalent concentrations of cadmium for comparative purposes. CdTe-QDs induced cytotoxicity in HepG2 cell in a dose- and time-dependent manner. This result confirmed our previous studies (Nguyen et al., 2013a,b) and aligned with the findings from other groups (Lovric et al., 2005; Su et al., 2009; Zhang et al., 2007). CdCl2, at equivalent cadmium concentrations, also induced cytotoxicity in the same manner, but appeared to be less cytotoxic compared with CdTe-QDs. This suggests that the effects of CdTe-QDs cannot solely be explained by the action of the cadmium component of the NPs. Beside cadmium, the CdTe-QD core also contains tellurium which represents 3.24% of the total NP mass, based on our ICP-MS analysis. To investigate the possible contribution of tellurium in CdTe-QD cytotoxicity, Na2TeO3 was used as a control. Tellurium concentrations were based on the mass ratio of tellurium/cadmium in the NPs. Our results showed that at tellurium concentrations appropriate for this study, no cytotoxicity was observed in HepG2 cells. Toxicity of tellurium has been previously reported in various cell lines including HeLa (Wen et al., 2013) and human chronic myeloid leukemia cell, K562 (Sandoval et al., 2012), and in immune cells isolated from different aquatic species (Bruneau et al., 2015). However, the tellurium doses that caused toxic effects in these cells were much higher than those we used in this study. Therefore, our findings suggest that the effects of CdTe-QDs in this study were not from tellurium component.
One of the effects of NPs is to cause changes in mitochondrial morphology and structure. Microscopy examination revealed that CdTe-QDs induced mitochondrial swelling and disruption of the normal appearance of their cristae. Our findings agree with a previous study by Cho et al. (2007), who reported that Cys-CdTe-QD treatments to MCF-7 cells resulted in significant mitochondrial swelling and rounding up as observed with confocal microscopy using a Mitotracker dye. Our observations on the changes of mitochondrial morphology and structure with CdTe-QDs also support a recent study on Cd/Se/Te-based QDs 705 toxicity in mice (Lin et al., 2012). This previous study also showed mitochondrial swelling, disorientation, and reduction of mitochondrial number in the proximal convoluted kidney tubule cells of treated mice (Lin et al., 2012). Alteration of mitochondrial morphology and structure, induced by NPs, has also been observed with other types of NPs including DEP, ultrafine air pollution particles, and multiwalled nanotubes. These changes were associated with the localization of NPs within mitochondria (Oberdörster et al., 2005; Xia et al., 2006; Zhu et al., 2006). In this study, the localization of CdTe-QDs within the cells or organelles was not observed clearly with TEM. However, the association of CdTe-QDs with mitochondria was inferred from an increase in fluorescence intensity of the QDs in isolated mitochondria of CdTe-QD-treated cells. The association of CdTe-QDs with the mitochondrial enrichment suggests that mitochondria might be the targets of CdTe-QDs and supports the theory that NPs can be transported across cell membranes specifically into mitochondria (Foley et al., 2002).
Alteration of mitochondrial morphology and structure is typically associated with the damage of mitochondrial integrity including changes in mitochondrial membrane potential and membrane permeability (Petit et al., 1995). The mitochondrial membrane potential is a key indicator of cellular viability, as it reflects the pumping of hydrogen ions across the inner membrane during the process of electron transport and oxidative phosphorylation—the driving force behind ATP production (Chen, 1988). In this study, treatment with CdTe-QDs caused a disruption in mitochondrial membrane potential. Since a similar effect was observed with CdCl2, the disruption of mitochondrial membrane potential could also result from the effects of cadmium, which has also been previously reported by other groups (Bolduc et al., 2004; Liu et al., 2011; Mao et al., 2011; Martel et al., 1990). However, here we also observed the association of CdTe-QDs with mitochondria. Thus, the alteration of mitochondrial membrane potential observed in this study might also result from the direct interaction of these NPs with the organelles causing physical damage and membrane potential collapse, which, in turn, results in mitochondrial swelling. Disruption of mitochondrial membrane potential has also been linked to apoptosis (Gottlieb et al., 2003). The collapse of the mitochondrial membrane potential coincides with the opening of the mitochondrial permeability transition pores, leading to the release of cytochrome c into the cytosol, which triggers other downstream events in the apoptotic cascade (Gottlieb et al., 2003). The disruption of mitochondrial membrane potential supports the findings from our previous studies showing that CdTe-QDs caused release of cytochrome c from mitochondria and apoptosis (Nguyen et al., 2013b).
In this study, the treatment of CdTe-QDs resulted in an increase in intracellular Ca2+. A significant increase in cytosolic Ca2+ in murine J774A,1 macrophages from treatment with different surface-coated cadmium-based QDs was reported by Clift et al. (2010), who suggested that the increase in Ca2+ was mediated via ROS and oxidative stress. Elevation of intracellular Ca2+ was also observed in CdCl2-treated cells, suggesting that the effect of CdTe-QDs on Ca2+ could also come from cadmium component of the NPs. Elevation of intracellular Ca2+ has been linked to apoptosis induced by cadmium (Yeh et al., 2009). It has been proposed that cadmium releases Ca2+ from endoplasmic reticulum and mitochondria in a phospholipase C-independent manner (Yeh et al., 2009). However, in this study, the effect of CdCl2 treatment was much less pronounced compared with that of CdTe-QDs at the same concentration of cadmium, suggesting that cadmium from the NPs is not the sole cause. The observed effect might also be caused by the direct interaction of CdTe-QDs with Ca2+-storing organelles within the cells. Calcium is the key regulator of mitochondrial function. Dysregulation of calcium homeostasis has been shown to play a critical role in mitochondrial dysfunction (Duchen, 2000). The opposite has also been shown in that mechanical injury of mitochondria can lead to disturbance in calcium homeostasis (Rodrigo and Standen, 2005). It is not clear whether the elevation of intracellular Ca2+ in this study is the cause or consequence of mitochondrial damage induced by NPs. It has been shown that elevated intracellular Ca2+ levels can lead to the excessive entry of calcium into the mitochondria, which triggers the opening of the mitochondria permeability transition pore and causes mitochondrial damage (Armstrong, 2006). Therefore, the elevated Ca2+ concentration might be the cause of the alterations of mitochondrial morphology, structure, and membrane potential observed in this study. However, it is possible that the increase in intracellular Ca2+ in CdTe-QD-treated cells is a result of mitochondrial injury caused by physical interaction between the NPs and mitochondria and endoplasmic reticulum, where Ca2+ is stored within the cells, causing release of Ca2+ from these organelles (Chinopoulos and Adam-Vizi, 2006). Thus, the exact mechanism of elevation of intracellular Ca2+ induced by CdTe-QDs is not clear and remains to be further investigated.
Cellular respiration and ATP content are important indicators for mitochondrial function (Brand and Nicholls, 2011). Here, we demonstrated that CdTe-QDs reduced cellular respiration, expressed as oxygen consumption rate and depressed ATP synthesis. The majority of ATP production occurs via oxidative phosphorylation by the mitochondrial respiratory chain, which is essentially driven by the transmembrane electrical potential (Brown, 1992). Depression of ATP synthesis indicated effects of CdTe-QDs on the process of oxidative phosphorylation. Similarly, measurement of oxygen consumption has been considered the most informative parameter for indication of mitochondrial function because the measurement allows direct and specific assessment of the functioning of the ETC, the cornerstone of oxidative phosphorylation and cellular metabolism (Brown, 1992). Oxygen consumption by the mitochondria can be modulated by the uncoupling of oxidative phosphorylation, uncoupling proteins, the opening of the mitochondrial permeability transition pore, or the inhibition of individual components of the ETC (Brand and Nicholls, 2011). In this study, the decrease in oxygen consumption induced by CdTe-QDs suggests the effects of these NPs on the ETC. Our findings agree with a recent study by Li et al. (2011), who also reported changes in cellular respiration in isolated rat liver mitochondria, induced by CdTe-QDs. These authors showed that CdTe-QDs significantly decreased respiratory rate at state 3 and suggested that the NPs affected both the ETC and transport through the mitochondrial inner membrane leading to uncoupled respiration inhibition (Li et al., 2011).
Our study went further to investigate the effects of CdTe-QDs on ETC component enzymes by examining their protein levels and activities. Treatment with CdTe-QDs resulted in selective effects on ETC complexes. The NPs decreased the levels and activities of complexes II, III and IV, while causing no changes in the levels and activities of complex I. Treatment with CdCl2 resulted in similar effects, suggesting that the effects of CdTe-QDs observed on ETC components were from cadmium toxicity. Several studies have reported inhibition of ETC components by cadmium (Belyaeva et al., 2012; Kurochkin et al., 2011; Wang et al., 2004). Cadmium has been shown to inhibit the activities of complexes II (50%–60%) and III (30%–77%) of mitochondrial ETC from guinea pig liver, brain, and heart, but caused insignificant inhibition of the activities of complexes I and IV (Wang et al., 2004). Meanwhile, a study on isolated rainbow trout hepatic mitochondria showed equal inhibitory effects of cadmium on the activities of complexes I, II, and III (Adiele et al., 2012). However, to date, there have been no studies on cadmium toxicity reporting the effects of this element on the levels of ETC enzymes, and the exact mechanism of how cadmium inhibits the mitochondrial ETC enzyme activities is unclear.
In this study, ETC enzyme concentrations were measured and there was a correlation between the effects of CdTe-QDs on the levels and the effects on the enzyme activities. Our study suggests that the decrease in ETC complex activities might be the result of the reduction in the levels of their proteins caused by CdTe-QDs. Similar to complex I, the activity of complex V was not affected by CdTe-QDs in this study; however, these NPs induced an increase in the level of this complex. This can be explained by the compensatory response of the cells to depressed ATP content. Our previous study has shown that CdTe-QDs induced ROS generation, leading to oxidative stress in the same cell line (Nguyen et al., 2013b). Mitochondria are the major source of ROS production in cells, and complexes I and III are the primary sites of ROS production (Li et al., 2003). The impairment of electron transfer through complexes I and III may induce ROS generation (Turrens et al., 1997). Here, the effects of CdTe-QDs on complex III might be one of the sources of ROS production induced by the NPs that were observed in our previous work (Nguyen et al., 2013b).
Mitochondrial biogenesis is defined as the growth and division of pre-existing mitochondria (Jornayvaz and Shulman, 2010). PGC-1α is a transcriptional coactivator, identified as a master regulator of mitochondrial number and function. The protein provides a direct link between external physiological stimuli and the regulation of mitochondrial biogenesis (Knutti and Kralli, 2001). Measurement of PGC-1α levels was performed in this study to examine the effects of CdTe-QDs on mitochondrial biogenesis. This study showed that CdTe-QDs caused a significant increase in PGC-1α levels, suggesting that mitochondrial biogenesis may have been activated. Activation of PGC-1α has been reported as a result of cellular stress in which ROS was suggested to be one type of the signaling molecules to induce mitochondrial biogenesis (Acin-Perez et al., 2009). Overexpression of PGC-1α was also linked to increases in cytosolic Ca2+ which led to the activation of calcium/calmodulin-dependent protein kinase II and subsequently to the activation of p38 mitogen-activated protein kinase which is the upstream regulator of PGC-1α (Wright et al., 2007). Elevation of PGC-1α has also been shown as a response to ATP depletion and mitochondrial dysfunction in conditions such as hypoxia or ischemia (Garcıa-Gimenez et al., 2011; Gutsaeva et al., 2008; Rohas et al., 2007; St-Pierre et al., 2006). Therefore, the increased PGC-1α levels induced by CdTe-QDs observed in this study could be a result of oxidative stress, increased ROS production, and/or increased cytosolic Ca2+, as previously discussed. Overall, the elevation of PGC-1α expression appeared to be a cellular compensatory response to the negative effects of CdTe-QDs on the mitochondrial function, including the decreases in cellular respiration and ATP synthesis induced by these NPs.
In conclusion, we conducted a hypothesis-driven investigation of mitochondrial toxicity induced by CdTe-QDs. Our study has revealed the mitochondria as the intracellular target of CdTe-QDs and demonstrated the effects of these NPs on mitochondrial morphology, structure, and function in HepG2 cells. Mitochondrial swelling and disruption of mitochondrial membrane potential were evident along with elevation of intracellular Ca2+ levels, a decrease in cellular respiration, and a depression of ATP synthesis. Effects on the levels and activities of ETC component enzymes appeared to be selective and explained the observed effects on mitochondrial critical functions and biogenesis. The role of cadmium on mitochondrial toxicity induced by CdTe-QDs was evident in this study; however, cadmium alone cannot explain the entire effects of these NPs. From our findings, it is possible that the NPs interact directly with mitochondria causing membrane damage, membrane potential disruption, and affecting ETC components leading to inhibition of oxidative phosphorylation process.
ACKNOWLEDGMENTS
The authors thank Drs Francesco Marchetti and David Lefebvre for reviewing the manuscript.
FUNDING
Financial support provided through intramural Health Canada funding.
REFERENCES
- Acin-Perez R., Salazar E., Brosel S., Yang H., Schon E. A., Manfredi G. (2009). Modulation of mitochondrial protein phosphorylation by soluble adenylyl cyclase ameliorates cytochrome oxidase defects. EMBO Mol. Med. 1, 392–406. [DOI] [PMC free article] [PubMed] [Google Scholar]
- Adiele R. C., Stevens D., Kamunde C. (2012). Differential inhibition of electron transport chain enzyme complexes by cadmium and calcium in isolated rainbow trout (Oncorhynchus mykiss) hepatic mitochondria. Toxicol. Sci. 127, 110–119. [DOI] [PubMed] [Google Scholar]
- Armstrong J. S. (2006). Mitochondrial membrane permeabilization: The sine qua non for cell death. Bioessays 28, 253–260. [DOI] [PubMed] [Google Scholar]
- Baratli Y., Charles A. L., Wolff V., Ben Tahar L., Smiri L., Bouitbir J., Zoll J., Piquard F., Tebourbi O., Sakly M., et al. (2013). Impact of iron oxide nanoparticles on brain, heart, lung, liver, and kidneys mitochondrial respiratory chain complexes activities and coupling. Toxicol. in vitro 27, 2142–2148. [DOI] [PubMed] [Google Scholar]
- Belyaeva E. A., Sokolova T. V., Emelyanova L. V., Zakharova I. O. (2012). Mitochondrial electron transport chain in heavy metal-induced neurotoxicity: Effects of cadmium, mercury, and copper. Scientific World Journal 2012, 136063. [DOI] [PMC free article] [PubMed] [Google Scholar]
- Boczkowski J., Hoet P. (2010). What’s new in nanotoxicology? Implications for public health from a brief review of the 2008 literature . Nanotoxicology 4, 1–14. [DOI] [PubMed] [Google Scholar]
- Bolduc J. S., Denizeau F., Jumarie C. (2004). Cadmium-induced mitochondrial membrane-potential dissipation does not necessarily require cytosolic oxidative stress: Studies using rhodamine-123 fluorescence unquenching. Toxicol. Sci. 77, 299–306. [DOI] [PubMed] [Google Scholar]
- Brand M. D., Nicholls D. G. (2011). Assessing mitochondrial dysfunction in cells. Biochem. J. 435, 297–312. [DOI] [PMC free article] [PubMed] [Google Scholar]
- Brown G. C. (1992). Control of respiration and ATP synthesis in mammalian mitochondria and cells. Biochem. J. 284(Pt 1), 1–13. [DOI] [PMC free article] [PubMed] [Google Scholar]
- Bruneau A., Fortier M., Gagne F., Gagnon C., Turcotte C., Tayabali A., Davis T. A., Auffret M., Fournier M. (2015). In vitro immunotoxicology of quantum dots and comparison with dissolved cadmium and tellurium. Environ. Toxicol. 30, 9–25. [DOI] [PubMed] [Google Scholar]
- Camp J. P., Capitano A. T. (2007). Induction of zone-like liver function gradients in HepG2 cells by varying culture medium height. Biotechnol. Prog. 23, 1485–1491. [DOI] [PubMed] [Google Scholar]
- Chan W. C., Maxwell D. J., Gao X., Bailey R. E., Han M., Nie S. (2002). Luminescent quantum dots for multiplexed biological detection and imaging. Curr. Opin. Biotechnol. 13, 40–46. [DOI] [PubMed] [Google Scholar]
- Chen L. B. (1988). Mitochondrial membrane potential in living cells. Annu. Rev. Cell Biol. 4, 155–181. [DOI] [PubMed] [Google Scholar]
- Chinopoulos C., Adam-Vizi V. (2006). Calcium, mitochondria and oxidative stress in neuronal pathology. Novel aspects of an enduring theme. FEBS J. 273, 433–450. [DOI] [PubMed] [Google Scholar]
- Cho S. J., Maysinger D., Jain M., Roder B., Hackbarth S., Winnik F. M. (2007). Long-term exposure to CdTe quantum dots causes functional impairments in live cells. Langmuir 23, 1974–1980. [DOI] [PubMed] [Google Scholar]
- Clift M. J., Boyles M. S., Brown D. M., Stone V. (2010). An investigation into the potential for different surface-coated quantum dots to cause oxidative stress and affect macrophage cell signalling in vitro. Nanotoxicology 4, 139–149. [DOI] [PubMed] [Google Scholar]
- De Wild M., Berner S., Suzuki H., Ramoino L., Baratoff A., Jung T. A. (2003). Molecular assembly and self-assembly: Molecular nanoscience for future technologies. Ann. N. Y. Acad. Sci. 1006, 291–305. [DOI] [PubMed] [Google Scholar]
- Dreher K. L. (2004). Health and environmental impact of nanotechnology: Toxicological assessment of manufactured nanoparticles. Toxicol. Sci. 77, 3–5. [DOI] [PubMed] [Google Scholar]
- Duchen M. R. (2000). Mitochondria and calcium: From cell signalling to cell death. J. Physiol. 529(Pt 1), 57–68. [DOI] [PMC free article] [PubMed] [Google Scholar]
- Duchen M. R. (2004). Mitochondria in health and disease: Perspectives on a new mitochondrial biology. Mol. Aspects Med. 25, 365–451. [DOI] [PubMed] [Google Scholar]
- Foley S., Crowley C., Smaihi M., Bonfils C., Erlanger B. F., Seta P., Larroque C. (2002). Cellular localisation of a water-soluble fullerene derivative. Biochem. Biophys. Res. Commun. 294, 116–119. [DOI] [PubMed] [Google Scholar]
- Frezza C., Cipolat S., Scorrano L. (2007). Organelle isolation: Functional mitochondria from mouse liver, muscle and cultured fibroblasts. Nat. Protoc. 2, 287–295. [DOI] [PubMed] [Google Scholar]
- Galante Y. M., Wong S. Y., Hatefi Y. (1979). Composition of complex V of the mitochondrial oxidative phosphorylation system. J. Biol. Chem. 254, 12372–12378. [PubMed] [Google Scholar]
- Gao X., Cui Y., Levenson R. M., Chung L. W., Nie S. (2004). In vivo cancer targeting and imaging with semiconductor quantum dots. Nat. Biotechnol. 22, 969–976. [DOI] [PubMed] [Google Scholar]
- Garcıa-Gimenez J. L., Gimeno A., Gonzalez-Cabo P., Dası F., Bolinches-Amoros A., Molla B., Palau F., Pallardo F. V. (2011). Differential expression of PGC-1α and metabolic sensors suggest age-dependent induction of mitochondrial biogenesis in Friedreich ataxia fibroblasts. PLoS One 6, e20666. [DOI] [PMC free article] [PubMed] [Google Scholar]
- Gottlieb E., Armour S. M., Harris M. H., Thompson C. B. (2003). Mitochondrial membrane potential regulates matrix configuration and cytochrome c release during apoptosis. Cell Death Differ. 10, 709–717. [DOI] [PubMed] [Google Scholar]
- Gutsaeva D. R., Carraway M. S., Suliman H. B., Demchenko I. T., Shitara H., Yonekawa H., Piantadosi C. A. (2008). Transient hypoxia stimulates mitochondrial biogenesis in brain subcortex by a neuronal nitric oxide synthase dependent mechanism. J. Neurosci. 28, 2015–2024. [DOI] [PMC free article] [PubMed] [Google Scholar]
- Hardman R. (2006). A toxicologic review of quantum dots: Toxicity depends on physicochemical and environmental factors. Environ. Health Perspect. 114, 165–172. [DOI] [PMC free article] [PubMed] [Google Scholar]
- Hussain S. M., Hess K. L., Gearhart J. M., Geiss K. T., Schlager J. J. (2005). In vitro toxicity of nanoparticles in BRL 3A rat liver cells. Toxicol. in vitro 19, 975–983. [DOI] [PubMed] [Google Scholar]
- Hynes J., Marroquin L. D., Ogurtsov V. I., Christiansen K. N., Stevens G. J., Papkovsky D. B., Will Y. (2006). Investigation of drug-induced mitochondrial toxicity using fluorescence-based oxygen-sensitive probes. Toxicol. Sci. 92, 186–200. [DOI] [PubMed] [Google Scholar]
- Jornayvaz F. R., Shulman G. I. (2010). Regulation of mitochondrial biogenesis. Essays Biochem. 47, 69–84. [DOI] [PMC free article] [PubMed] [Google Scholar]
- Juzenas P., Chen W., Sun Y. P., Coelho M. A., Generalov R., Generalova N., Christensen I. L. (2008). Quantum dots and nanoparticles for photodynamic and radiation therapies of cancer. Adv. Drug Deliv. Rev. 60, 1600–1614. [DOI] [PMC free article] [PubMed] [Google Scholar]
- Knutti D., Kralli A. (2001). PGC-1, a versatile coactivator. Trends Endocrinol. Metab. 12, 360–365. [DOI] [PubMed] [Google Scholar]
- Kurochkin I. O., Etzkorn M., Buchwalter D., Leamy L., Sokolova I. M. (2011). Top-down control analysis of the cadmium effects on molluscan mitochondria and the mechanisms of cadmium-induced mitochondrial dysfunction. Am. J. Physiol. Regul. Integr. Comp. Physiol. 300, R21–R31. [DOI] [PubMed] [Google Scholar]
- Li J., Zhang Y., Xiao Q., Tian F., Liu X., Li R., Zhao G., Jiang F., Liu Y. (2011). Mitochondria as target of quantum dot toxicity. J. Hazard. Mater. 194, 440–444. [DOI] [PubMed] [Google Scholar]
- Li N., Sioutas C., Cho A., Schmitz D., Misra C., Sempf J., Wang M., Oberley T., Froines J., Nel A. (2003). Ultrafine particulate pollutants induce oxidative stress and mitochondrial damage. Environ. Health Perspect. 111, 455–460. [DOI] [PMC free article] [PubMed] [Google Scholar]
- Lin C. H., Chang L. W., Wei Y. H., Wu S. B., Yang C. S., Chang W. H., Chen Y. C., Lin P. P. (2012). Electronic microscopy evidence for mitochondria as targets for Cd/Se/Te-based quantum dot 705 toxicity in vivo. Kaohsiung J. Med. Sci. 28, S53–S62. [DOI] [PMC free article] [PubMed] [Google Scholar]
- Liu T., He W., Yan C., Qi Y., Zhang Y. (2011). Roles of reactive oxygen species and mitochondria in cadmium-induced injury of liver cells. Toxicol. Ind. Health 27, 249–256. [DOI] [PubMed] [Google Scholar]
- Lovric J., Cho S. J., Winnik F. M., Maysinger D. (2005). Unmodified cadmium telluride quantum dots induce reactive oxygen species formation leading to multiple organelle damage and cell death. Chem. Biol. 12, 1227–1234. [DOI] [PubMed] [Google Scholar]
- Mao W. P., Zhang N. N., Zhou F. Y., Li W. X., Liu H. Y., Feng J., Zhou L., Wei C. J., Pan Y. B., He Z. J. (2011). Cadmium directly induced mitochondrial dysfunction of human embryonic kidney cells. Hum. Exp. Toxicol. 30, 920–929. [DOI] [PubMed] [Google Scholar]
- Martel J., Marion M., Denizeau F. (1990). Effect of cadmium on membrane potential in isolated rat hepatocytes. Toxicology 60, 161–172. [DOI] [PubMed] [Google Scholar]
- Nel A., Xia T., Madler L., Li N. (2006). Toxic potential of materials at the nanolevel. Science 311, 622–627. [DOI] [PubMed] [Google Scholar]
- Nguyen K. C., Seligy V. L., Tayabali A. F. (2013a). Cadmium telluride quantum dot nanoparticle cytotoxicity and effects on model immune responses to Pseudomonas aeruginosa. Nanotoxicology 7, 202–211. [DOI] [PMC free article] [PubMed] [Google Scholar]
- Nguyen K. C., Willmore W. G., Tayabali A. F. (2013b). Cadmium telluride quantum dots cause oxidative stress leading to extrinsic and intrinsic apoptosis in hepatocellular carcinoma HepG2 cells. Toxicology 306, 114–123. [DOI] [PubMed] [Google Scholar]
- Oberdörster G., Maynard A., Donaldson K., Castranova V., Fitzpatrick J., Ausman K., Carter J., Karn B., Kreyling W., Lai D., et al. ; ILSI Research Foundation/Risk Science Institute Nanomaterial Toxicity Screening Working Group. (2005). Principles for characterizing the potential human health effects from exposure to nanomaterials: Elements of a screening strategy. Part Fibre Toxicol. 2, 8. [DOI] [PMC free article] [PubMed] [Google Scholar]
- Petit P. X., Lecoeur H., Zorn E., Dauguet C., Mignotte B., Gougeon M. L. (1995). Alterations in mitochondrial structure and function are early events of dexamethasone-induced thymocyte apoptosis. J. Cell Biol. 130, 157–167. [DOI] [PMC free article] [PubMed] [Google Scholar]
- Pinti M., Troiano L., Nasi M., Ferraresi R., Dobrucki J., Cossarizza A. (2003). Hepatoma HepG2 cells as a model for in vitro studies on mitochondrial toxicity of antiviral drugs: Which correlation with the patient? J. Biol. Regul. Homeost. Agents 17, 166–171. [PubMed] [Google Scholar]
- Rodrigo G. C., Standen N. B. (2005). Role of mitochondrial re-energization and Ca2+ influx in reperfusion injury of metabolically inhibited cardiac myocytes. Cardiovasc. Res. 67, 291–300. [DOI] [PubMed] [Google Scholar]
- Rohas L. M., St-Pierre J., Uldry M., Jager S., Handschin C., Spiegelman B. M. (2007). A fundamental system of cellular energy homeostasis regulated by PGC-1 alpha. Proc. Natl. Acad. Sci. U.S.A. 104, 7933–7938. [DOI] [PMC free article] [PubMed] [Google Scholar]
- Sandoval J. M., Verrax J., Vásquez C. C., Calderon P. B. (2012). A comparative study of tellurite toxicity in normal and cancer cells. Mol. Cell. Toxicol. 8, 327–334. [Google Scholar]
- Santos S. M., Dinis A. M., Peixoto F., Fieerira L., Jurado A. S., Videira R. A. (2014). Interation of fullerene nanoparticles with biomembranes: From the partition in lipid membranes to effects on mitochondrial bioenergetics. Toxicol. Sci. 138, 117–129. [DOI] [PubMed] [Google Scholar]
- Siddiqui M. A., Alhadlaq H. A., Ahmad J., Al-Khedhairy A. A., Musarrat J., Ahamed M. (2013). Copper oxide nanoparticles induced mitochondria mediated apoptosis in human hepatocarcinoma cells. PLoS One 8, e69534. [DOI] [PMC free article] [PubMed] [Google Scholar]
- Smith A. M., Duan H., Mohs A. M., Nie S. (2008). Bioconjugated quantum dots for in vivo molecular and cellular imaging. Adv. Drug Deliv. Rev. 60, 1226–1240. [DOI] [PMC free article] [PubMed] [Google Scholar]
- St-Pierre J., Drori S., Uldry M., Silvaggi J. M., Rhee J., Jager S., Handschin C., Zheng K. N., Lin J. D., Yang W. L., et al. (2006). Suppression of reactive oxygen species and neurodegeneration by the PGC-1 transcriptional coactivators. Cell 127, 397–408. [DOI] [PubMed] [Google Scholar]
- Su Y., He Y., Lu H., Sai L., Li Q., Li W., Wang L., Shen P., Huang Q., Fan C. (2009). The cytotoxicity of cadmium based, aqueous phase - synthesized, quantum dots and its modulation by surface coating. Biomaterials 30, 19–25. [DOI] [PubMed] [Google Scholar]
- Sun L., Li Y., Liu X., Jin M., Zhang L., Du Z., Guo C., Huang P., Sun Z. (2011). Cytotoxicity and mitochondrial damage caused by silica nanoparticles. Toxicol. in vitro 25, 1619–1629. [DOI] [PubMed] [Google Scholar]
- Turrens J. F. (1997). Superoxide production by the mitochondrial respiratory chain. Biosci. Rep. 17, 3–8. [DOI] [PubMed] [Google Scholar]
- Wang Y., Fang J., Leonard S. S., Rao K. M. (2004). Cadmium inhibits the electron transfer chain and induces reactive oxygen species. Free Radic. Biol. Med. 36, 1434–1443. [DOI] [PubMed] [Google Scholar]
- Wen H., Zhong J., Shen B., Gan T., Fu C., Zhu Z., Li R., Yang X. (2013). Comparative study of the cytotoxicity of the nanosized and microsized tellurium powders on HeLa cells. Front. Biol. 8, 444–450. [Google Scholar]
- Will Y., Hynes J., Ogurtsov V. I., Papkovsky D. B. (2006). Analysis of mitochondrial function using phosphorescent oxygen-sensitive probes. Nat. Protoc. 1, 2563–2572. [DOI] [PubMed] [Google Scholar]
- Wojtczak L., Zablocki K. (2008). Mitochondria in cell life, death and disease. Postepy Biochem. 54, 129–141. [PubMed] [Google Scholar]
- Wright D. C., Han D. H., Garcia-Roves P. M., Geiger P. C., Jones T. E., Holloszy J. O. (2007). Exercise-induced mitochondrial biogenesis begins before the increase in muscle PGC-1 alpha expression. J. Biol. Chem. 282, 194–199. [DOI] [PubMed] [Google Scholar]
- Xia T., Kovochich M., Brant J., Hotze M., Sempf J., Oberley T., Sioutas C., Yeh J. I., Wiesner M. R., Nel A. E. (2006). Comparison of the abilities of ambient and manufactured nanoparticles to induce cellular toxicity according to an oxidative stress paradigm. Nano Lett. 6, 1794–1807. [DOI] [PubMed] [Google Scholar]
- Xia T., Li N., Nel A. E. (2010). Potential health impact of nanoparticles. Annu. Rev. Public Health 30, 137–150. [DOI] [PubMed] [Google Scholar]
- Xue Y., Chen Q., Ding T., Sun J. (2014). SiO2 nanoparticle-induced impairment of mitochondrial energy metabolism in hepatocytes directly and through a Kupffer cell-mediated pathway in vitro. Int. J. Nanomed. 9, 2891–2903. [DOI] [PMC free article] [PubMed] [Google Scholar]
- Yeh J. H., Huang C. C., Yeh M. Y., Wang J. S., Lee J. K., Jan C. R. (2009). Cadmium-induced cytosolic Ca2+ elevation and subsequent apoptosis in renal tubular cells. Basic Clin. Pharmacol. Toxicol. 104, 345–351. [DOI] [PubMed] [Google Scholar]
- Zhang Y., Chen W., Zhang J., Liu J., Chen G., Pope C. (2007). In vitro and in vivo toxicity of CdTe nanoparticles. J. Nanosci Nanotechnol. 7, 497–503. [DOI] [PubMed] [Google Scholar]
- Zhu Y., Hong H., Xu Z. P., Li Z., Cai W. (2013). Quantum dot-based nanoprobes for in vivo targeted imaging. Curr. Mol. Med. 13, 1549–1567. [DOI] [PMC free article] [PubMed] [Google Scholar]
- Zhu Y., Zhao Q., Li Y., Cai X., Li W. (2006). The interaction and toxicity of multi-walled carbon nanotubes with Stylonychia mytilus. J. Nanosci. Nanotechnol. 6, 1357–1364. [DOI] [PubMed] [Google Scholar]
- Zorov D. B., Krasnikov B. F., Kuzminova A. E., Vysokikh M. Y., Zorova L. D. (1997). Mitochondria revisited. Alternative functions of mitochondria. Biosci. Rep. 17, 507–520. [DOI] [PubMed] [Google Scholar]