

Abstract
Complex mixtures of environmental agents often cause mixture-specific health effects that cannot be accounted for by a single mechanism. To study the biological effects of exposure to a mixture of chromium-VI and benzo[a]pyrene (B[a]P), often found together in the environment, we exposed mice for 60 days to 0, 55, 550, or 5500 ppb Cr(VI) in drinking water followed by 90 days of coexposure to B[a]P at 0, 1.25, 12.5, or 125 mg/kg/day and examined liver and gastrointestinal (GI) tract for exposure effects. In the liver, the mixture caused more significant histopathology than expected from the sum of effects of the individual components, while in the GI tract, Cr(VI) alone caused significant enterocyte hypertrophy and increases in cell proliferation and DNA damage that were also observed in mice coexposed to B[a]P. Expression of genes involved in drug metabolism, tumor suppression, oxidative stress, and inflammation was altered in mixed exposures relative to control and to singly exposed mice. Drug metabolism and oxidative stress genes were upregulated and tumor suppressor and inflammation genes downregulated in the proximal GI tract, whereas most markers were upregulated in the distal GI tract and downregulated in the liver. Oral exposure to Cr(VI) and B[a]P mixtures appears to have tissue-specific differential consequences in liver and GI tract that cannot be predicted from the effects of each individual toxicant. Tissue specificity may be particularly critical in cases of extended exposure to mixtures of these agents, as may happen in the occupational setting or in areas where drinking water contains elevated levels of Cr(VI).
Keywords: hexavalent chromium, B[a]P, complex mixtures, heavy metals, gene expression
Exposure to a single compound in the environment is rare; more commonly, living organisms are exposed to complex mixtures of natural and man-made compounds. Among these, heavy metals and polycyclic aromatic hydrocarbons (PAHs) are widespread in the environment and are frequent cocontaminants in municipal waste incinerators, fossil fuel burning, car exhaust, and industrial smelting activities. Little is known about the mode of action of complex toxicant mixtures, a knowledge acutely needed to understand the health effects of coexposure. An evaluation of the effects of combined exposures to nonmetabolizable halogenated aromatic hydrocarbons has been proposed based on the relative potency of the individual compounds (Birnbaum and Devito, 1995), and to PAHs based on their relative carcinogenic potency (Collins et al., 1998). Although these approaches are valuable while dealing with mixtures of related compounds (Cizmas et al., 2004), they are inadequate when evaluating complex mixtures of multiple components, because combined exposures generate substance-specific biological changes that cannot be attributed to a single mechanism.
The heavy metal chromium and benzo[a]pyrene (B[a]P), a prototypical PAH, are ranked top among the 20 hazardous substances in the ATSDR/EPA priority list and can be found together in cigarette smoke, exhaust from automotive catalytic converters and industrial waste (Saha et al., 2011). Chromium is a naturally occurring element present in nature in 3 different valence states, metallic Cr(0), trivalent Cr(III), and hexavalent Cr(VI). Cr(0) has uses in industry and medical devices and is of no immediate toxicological concern; Cr(III) displays little or no toxicity, being the most common in the environment (Thompson et al., 2013) and an essential nutrient involved in the metabolism of fats and sugars (Cefalu et al., 2002). Cr(VI) is mainly produced industrially and is considered a human carcinogen and mutagen (Dayan and Paine, 2001). Environmentally, the principal source of exposure to chromium, either Cr(III) or Cr(VI), is drinking water (Zhitkovich, 2011), with the current maximum contaminant level (MCL) in water sources set by the EPA at 100 µg/l or 100 ppb (approximately 2 µM). A recent National Toxicology Program 2-year chronic exposure study to sodium dichromate dehydrate (SDD) in drinking water showed that 60 ppm, a 600-fold excess over the MCL, and higher concentrations of chromium caused intestinal tumors in B6C3F1 mice (National Toxicology Program 2008), possibly as a result of tissue injury and proliferative pressure on crypt cells followed by oxidative DNA damage (Thompson et al., 2011a, 2012). In contrast, occupationally, the principal route of exposure is through air-borne dermal contact and inhalation, with lung cancer as the most common carcinogenic outcome. The maximum admissible limits for workplace exposure to Cr(VI), expressed in terms of the threshold limit value time-weighted average (TLV-TWA), is 0.05 mg/m3 of fume exposure in an 8-h work shift, responsible for an accumulation of 25 µg/l of Cr(VI) in urine (American Conference of Governmental Industrial Hygienists (ACGIH), 2003).
Cr(VI) enters the cell through the sulfate ion transporter and once inside is reduced to reactive intermediates, Cr(V) and Cr(IV), and to a stable Cr(III) state, with the potential generation of reactive oxygen species. The reduction process induces the formation of stable complexes with biological molecules, including Cr(III)-DNA adducts and protein-Cr(III)-DNA crosslinks (Zhitkovich, 2005) leading to the formation of double-strand breaks (DSB) (Ovesen et al., 2014a; Reynolds et al., 2007). These modifications take place at sites of high DNA replication and transcription activity, and often include proteins of the epigenetic machinery (Schnekenburger et al., 2007; Xu et al., 1994). Previous studies in our laboratory have also shown that long-term low Cr(VI) treatment causes chromatin conformation changes in Hepa-1c1c7 cells, opening domains surrounding binding sites for transcription factors and chromatin regulators like AP-1, BACH2, and CTCF (Ovesen et al., 2014b).
Benzo[a]pyrene (B[a]P) is a procarcinogen that requires metabolic activation to become a complete carcinogen. It is metabolized mainly by the cytochromes p450 CYP1A1 and CYP1B1 into the reactive oxygenated intermediate benzo[a]pyrene-diol-epoxide (BPDE) (Conney et al., 1994). B[a]P binds the aryl hydrocarbon receptor (AHR), inducing its translocation to the nucleus and dimerization with the AHR nuclear translocator (ARNT) protein. The complex recognizes the cis-acting AHR response elements (AhREs, also known as DREs and XREs) in the regulatory region of the CYP1A1 gene and many other genes and upregulates their transcription (Nebert et al., 2004; Puga et al., 2009). Exposure to B[a]P and related PAHs occurs mostly via inhalation and the oral route. In laboratory animals, lung tumor formation induced by PAHs is a common finding (Rubin, 2001), while cancer in the gastrointestinal (GI) tract caused by PAH is less frequent. Recently, a 2-year study with oral B[a]P in Wistar rats showed a high incidence of hepatocellular carcinoma in liver and squamous cell carcinoma in forestomach after 100-week daily exposure to 3 mg/kg of B[a]P and higher (Wester et al., 2012). Tumors in the oral cavity, GI tract, skin and appendages, auditory canal, and kidney also appeared but with less incidence (Wester et al., 2012).
Because humans are environmentally and occupationally coexposed to binary mixtures of Cr(VI) and B[a]P and both toxicants are carcinogenic when mice are independently exposed to high doses of each component, we designed a long-term low-dose experimental study in mice to test the null hypothesis that coexposure to these 2 agents would cause additive effects, indistinguishable from those caused by each component alone. Our results show that this is not the case and that a mixture of Cr(VI) and B[a]P has tissue-specific differential effects in liver and gastrointestinal tract that cannot be predicted from the additive effects of each of the components, leading us to reject the null hypothesis.
MATERIALS AND METHODS
Mice, Treatments, and Tissue Collection
C57BL/6 J mice were housed in the Experimental Laboratory Animals Medical Services at the University of Cincinnati under controlled conditions of temperature, humidity, and lighting, and provided standard mouse chow and water ad libitum. All the experimental procedures conducted have been approved by the University of Cincinnati Institutional Animal Care and Use Committee. Mice were exposed for 60 days to 0, 55, 550, or 5500 ppb of SDD dissolved in drinking water as a source of Cr(VI), hereafter referred to as simply “chromium” or “Cr(VI)”, followed by 90 days of coexposure to these SDD concentrations combined with 4 different doses of B[a]P via chow: 0 (corn oil as a vehicle), 1.25, 12.5, or 125 mg/kg/day (Table 1). Body weight was determined every other week during the last 3 months. After exposure, mice were killed and liver weight was measured to determine the ratio of liver/body weight. The gastrointestinal tract was collected and divided into approximately 2 halves, one termed the proximal section (PSI) and the other the distal section (DSI), based on the position relative to the stomach. Liver, PSI, and DSI tissues, were divided in 2 parts, one for histological examination and the other for molecular biology analyses. The samples for molecular biology were frozen in liquid nitrogen and stored at −80°C, and the samples for histological examination were fixed in paraformaldehyde and embedded in paraffin. Two males and 2 females from different mouse litters were analyzed in each group.
TABLE 1.
Doses Used for Mouse Exposure
| Cr(VI) in drinking water (Sodium dichromate dihydrate, SDD) | Benzo[a]pyrene in chow (mg/kg/day) | |||
|---|---|---|---|---|
| 0 ppb (0.0 µM) | Corn oil | 1.25 | 12.5 | 125 |
| 55 ppb (0.671 µM) | Corn oil | 1.25 | 12.5 | 125 |
| 550 ppb (6.711 µM) | Corn oil | 1.25 | 12.5 | 125 |
| 5500 ppb (67.11 µM) | Corn oil | 1.25 | 12.5 | 125 |
Histopathology and immunohistochemistry
Paraffin embedded tissues were sectioned into 5 -µm sections and mounted on glass slides. For microscopic examination, the slides were stained with hematoxylin and eosin. The slides were diagnosed and the lesions were ranked for severity to allow comparison between groups. For immunohistochemistry, the sections were boiled for 10 minutes in sodium citrate buffer (pH 6.0) for antigen retrieval, cooled down at room temperature and blocked in 3% (w/v) bovine serum albumin in phosphate (BSA-PBS) buffer for 60 minutes at room temperature. The sections were probed with anti-Ki67 (Millipore) and anti-phospho-H2A.X (Ser139) (Millipore) antibodies overnight at 4°C in 3% (w/v) BSA-PBS buffer. Detection was done using a secondary rabbit (Ki67), or mouse (H2A.X), antibody ABC staining system (Santa Cruz Biotechnology, Inc.) following the manufacturer’s instructions. The processed sections were counter-stained with hematoxylin. Photographs were taken using an Axioplan Zeiss microscope equipped with an AxionCam ICm1. For every mouse, 6 images were taken per slide, making 24 pictures per condition tested. Ki-67 and phospho-H2A.X (Ser139) positive cells were scored using ImageJ software.
Reverse transcription and real-time PCR
Total RNA was isolated from frozen tissue samples with a RNeasy Mini kit (Qiagen) using the manufacturer’s instructions. Reverse transcription was performed using random hexamer primers and SuperScript III transcriptase (Invitrogen) as described previously (Wang et al., 2013). Real-time PCR was performed to quantify the expression levels of different genes, using Gapdh mRNA as the standard. Supplementary Table 1 shows the primers used for each gene. Raw data was analyzed using the 2ΔΔCt method. Heat maps were done using WebGimm software.
Cell lysates and Western immunoblot analysis
Tissue samples were homogenized prior to lysis in an Ultra-Turrax T25 homogenizer (Janke & Kunkel, Ika Labortechnik), in NETN buffer containing 100 mM NaCl, 20 mM Tris pH 8.0, 1 mM EDTA, 0.5% NP-40, 1× complete protease inhibitor (Roche). Samples were lysed by sonication (Sonic Dismembrator 60, Fisher Scientific) and spun down at 14 000 rpm for 15 minutes. Supernatants were collected and protein concentration was determined using the Bradford assay. Proteins were separated in sodium dodecyl sulphate (SDS) 12.5% polyacrylamide gels and transferred to polyvinylidene fluoride (PVDF) membrane by electroblotting. Blots were probed with anti-CYP1A1 (a gift of Dr. Mary Beth Genter), anti-GCLC (Novus Biologicals), anti-NRF2 (Novus Biologicals), and anti-β-actin (Sigma-Aldrich) overnight at 4°C in TBS-T buffer (50 mM Tris-HCl pH 7.5, 150 mM NaCl, 0.2% Tween-20) containing 5% (w/v) nonfat milk. After washing, the blots were incubated with the appropriate secondary antibodies in Tris-buffered saline with tween-20 (TBS-T) during 1 hour at room temperature and thereafter were incubated with chemiluminescence reagent PicoWest Super Signal (Pierce) and visualized in a Li-Cor C-digit Blot Scanner. Band intensity was evaluated using image Studio Digits 4.0 software. Due to limiting protein amounts, liver samples were analyzed individually but GI tract samples were pooled together by sex.
Statistical analysis
Data are shown as the mean ± SEM. Group comparison were made using 1-way ANOVA followed by post hoc Bonferroni adjustment. A p < .05 was considered statistically significant.
RESULTS
Coexposure to Cr(VI) and B[a]P Does Not Cause Changes in Body Weight
The doses of chromium that we chose bracket water concentrations in the range comprised from 0.5× the EPA MCL to 5× and 50× the MCL. These doses are within environmentally and occupationally relevant ranges (Costa and Klein 2006) and 12 times below the 60 ppm dose used in the National Toxicology Program study alluded to earlier. To determine if coexposure caused gross changes in the exposed mice, we measured body weights every other week, starting at the end of the 2-month single chromium exposure and lasting for the 3-month duration of the coexposure. Additionally, we also measured liver weights while killing, ie, on day 90 of coexposure. We found no significant changes in liver weight normalized to body weight at any of the dose combinations tested (Supplementary Figure 1A). Cr(VI) alone caused no changes in body weight (data not shown), but B[a]P at the higher concentration of 125 mg/kg/day caused a body weight reduction of 10–15% in all the mice tested, regardless of the chromium dose in the mixture (Supplementary Figure 1B–D). This reduction, although appreciable, was not statistically significant. We conclude that coexposure at the environmental doses tested does not cause gross growth changes in the exposed mice.
Histopathological Changes in Liver and GI Tract
Oral exposure to Cr(VI) and B[a]P is carcinogenic to mice and rats when each agent is used individually. Two-year exposure of mice to Cr(VI) at doses higher than 60 ppm in drinking water (Thompson et al., 2011a, 2012) and 2-year exposure of rats to B[a]P at 3 mg/kg/day and higher (Wester et al., 2012) caused intestinal and hepatic tumors, respectively. Based on this information, we wished to test whether significantly lower doses and shorter exposure times, both at the environmentally or occupationally relevant levels, would cause significant biological effects. For histopathological examination, we chose liver, and proximal, (PSI) and distal, (DSI) sections of the GI tract, selecting for these analyses the 4 extreme exposure groups out of the 16 dose combinations tested, ie, null-Cr + null-B[a]P control; null-Cr + 125 mg/kg/day B[a]P; 5500 ppb Cr + null-B[a]P; and 5500 ppb Cr + 125 mg/kg/day B[a]P. This choice was based on the expectation that, if coexposure caused differential effects relative to the individual components, the effect might be more evident when we compared the extreme combined doses.
Histopathological examination of the GI tract showed that none of the control mice presented villous blunting/atrophy, crypt or atypical hyperplasia, enterocyte hypertrophy, or inflammation in either PSI (Table 2) or DSI (Table 3) sections. Neither villous atrophy/blunting nor inflammation appear in the mice exposed to Cr(VI), B[a]P or Cr(VI), and B[a]P together. However, in the PSI section, 3 of 4 mice developed a slight enterocyte hypertrophy when exposed to Cr(VI), a lesion that was more severe when the mice were exposed to just B[a]P or coexposed to Cr(VI) and B[a]P (Table 2; Figure 1A). For all the treatment conditions, hypertrophy was also present in the DSI, where it was more severe than in the PSI (Table 3). Cr(VI) exposure caused a slight, Grade 2, enterocyte hypertrophy in 2 of 4 mice and a milder one, Grade 1, in 1 of 4, with only 1 mice that did not show this lesion. As in the PSI, exposure to B[a]P or coexposure to Cr(VI) and B[a]P caused the same effects of mild enterocyte hypertrophy in 2 mice and slight enterocyte hypertrophy in the other 2 mice (Table 3; Figure 1A). In addition, both PSI and DSI showed a slight crypt hyperplasia when the mice were exposed to just Cr(VI), while in mice exposed to B[a]P, this pathology was more severe than with Cr(VI) alone and the effect was cumulative when the mice were coexposed to both toxicants (Tables 2 and 3; Figure 1A). The last lesion presented in the GI tract was atypical hyperplasia, which appeared only with a slight grade when the mice were exposed to B[a]P (Tables 2 and 3; Figure 1B).
TABLE 2.
Summary of PSI Histopathology
| 0 ppb Cr(VI) + 0 mg/kg/day B[a]P |
5550 ppb Cr(VI) + 0 mg/kg/day B[a]P |
0 ppb Cr(VI) + 125 mg/kg/day B[a]P |
5550 ppb Cr(VI) + 125 mg/kg/day B[a]P |
|||||||||||||||||
|---|---|---|---|---|---|---|---|---|---|---|---|---|---|---|---|---|---|---|---|---|
| G. 0 | G. 1 | G. 2 | G. 3 | G. 4 | G. 0 | G. 1 | G. 2 | G. 3 | G. 4 | G. 0 | G. 1 | G. 2 | G. 3 | G. 4 | G. 0 | G. 1 | G. 2 | G. 3 | G. 4 | |
| Villous atrophy/blunting | (4/4) | (0/4) | (0/4) | (0/4) | (0/4) | (4/4) | (0/4) | (0/4) | (0/4) | (0/4) | (4/4) | (0/4) | (0/4) | (0/4) | (0/4) | (4/4) | (0/4) | (0/4) | (0/4) | (0/4) |
| Enterocyte hypertrophy | (4/4) | (0/4) | (0/4) | (0/4) | (0/4) | (1/4) | (3/4) | (0/4) | (0/4) | (0/4) | (0/4) | (1/4) | (3/4) | (0/4) | (0/4) | (0/4) | (1/4) | (3/4) | (0/4) | (0/4) |
| Crypt hyperplasia | (4/4) | (0/4) | (0/4) | (0/4) | (0/4) | (1/4) | (3/4) | (0/4) | (0/4) | (0/4) | (0/4) | (3/4) | (1/4) | (0/4) | (0/4) | (0/4) | (1/4) | (3/4) | (0/4) | (0/4) |
| Atypical hyperplasia | (4/4) | (0/4) | (0/4) | (0/4) | (0/4) | (4/4) | (0/4) | (0/4) | (0/4) | (0/4) | (2/4) | (2/4) | (0/4) | (0/4) | (0/4) | (4/4) | (0/4) | (0/4) | (0/4) | (0/4) |
| Inflammation histiocytic infiltration) | (4/4) | (0/4) | (0/4) | (0/4) | (0/4) | (4/4) | (0/4) | (0/4) | (0/4) | (0/4) | (4/4) | (0/4) | (0/4) | (0/4) | (0/4) | (4/4) | (0/4) | (0/4) | (0/4) | (0/4) |
| Total score | 0 | 6 | 14 | 14 | ||||||||||||||||
Histological grade: grade 0 (G.0), absent; grade 1 (G. 1), minimal; grade 2 (G. 2), mild; grade 3 (G. 3), moderate; grade 4 (G. 4), severe. The denominator is the number of mice examined
TABLE 3.
Summary of DSI Histopathology
| 0 ppb Cr(VI) + 0 mg/kg/day B[a]P |
5550 ppb Cr(VI) + 0 mg/kg/day B[a]P |
0 ppb Cr(VI) + 125 mg/kg/day B[a]P |
5550 ppb Cr(VI) + 125 mg/kg/day B[a]P |
|||||||||||||||||
|---|---|---|---|---|---|---|---|---|---|---|---|---|---|---|---|---|---|---|---|---|
| G. 0 | G. 1 | G. 2 | G. 3 | G. 4 | G. 0 | G. 1 | G. 2 | G. 3 | G. 4 | G. 0 | G. 1 | G. 2 | G. 3 | G. 4 | G. 0 | G. 1 | G. 2 | G. 3 | G. 4 | |
| Villous atrophy/blunting | (4/4) | (0/4) | (0/4) | (0/4) | (0/4) | (4/4) | (0/4) | (0/4) | (0/4) | (0/4) | (4/4) | (0/4) | (0/4) | (0/4) | (0/4) | (4/4) | (0/4) | (0/4) | (0/4) | (0/4) |
| Enterocyte hypertrophy | (4/4) | (0/4) | (0/4) | (0/4) | (0/4) | (1/4) | (2/4) | (1/4) | (0/4) | (0/4) | (0/4) | (2/4) | (2/4) | (0/4) | (0/4) | (0/4) | (2/4) | (2/4) | (0/4) | (0/4) |
| Crypt hyperplasia | (4/4) | (0/4) | (0/4) | (0/4) | (0/4) | (1/4) | (3/4) | (0/4) | (0/4) | (0/4) | (0/4) | (3/4) | (1/4) | (0/4) | (0/4) | (0/4) | (1/4) | (3/4) | (0/4) | (0/4) |
| Atypical hyperplasia | (4/4) | (0/4) | (0/4) | (0/4) | (0/4) | (4/4) | (0/4) | (0/4) | (0/4) | (0/4) | (2/4) | (2/4) | (0/4) | (0/4) | (0/4) | (4/4) | (0/4) | (0/4) | (0/4) | (0/4) |
| Inflammation (histiocytic infiltration) | (4/4) | (0/4) | (0/4) | (0/4) | (0/4) | (4/4) | (0/4) | (0/4) | (0/4) | (0/4) | (4/4) | (0/4) | (0/4) | (0/4) | (0/4) | (4/4) | (0/4) | (0/4) | (0/4) | (0/4) |
| Total score | 0 | 7 | 13 | 13 | ||||||||||||||||
Histological grade: grade 0 (G. 0), absent; grade 1 (G. 1), minimal; grade 2 (G. 2), mild; grade 3 (G. 3), moderate; grade 4 (G. 4), severe.
FIG. 1.

A, Representative H&E (10×) images of the villus and crypt of proximal (PSI) and distal (DSI) sections of the GI tract. B, Representative H&E (2.5x and 40x) image of an atypical hyperplasia presented in the GI tract with 125 mg/kg/day B[a]P.
In the histopathological analysis of the liver, no mice presented mixed cell infiltrate or necrosis beyond the slight mononuclear-cell infiltrate and degeneration that were observed also in 2 of 4 control mice (Table 4). Interestingly, exposure to Cr(VI) had no effect in the liver (Table 4; Figure 2). Pigmented granuloma and oval cell hypertrophy were not present in the mice exposed to Cr(VI) or B[a]P, although these 2 lesions were present in a slight form in the mice coexposed to both toxicants (Table 4). When mice were exposed to B[a]P alone, decreased glycogen, pigmented hepatocytes, and pigmented Kupffer cells were observed with a slight grade in liver. Intriguingly, Cr(VI) exposure alone did not cause any of these effects, yet the grade of these lesions was much higher when the mice were coexposed to Cr(VI) and B[a]P than when exposed to B[a]P alone (Table 4; Figure 2). Unlike the observations in the GI tract, these results suggest that in the liver, Cr(VI) and B[a]P have an effect more significant than just the sum, or the subtraction, of the effects of either single agent.
TABLE 4.
Summary of Liver Histopathology
| 0 ppb Cr(VI) + 0 mg/kg/day B[a]P |
5550 ppb Cr(VI) + 0 mg/kg/day B[a]P |
0 ppb Cr(VI) + 125 mg/kg/day B[a]P |
5550 ppb Cr(VI) + 125 mg/kg/day B[a]P |
|||||||||||||||||
|---|---|---|---|---|---|---|---|---|---|---|---|---|---|---|---|---|---|---|---|---|
| G. 0 | G. 1 | G. 2 | G. 3 | G. 4 | G. 0 | G. 1 | G. 2 | G. 3 | G. 4 | G. 0 | G. 1 | G. 2 | G. 3 | G. 4 | G. 0 | G. 1 | G. 2 | G. 3 | G. 4 | |
| Infiltrate, mononuclear cell | (0/4) | (4/4) | (0/4) | (0/4) | (0/4) | (0/4) | (4/4) | (0/4) | (0/4) | (0/4) | (0/4) | (4/4) | (0/4) | (0/4) | (0/4) | (0/4) | (3/4) | (1/4) | (0/4) | (0/4) |
| Infiltrate, mixed cell | (4/4) | (0/4) | (0/4) | (0/4) | (0/4) | (4/4) | (0/4) | (0/4) | (0/4) | (0/4) | (4/4) | (0/4) | (0/4) | (0/4) | (0/4) | (4/4) | (0/4) | (0/4) | (0/4) | (0/4) |
| Degeneration | (2/4) | (2/4) | (0/4) | (0/4) | (0/4) | (2/4) | (2/4) | (0/4) | (0/4) | (0/4) | (2/4) | (2/4) | (0/4) | (0/4) | (0/4) | (0/4) | (4/4) | (0/4) | (0/4) | (0/4) |
| Necrosis | (4/4) | (0/4) | (0/4) | (0/4) | (0/4) | (4/4) | (0/4) | (0/4) | (0/4) | (0/4) | (4/4) | (0/4) | (0/4) | (0/4) | (0/4) | (4/4) | (0/4) | (0/4) | (0/4) | (0/4) |
| Decreased glycogen | (4/4) | (0/4) | (0/4) | (0/4) | (0/4) | (4/4) | (0/4) | (0/4) | (0/4) | (0/4) | (1/4) | (3/4) | (0/4) | (0/4) | (0/4) | (0/4) | (0/4) | (4/4) | (0/4) | (0/4) |
| Pigment, kupffer cell | (4/4) | (0/4) | (0/4) | (0/4) | (0/4) | (4/4) | (0/4) | (0/4) | (0/4) | (0/4) | (0/4) | (4/4) | (0/4) | (0/4) | (0/4) | (0/4) | (2/4) | (2/4) | (0/4) | (0/4) |
| Pigment hepatocyte | (4/4) | (0/4) | (0/4) | (0/4) | (0/4) | (4/4) | (0/4) | (0/4) | (0/4) | (0/4) | (2/4) | (2/4) | (0/4) | (0/4) | (0/4) | (0/4) | (1/4) | (3/4) | (0/4) | (0/4) |
| Pigment granuloma | (4/4) | (0/4) | (0/4) | (0/4) | (0/4) | (4/4) | (0/4) | (0/4) | (0/4) | (0/4) | (4/4) | (0/4) | (0/4) | (0/4) | (0/4) | (2/4) | (1/4) | (1/4) | (0/4) | (0/4) |
| Oval cell hypertrophy | (4/4) | (0/4) | (0/4) | (0/4) | (0/4) | (4/4) | (0/4) | (0/4) | (0/4) | (0/4) | (4/4) | (0/4) | (0/4) | (0/4) | (0/4) | (2/4) | (2/4) | (0/4) | (0/4) | (0/4) |
| Total score | 6 | 6 | 15 | 35 | ||||||||||||||||
Histological grade: grade 0 (G. 0), absent; grade 1 (G. 1), minimal; grade 2 (G. 2), mild; grade 3 (G. 3), moderate; grade 4 (G. 4), severe.
FIG. 2.
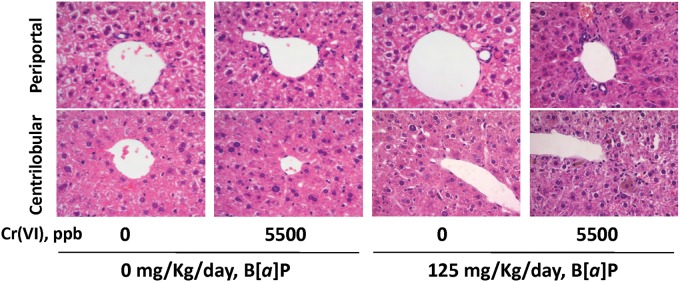
Representative H&E (10×) images of the periportal and centrilobular regions of the liver.
Immunohistochemistry of Cell Proliferation and DNA Damage Markers
To further characterize the potential toxic effects of combined exposures on GI tract and liver, we examined the effects of these 2 toxicants on cell proliferation and DNA damage. To this effect, we used immunochemical detection of Ki67 and phospho-γH2AX expression, markers of S-phase DNA synthesis and DNA damage, respectively. We tested the same 4 doses of Cr(VI) exposure, 0, 55, 550, and 5500 ppb combined or not with the highest B[a]P dose of 125 mg/kg/day. In the GI tract, Cr(VI) alone at any dose had no effect on the number of Ki67-positive cells in comparison with control unexposed mice, having 30% and 6% Ki67-positive cells in the PSI and DSI, respectively (Figures 3A and 3B). B[a]P at 125 mg/kg/day caused a significant increase in the number of cells positive for Ki67 in the PSI. This effect was further increased by Cr(VI) in a dose-dependent manner when the mice were coexposed to Cr(VI) and B[a]P (Figure 3A). In the DSI, 125 mg/kg/day B[a]P caused a doubling of Ki67-positive cells, and Cr(VI) caused a significant dose-dependent reduction in this number when coexposed with B[a]P (Figure 3B). In the absence of toxicants, the liver showed a number of positive cells significantly higher than the GI tract, and Cr(VI) induced an increment in this number, although this effect of Cr(VI) was not dose-dependent (Figure 3C). A similar effect of Cr(VI) on Ki67 numbers was observed when mice were exposed to B[a]P. As in the PSI, coexposure with B[a]P significantly increased the number of cells positive for Ki67 relative to control or to each compound alone (Figure 3C).
FIG. 3.

Immunohistochemical determination of Ki67 expression. A, PSI; B, DSI; and C, liver. For each condition 3 fields in each of 12 micrographs from male mice and another 12 from female mice, were taken and quantified In each field, 250–300 cells were analyzed for PSI and DSI and 75–100 cells were analyzed for liver. Magnification was 40×. Data shown represents the mean ± SEM. The symbol (*) denotes p < .05 different from the control condition of mice gavaged with corn oil. The character (a) denotes p < .05 different from mice exposed to 0 ppb Cr(VI) and 125 mg/kg/day B[a]P. The symbol (#) denotes p < .05 different from mice treated with the same dose of Cr(VI) but not treated with B[a]P.
With regards to phospho-γH2AX analyses, the PSI showed a slight, but not statistically significant, dose-independent increment in the number of positive cells in B[a]P exposed mice, and Cr(VI) had no effect on this number at any dose (Figure 4A). Unlike the PSI, Cr(VI) alone induced a 1.5-fold increment in the number of phospho-γH2AX-positive cells in the DSI, but without a dose-dependent effect (Figure 4B). Exposure to B[a]P induced a 3-fold increase in positive cells, from less than 1% to ca. 2.5%. In this case, coexposure with Cr(VI) did not add to the increment induced by B[a]P (Figure 4B). In the liver, exposure to 125 mg/kg/day B[a]P induced a significant increase in the number of phospho-γH2AX-positive cells (Figure 4C). In this tissue, Cr(VI) caused a significant increase in positive cells at every dose tested, independently of coexposure or not with B[a]P. These results indicate that coexposure to Cr(VI) and B[a]P has unexpected dose- and tissue-specific effects in DNA damage and cell proliferation.
FIG. 4.

Immunohistochemical determination of phospho-γH2AX. All details as in the legend to Figure 3.
Gene Expression Changes Induced by Coexposure to Cr(VI) and B[a]P
Recent findings in our laboratory have shown that both short-term high-dose and long-term low-dose Cr(VI) exposure disrupt the inducible transcriptional response to B[a]P in Hepa-1 cells (Fan et al., 2012; Ovesen et al., 2014a; Wei et al., 2004). To determine whether these finding would also apply in vivo, we measure gene expression patterns in PSI, DSI, and liver of a battery of known or suspected B[a]P-target genes, including genes involved in drug metabolism (Cyp1a1 and Cyp1b1), oxidative stress (Hmox1, Nrf2, Gclc, Gclm, Gpx1, Gpx4, Gstp1, Gsta4, and Gstm5), tumor suppression (Cdkn1a/p21, Cdkn1b/p27, Cdkn2a/p16, Cdkn2b/p15, Cdkn2c/p18, Cdkn2c/p19, Hras, and P73), and inflammation (Tnfα and Il6). In the PSI, coexposure caused for the most part the upregulation of drug metabolism genes and the downregulation of inflammation and tumor suppression genes (Figure 5A), whereas the DSI showed upregulation of most genes analyzed (Figure 5B). In both GI tract sections, the most severe changes took place when mice were exposed to 125 mg/kg/day of B[a]P (Figures 5A and 5B). In contrast, the majority of genes tested in the liver were downregulated, with the exception of Cyp1a1 and Cdkn1a/p21 that were upregulated when the mice were exposed to 125 mg/kg/day of B[a]P (Figure 5C). Side-by-side comparison of this gene group shows that the extent of upregulation was more severe in the DSI and PSI, while in the liver these genes were either unaffected or slightly downregulated (Supplementary Figure 2). These results indicate that, coexposure to Cr(VI) and B[a]P in vivo causes gene expression changes that, as was the case of cell proliferation and DNA damage markers, are tissue-specific, with the different tissues tested having different sensitivities to the mixture.
FIG. 5.

Gene expression heat map for A, PSI; B, DSI; and C, liver. mRNA expression was measured by qRT-PCR for drug metabolism genes (Cyp1a1 and Cyp1b1), oxidative stress genes (Hmox1, Nrf2, Gclc, Gclm, Gpx1, Gpx4, Gstp1, Gsta4, and Gstm5), tumor suppressor genes (Cdkn1a/p21, Cdkn1b/p27, Cdkn2a/p16, Cdkn2b/p15, Cdkn2c/p18, Cdkn2c/p19, Hras, and P73) and pro inflammatory genes (Tnfα and Il6). All 16 dose combinations are shown.
Tissue-Specific Changes in CYP1A1 and Oxidative Stress Proteins
Our laboratory has shown that Cr(VI) inhibits B[a]P-mediated Cyp1a1 activation by interfering with the epigenetic machinery that regulates gene expression in Hepa-1 cells (Schnekenburger et al., 2007). To determine if this phenomenon also occurs in vivo, we followed the levels of CYP1A1 mRNA and protein in PSI, DSI, and liver of coexposed mice. As in previous experiments, we selected for these analyses the 4 extreme exposure groups, ie, null-Cr + null-B[a]P control; null-Cr + 125 mg/kg/day B[a]P; 5500 ppb Cr + null-B[a]P; and 5500 ppb Cr + 125 mg/kg/day B[a]P. In none of the tissues tested did Cr(VI) induce statistically significant changes in CYP1A1 mRNA levels (Figure 5) and only a slight but significant protein increase in the liver of males, but not females (Figure 6). As expected, CYP1A1 levels were highly induced by B[a]P in all sexes and tissues tested, and when mice were coexposed to Cr(VI), the effects were additive in male and female livers (Figure 6). In contrast, Cr(VI) inhibited the B[a]P-dependent increase in male PSI and female DSI and synergized with B[a]P in male DSI, but had no effect in the female PSI (Figure 7).
FIG. 6.

Western immunoblot analysis of CYP1A1 expression. A Representative immunoblot of CYP1A1 in the tissues of mice exposed to the 4 extreme conditions tested, ie, control, 0 ppb Cr(VI) + 0 mg/kg/day B[a]P; 0 ppb Cr(VI) + 125 mg/kg/day B[a]P; 5500 ppb Cr(VI) + 0 mg/kg/day B[a]P; and 5500 ppb Cr(VI) + 125 mg/kg/day B[a]P. Immunoblot band intensities were quantified and are shown in (B), (C), and (D) for PSI, DSI, and liver, respectively, normalized to β-actin. A total protein extract from control and 8-hour B[a]P-treated mouse hepatoma Hepa-1 cells were used as a negative and positive control, respectively. The values shown correspond to the mean ± SEM of the band intensity relative to the indicated bands. *p < .05; **p < .01; ***p < .001; ****p < 0.0001.
FIG. 7.

Western immunoblot analysis of GCLC and NRF2. Representative immunoblot of GCLC and NRF2 in the same tissues as in Figure 5. Immunoblot band intensities were quantified and are shown in (A), (B), and (C) for PSI, DSI, and liver, respectively, normalized to β-actin. As a positive control for GCLC, a total protein extract from mouse kidney was used. For NRF2, A total protein extract from control and 8-hr B[a]P-treated mouse hepatoma Hepa-1 cells were used as a negative and positive control, respectively. The values shown correspond to the mean ± SEM of the band intensity relative to the indicated bands. Statistical comparisons as in Figure 6.
These results with CYP1A1 protein expression suggested the possibility that other Cr(VI)-dependent effects on gene expression regulation might also be sex- and tissue-dependent. To test this possibility, we examined the response to Cr(VI) and B[a]P of proteins involved in the response to oxidative stress in the target tissues under study. Cellular metabolism of both Cr(VI) and B[a]P is known to induce reactive oxygen species (ROS) (Penning et al., 1999; Zhitkovich, 2005), and, as shown in the gene expression data presented in Figure 5, genes involved in oxidative stress defense or generation were for the most part upregulated in PSI and DSI. To verify these results at the protein levels, we examined by Western immunoblotting the expression of the glutamyl-cysteine ligase catalytic subunit, GCLC, and the NF-E2-related factor 2, NRF-2. These 2 proteins are involved in the oxidative stress response by regulating glutathione biosynthesis and antioxidant gene expression, respectively. Cr(VI) and B[a]P both increased GCLC levels in the liver of both sexes, and Cr(VI) decreased the B[a]P-induced increase when used in combination. A similar pattern was observed for NRF-2 in males, in which, unlike in females, Cr(VI) decreased significantly the induction due to B[a]P (Figure 6). In the male GI tract PSI, Cr(VI) did not change significantly the expression of these proteins, but B[a]P did, and, in combined exposures, Cr(VI) blocked almost completely the B[a]P effect, a finding that did not take place in females (Figure 7). The reverse was true in the DSI, where males showed additive effects of Cr(VI) plus B[a]P in males and antagonistic effects in females (Figure 7). The levels of NRF-2 in females were too low to warrant accurate statistical analyses. These data strongly suggest that the oxidative stress response resulting from coexposure to Cr(VI) and B[a]P is exquisitely tissue- and sex-specific.
DISCUSSION
The studies described in this article show that coexposure to environmentally relevant Cr(VI) and B[a]P doses administered orally causes sex- and tissue-specific effects in the GI tract and liver. These effects are evident not only at the molecular level, with changes in gene expression, but also at the histopathological level. In the GI tract, the pathology findings show a cumulative toxicity effect in crypt hyperplasia, with more severe lesions in the liver when mice were exposed to the mixture. Although coexposure to Cr(VI) and B[a]P causes differential effects in the different tissues tested, it also increases the tissue responses on multiple endpoints, including the numbers of Ki67-positive or phospho-γH2AX-positive cells, the patterns of gene expression, and the expression of oxidative stress-related proteins. These findings may be critical and relevant in long-term human exposure to mixtures of these 2 toxicants.
In agreement with recent work in rats (Wester et al., 2012) and mice (Labib et al., 2013; Wester et al., 2012), our long-term exposure to 125 mg/kg/day B[a]P reduced mice body weight by more than 10%; this effect was not modified by coexposure with Cr(VI) at any of the concentrations used, including the highest dose of 5500 ppb (5.5 mg/l) used in our studies. This result was to be expected, because much higher Cr(VI) doses, in the range of 125 mg/l in B6C3F1 mice (Thompson et al., 2011b) or 520 mg/l in F344 rats (Thompson et al., 2012) were needed to cause a significant reduction in body weight from oral intake of sodium dichromate dehydrate in drinking water.
B[a]P has species-specific as well as tissue-specific carcinogenic effects. In a 2-year rat bioassay, B[a]P caused liver hepatocellular carcinomas and with less incidence GI tract tumors after 104 weeks of daily gavage exposure with doses above 3 mg/kg/day (Wester et al., 2012). However, in B6C3F1 mice a similar 2-year bioassay did not find tumors in either of these 2 tissues, but showed a high incidence of papillomas and carcinomas of the forestomach, esophagus, and tongue (Culp et al., 1998). Importantly, Cyp1a1-null mice die after oral exposure to 125 mg/kg/day of B[a]P, due to the loss of PAH detoxification in the proximal GI tract tissues and liver. In these mice, B[a]P concentration in blood is increased relative to wild-type mice, reaching distal tissues, such as bone marrow and thymus, where CYP1B1 is a more efficient in PAH detoxification than CYP1A1, causing immunosuppression, toxic chemical depression of bone marrow, and finally death (Uno et al., 2004, 2006). If, as we have shown in Hepa-1 cells in vitro, CYP1A1 induction by B[a]P is inhibited by Cr(VI), we would expect that mice coexposed to both toxicants would die, similar to the Cyp1a1-null mice. However, our coexposed mice survive. In agreement with our results, at concentrations of SDD under 60 mg/l in drinking water, Cr(VI) does not affect CYP1A1 expression in the small intestine; however, at concentrations higher than 170 mg/l, Cr(VI) blocks CYP1A1 expression (Kopec et al., 2012). Our results represent tissue responses to environmentally relevant low Cr(VI) and B[a]P.
Our histological findings are similar to previous reports showing the induction of cytotoxic lesions in the villous and crypt hyperplasia in the small intestine of B6C3F1 mice exposed for 90 days to 60 mg/l of SDD in drinking water and higher (Thompson et al., 2011b). Similarly, a 2-year mouse exposure bioassay at the same Cr(VI) concentrations presented with cellular infiltration in the liver of these mice (National Toxicology Program, 2008). In our experiments, long-term exposure of mice to 5550 ppb of SDD did not cause cytotoxic lesions in the villous, but it did cause enterocyte hypertrophy and crypt hyperplasia in the small intestine. Importantly, coexposure to B[a]P induced an additive effect in crypt hyperplasia in the small intestine and increased significantly the number of Ki67-positive cells. In the liver, the histopathological lesions were more severe than with either compound alone, although the effects did not appear to be additive, suggesting that the effects of coexposure to these 2 toxicants are tissue-specific and more severe than the sum of the effects of either single compound.
Both Cr(VI) and B[a]P form DNA adducts that may lead to genotoxic damage by generation of DNA DSB (Shimada, 2006; Zhitkovich, 2005). DSB promote the phosphorylation of histone H2AX in Ser-139 (Lukas et al., 2011). Long-term exposure of B6C3F1 mice to Cr(VI) induces DSB in the villous but not in the crypt of the GI tract starting at 170 mg/l of SDD and higher concentrations (Thompson et al., 2013). At lower Cr(VI) concentrations in drinking water, we observed a phospho-γH2AX-positive cells increase in the PSI and liver, and not in the crypt and villous. Coexposure with B[a]P did not cause additive effects, although it increased the number of positive cells over the levels found in mice singly exposed to either compound.
In Hepa-1 cells, long-term treatment with low concentrations of Cr(VI) has a significant effect on gene expression regulation in the form of structural changes that open the chromatin domains surrounding the binding sites for various transcription factors (Fan et al., 2012; Ovesen et al., 2014b). In vivo, oral exposure to B[a]P and Cr(VI) trigger different gene expression patterns depending on the particular tissue studied. Of the drug metabolism genes, Cyp1a1, but not Cyp1b1, is the only gene induced in all 3 tissues. In liver, Cdkn1a/p21 is the sole other gene tested that was upregulated. Upregulation was also true in the PSI for some of the oxidative stress genes (Hmox1, Gclc, Gclm, Gstp1, and Gsta4, but not others, like Gclm, Gpx1, Gstm5, and Nrf2. As far as the tumor suppressor (Cdkn1a/p21, Cdkn1b/p27, Cdkn2a/p16, Cdkn2b/p15, Cdkn2c/p18, Cdkn2c/p19, Hras, and P73) and pro-inflammatory (Tnfα and Il6) genes they all showed down-regulation in both PSI and liver. In contrast, all the DSI genes tested were upregulated. Both B[a]P and Cr(VI) can induce oxidative stress (Kim and Lee, 1997;Yao et al., 2008), and activate the canonical NRF2-signaling pathway in the small intestine of mice exposed to significantly higher concentrations in drinking water (≥170 mg/l SDD) than used in this work (Kopec et al., 2012; Ovesen et al., 2014a). Our data support the conclusion that low-dose Cr(VI) does not cause oxidative stress, but contributes an additive effect to the upregulation of oxidative stress, tumor suppressor, drug metabolism, and inflammatory genes specifically induced by B[a]P in the distal region of the intestinal tract. It is likely that these tissue-specific effects are the consequence of differential toxicokinetics of the 2 toxicants, as was proposed for the incidence of small intestinal cancer in mice resulting from chronic exposure to high concentrations of Cr(VI) in drinking water (Kirman et al., 2013). A further hypothesis worth exploring is the possibility that differential microbiome characteristics in the small intestine contribute differently to the metabolism of either compound.
Our findings of sex- and tissue-specific differences in the response to combined exposures make it unlikely that these responses result from a single unifying mechanistic model. Indeed, formation of Cr-DNA and BPDE-DNA adducts and their competition for nucleotide excision repair (NER) may favor repair of the more numerous but less toxic small Cr-DNA adducts that are better NER substrates than the BPDE adducts (Reynolds et al., 2007). In case of coexposures, this preference might be expected to enhance B[a]P-induced responses due to elevated levels of BPDE-DNA damage. In addition, suppression of the B[a]P inducible gene expression response by chromium might in turn be impaired by the presence of Cr-DNA adducts. In this context, it would be significant if the sites of Cr-induced DNA damage were in the proximity of promoters of genes whose expression is suppressed by chromium, in which case, the inescapable conclusion would be that the ability of Cr(VI) to increase gene expression in some cases and decrease it in others has to be related to differential levels of chromium-induced double-strand DNA damage in different tissues and sexes and differential sensitivity of different genes to modulation of their expression by the combination of DNA damage and repression of gene expression. In conclusion, we find that long-term oral coexposure to environmental levels of Cr(VI) and B[a]P in mice induces tissue-specific differential effects in liver and GI tract that are more significant than the sum, or the subtraction, of the effects of either single compound. These effects appear also to be sex-specific, often with opposite effects in male and female tissues, with no apparent mechanism responsible for the difference. Identification of the complex mechanisms responsible for these sex- and tissue-specific effects is essential to understand and prevent the biological consequences of extended exposure to mixtures of these agents, as may happen in an occupational setting or in areas where drinking water contains elevated levels of Cr(VI).
SUPPLEMENTARY DATA
Supplementary data are available online at http://toxsci.oxfordjournals.org/.
FUNDING
NIH (R01ES006273, R01ES010807 and R21ES020048).
Supplementary Material
ACKNOWLEDGMENTS
We thank Chia-I Ko and Qin Wang for critically reading the manuscript and providing helpful criticisms. We are grateful to Dr. Mary Beth Genter (University of Cincinnati) for providing the anti-CYP1A1 antibody.
REFERENCES
- American Conference of Governmental Industrial Hygienists (ACGIH). (2003). TLVs® and BEIs. Threshold Limit Values for Chemical Substances and Physical Agents and Biological Exposure Indices. Cincinnati, Ohio. [Google Scholar]
- Birnbaum L. S., Devito M. J. (1995). Use of toxic equivalency factors for risk assessment for dioxins and related compounds. Toxicology 105, 391–401. [DOI] [PubMed] [Google Scholar]
- Cefalu W. T., Wang Z. Q., Zhang X. H., Baldor L. C., Russell J. C. (2002). Oral chromium picolinate improves carbohydrate and lipid metabolism and enhances skeletal muscle Glut-4 translocation in obese, hyperinsulinemic (JCR-LA corpulent) rats. J. Nutr. 132, 1107–1114. [DOI] [PubMed] [Google Scholar]
- Cizmas L., McDonald T. J., Phillips T. D., Gillespie A. M., Lingenfelter R. A., Kubena L. F., Phillips T. D., Donnelly K. C. (2004). Toxicity characterization of complex mixtures using biological and chemical analysis in preparation for assessment of mixture similarity. Environ. Sci. Technol. 38, 5127–5133. [DOI] [PubMed] [Google Scholar]
- Collins J. F., Brown J. P., Alexeeff G. V., Salmon A. G. (1998). Potency equivalency factors for some polycyclic aromatic hydrocarbons and polycyclic aromatic hydrocarbon derivatives. Regul. Toxicol. Pharmacol. 28, 45–54. [DOI] [PubMed] [Google Scholar]
- Conney A. H., Chang R. L., Jerina D. M., Wei S. J. (1994). Studies on the metabolism of benzo[a]pyrene and dose-dependent differences in the mutagenic profile of its ultimate carcinogenic metabolite. Drug Metab. Rev. 26, 125–163. [DOI] [PubMed] [Google Scholar]
- Costa M., Klein C. B. (2006). Toxicity and carcinogenicity of chromium compounds in humans. Crit. Rev. Toxicol. 36, 155–163. [DOI] [PubMed] [Google Scholar]
- Culp S. J., Gaylor D. W., Sheldon W. G., Goldstein L. S., Beland F. A. (1998). A comparison of the tumors induced by coal tar and benzo[a]pyrene in a 2-year bioassay. Carcinogenesis 19, 117–124. [DOI] [PubMed] [Google Scholar]
- Dayan A. D., Paine A. J. (2001). Mechanisms of chromium toxicity, carcinogenicity and allergenicity: review of the literature from 1985 to 2000. Hum. Exp. Toxicol. 20, 439–451. [DOI] [PubMed] [Google Scholar]
- Fan Y., Ovesen J. L., Puga A. (2012). Long-term exposure to hexavalent chromium inhibits expression of tumor suppressor genes in cultured cells and in mice. J. Trace Elem. Med. Biol. 26, 188–191. [DOI] [PMC free article] [PubMed] [Google Scholar]
- Kim K. B., Lee B. M. (1997). Oxidative stress to DNA, protein, and antioxidant enzymes (superoxide dismutase and catalase) in rats treated with benzo(a)pyrene. Cancer Lett. 113, 205–212. [DOI] [PubMed] [Google Scholar]
- Kirman C. R., Aylward L. L., Suh M., Harris M. A., Thompson C. M., Haws L. C., Proctor D. M., Lin S. S., Parker W., Hays S. M. (2013). Physiologically based pharmacokinetic model for humans orally exposed to chromium. Chem. Biol. Interact. 204, 13–27. [DOI] [PubMed] [Google Scholar]
- Kopec A. K., Kim S., Forgacs A. L., Zacharewski T. R., Proctor D. M., Harris M. A., Haws L. C., Thompson C. M. (2012). Genome-wide gene expression effects in B6C3F1 mouse intestinal epithelia following 7 and 90days of exposure to hexavalent chromium in drinking water. Toxicol. Appl. Pharmacol. 259, 13–26. [DOI] [PubMed] [Google Scholar]
- Labib S., Guo C. H., Williams A., Yauk C. L., White P. A., Halappanavar S. (2013). Toxicogenomic outcomes predictive of forestomach carcinogenesis following exposure to benzo(a)pyrene: relevance to human cancer risk. Toxicol. Appl. Pharmacol. 273, 269–280. [DOI] [PubMed] [Google Scholar]
- Lukas J., Lukas C., Bartek J. (2011). More than just a focus: The chromatin response to DNA damage and its role in genome integrity maintenance. Nat. Cell Biol. 13, 1161–1169. [DOI] [PubMed] [Google Scholar]
- National Toxicology Program (2008). NTP Toxicology and Carcinogenesis Studies of Sodium Dichromate Dihydrate (CAS No. 7789-12-0) in F344/N Rats and B6C3F1 Mice (Drinking Water Studies). Natl. Toxicol. Program. Tech. Rep. Ser ., 1–192. [PubMed] [Google Scholar]
- Nebert D. W., Dalton T. P., Okey A. B., Gonzalez F. J. (2004). Role of aryl hydrocarbon receptor-mediated induction of the CYP1 enzymes in environmental toxicity and cancer. J. Biol. Chem. 279, 23847–23850. [DOI] [PubMed] [Google Scholar]
- Ovesen J. L., Fan Y., Chen J., Medvedovic M., Xia Y., Puga A. (2014a). Long-term exposure to low-concentrations of Cr(VI) induce DNA damage and disrupt the transcriptional response to benzo[a]pyrene. Toxicology 316, 14–24. [DOI] [PMC free article] [PubMed] [Google Scholar]
- Ovesen J. L., Fan Y., Zhang X., Chen J., Medvedovic M., Xia Y., Puga A. (2014b). Formaldehyde-Assisted Isolation of Regulatory Elements (FAIRE) analysis uncovers broad changes in chromatin structure resulting from hexavalent chromium exposure. PLoS One. 9, e97849. [DOI] [PMC free article] [PubMed] [Google Scholar]
- Penning T. M., Burczynski M. E., Hung C. F., McCoull K. D., Palackal N. T., Tsuruda L. S. (1999). Dihydrodiol dehydrogenases and polycyclic aromatic hydrocarbon activation: generation of reactive and redox active o-quinones. Chem. Res. Toxicol. 12, 1–18. [DOI] [PubMed] [Google Scholar]
- Puga A., Ma C., Marlowe J. L. (2009). The aryl hydrocarbon receptor cross-talks with multiple signal transduction pathways. Biochem. Pharmacol. 77, 713–722. [DOI] [PMC free article] [PubMed] [Google Scholar]
- Reynolds M., Stoddard L., Bespalov I., Zhitkovich A. (2007). Ascorbate acts as a highly potent inducer of chromate mutagenesis and clastogenesis: linkage to DNA breaks in G2 phase by mismatch repair. Nucleic Acids Res. 35, 465–476. [DOI] [PMC free article] [PubMed] [Google Scholar]
- Rubin H. (2001). Synergistic mechanisms in carcinogenesis by polycyclic aromatic hydrocarbons and by tobacco smoke: a bio-historical perspective with updates. Carcinogenesis 22, 1903–1930. [DOI] [PubMed] [Google Scholar]
- Saha R., Nandi R., Saha B. (2011). Sources and toxicity of hexavalent chromium. J. Coord. Chem. 64, 1782–1806. [Google Scholar]
- Schnekenburger M., Talaska G., Puga A. (2007). Chromium cross-links histone deacetylase 1-DNA methyltransferase 1 complexes to chromatin, inhibiting histone-remodeling marks critical for transcriptional activation. Mol. Cell Biol. 27, 7089–7101. [DOI] [PMC free article] [PubMed] [Google Scholar]
- Shimada T. (2006). Xenobiotic-metabolizing enzymes involved in activation and detoxification of carcinogenic polycyclic aromatic hydrocarbons. Drug Metab. Pharmacokinet. 21, 257–276. [DOI] [PubMed] [Google Scholar]
- Thompson C. M., Haws L. C., Harris M. A., Gatto N. M., Proctor D. M. (2011a). Application of the U.S. EPA mode of action Framework for purposes of guiding future research: a case study involving the oral carcinogenicity of hexavalent chromium. Toxicol. Sci. 119, 20–40. [DOI] [PMC free article] [PubMed] [Google Scholar]
- Thompson C. M., Proctor D. M., Haws L. C., Hebert C. D., Grimes S. D., Shertzer H. G., Kopec A. K., Hixon J. G., Zacharewski T. R., Harris M. A. (2011b). Investigation of the mode of action underlying the tumorigenic response induced in B6C3F1 mice exposed orally to hexavalent chromium. Toxicol. Sci. 123, 58–70. [DOI] [PMC free article] [PubMed] [Google Scholar]
- Thompson C. M., Proctor D. M., Suh M., Haws L. C., Hebert C. D., Mann J. F., Shertzer H. G., Hixon J. G., Harris M. A. (2012). Comparison of the effects of hexavalent chromium in the alimentary canal of F344 rats and B6C3F1 mice following exposure in drinking water: implications for carcinogenic modes of action. Toxicol. Sci. 125, 79–90. [DOI] [PMC free article] [PubMed] [Google Scholar]
- Thompson C. M., Proctor D. M., Suh M., Haws L. C., Kirman C. R., Harris M. A. (2013). Assessment of the mode of action underlying development of rodent small intestinal tumors following oral exposure to hexavalent chromium and relevance to humans. Crit Rev. Toxicol. 43, 244–274. [DOI] [PMC free article] [PubMed] [Google Scholar]
- Uno S., Dalton T. P., Derkenne S., Curran C. P., Miller M. L., Shertzer H. G., Nebert D. W. (2004). Oral exposure to benzo[a]pyrene in the mouse: detoxication by inducible cytochrome P450 is more important than metabolic activation. Mol. Pharmacol. 65, 1225–1237. [DOI] [PubMed] [Google Scholar]
- Uno S., Dalton T. P., Dragin N., Curran C. P., Derkenne S., Miller M. L., Shertzer H. G., Gonzalez F. J., Nebert D. W. (2006). Oral benzo[a]pyrene in Cyp1 knockout mouse lines: CYP1A1 important in detoxication, CYP1B1 metabolism required for immune damage independent of total-body burden and clearance rate. Mol. Pharmacol. 69, 1103–1114. [DOI] [PubMed] [Google Scholar]
- Wang Q., Chen J., Ko C. I., Fan Y., Carreira V., Chen Y., Xia Y., Medvedovic M., Puga A. (2013). Disruption of aryl hydrocarbon receptor homeostatic levels during embryonic stem cell differentiation alters expression of homeobox transcription factors that control cardiomyogenesis. Environ. Health Perspect. 121, 1334–1343. [DOI] [PMC free article] [PubMed] [Google Scholar]
- Wei Y. D., Tepperman K., Huang M. Y., Sartor M. A., Puga A. (2004). Chromium inhibits transcription from polycyclic aromatic hydrocarbon-inducible promoters by blocking the release of histone deacetylase and preventing the binding of p300 to chromatin. J. Biol. Chem. 279, 4110–4119. [DOI] [PubMed] [Google Scholar]
- Wester P. W., Muller J. J., Slob W., Mohn G. R., Dortant P. M., Kroese E. D. (2012). Carcinogenic activity of benzo[a]pyrene in a 2 year oral study in Wistar rats. Food Chem. Toxicol. 50, 927–935. [DOI] [PubMed] [Google Scholar]
- Xu J., Manning F. C., Patierno S. R. (1994). Preferential formation and repair of chromium-induced DNA adducts and DNA–protein crosslinks in nuclear matrix DNA. Carcinogenesis 15, 1443–1450. [DOI] [PubMed] [Google Scholar]
- Yao H., Guo L., Jiang B.H., Luo J., Shi X. (2008) Oxidative stress and chromium(VI) carcinogenesis. J. Environ. Pathol. Toxicol. Oncol . 27, 77–88 [DOI] [PubMed] [Google Scholar]
- Zhitkovich A. (2005). Importance of chromium-DNA adducts in mutagenicity and toxicity of chromium(VI). Chem. Res. Toxicol. 18, 3–11. [DOI] [PubMed] [Google Scholar]
- Zhitkovich A. (2011). Chromium in drinking water: sources, metabolism, and cancer risks. Chem. Res. Toxicol. 24, 1617–1629. [DOI] [PMC free article] [PubMed] [Google Scholar]
Associated Data
This section collects any data citations, data availability statements, or supplementary materials included in this article.