Abstract
Electrical activity is abundant in early retinal development, and electrical stimulation has been shown to modulate embryonic stem cell differentiation towards a neuronal fate. The goal of this study was to simulate in vitro retinal developmental electrical activity to drive changes in mouse retinal progenitor cell (mRPC) gene expression and morphology. We designed a biomimetic electrical stimulation protocol based on spontaneous waves present during retinal development, and applied it to retinal progenitor cells (RPCs) over 3 days of culture. Analysis of protein localization and calcium dynamics, indicate that mRPCs undergo functional neuronal maturation. Our findings suggest that this type of electrical stimulation may be utilized for application in neural tissue engineering and open possibilities for understanding mechanisms guiding active electric membrane development and functional organization during early retinogenesis.
I. INTRODUCTION
Endogenous electrical activity is abundant in early neuronal development; it refines synapses and contributes towards neuronal differentiation of progenitor cells. Exogenously applied electrical stimulation has been shown to modulate fate determination of differentiating embryonic stem cells [1]. Endogenous electrical activity in developing neuronal circuits comes in two forms: 1) Spontaneous electrical activity, which does not require a stimulus or even a sensory input for initiation, and 2) Experience-driven activity, which is dependent on sensory input [2–3], both of which are implicated in regulating the development of neuronal circuits [3]. The period beginning near E (embryonic day) 17 and lasting to P (post-natal day) 30 in mice is particularly interesting in the developing mouse retina because, during this time, bursts of spontaneous electrical activity coincide with neuronal maturation and synaptic refinement. Recorded bursts followed a pattern of 2–3 seconds in duration at a frequency of about once a minute [4]. During the early period of this activity, bursts are initiated by amacrine cells (P0-P15) and are transmitted cholingerically, while later in development (P15-P21) they are initiated via bipolar cells and follow GABAergic transmission to ganglion cells which further carry them into the dorsal lateral geniculate nucleus [5]. The waves of electrical activity spread in all directions (except in nonrefractory regions) [6]. The observed progression of initiation sites combined with radial propagation suggests that spontaneous electrical activity might play a role in refinement of retinal projections [7–11].
We hypothesized that exogenously applied electrical stimulation that mimics the spontaneous electrical activity in the developing retina will guide mouse retinal progenitor cells (mRPCs) towards a retinal neuronal cell fate. Using a biomimetic stimulation regime based upon measured patterns (3 second bursts, 1 per minute), we stimulated neurospheres composed of mRPCs in a bioreactor for 3 days. Electrical stimulation directed RPCs towards functional excitability and neuronal expression.
II. METHODS
A. Neurosphere preparation
Cell isolations were performed according to the City University of New York, Lehman College, Institute Animal Care and Use Committee and the ARVO Statement for the Use of Animals in Ophthalmic and Vision Research. Isolation of mRPCs was performed as previously described [12]. P1 retinas were isolated from green fluorescent protein positive (GFP+) transgenic mice (C57BL/6 background), pooled and digested using 0.1% type 1 collagenase (Sigma- Aldrich, St. Louis, MO) for 20 min. Dissociated mRPCs were passed through a 100 μm mesh filter, centrifuged at 850 rpm for 3 min, re-suspended in Neurobasal culture medium (NB; Invitrogen) containing 2 mM L-glutamine, 100 mg/ml penicillin-streptomycin, 20 ng/ml epidermal growth factor (EGF; Promega, Madison, Wisconsin) and neural supplement (B27; Invitrogen), and plated into culture wells (Multiwell; Becton Dickinson). Medium was changed every other day for 3–4 weeks until mRPCs were visible as expanding non-adherent spheres. mRPCs were passaged 1:3 every 7 days, and formed into neurospheres by plating 12,000 cells per well in 200 ul of complete NB media in Lipidure® coated 96-well plates (GEL Company) for 7 days, until spheroid bodies formed in solution, due to the plates’ polymer coating that resists surface binding by cells and proteins. 48 hours prior to electrical stimulation, neurospheres were changed to fresh NB media without EGF.
B. Electrical stimulation of neurospheres
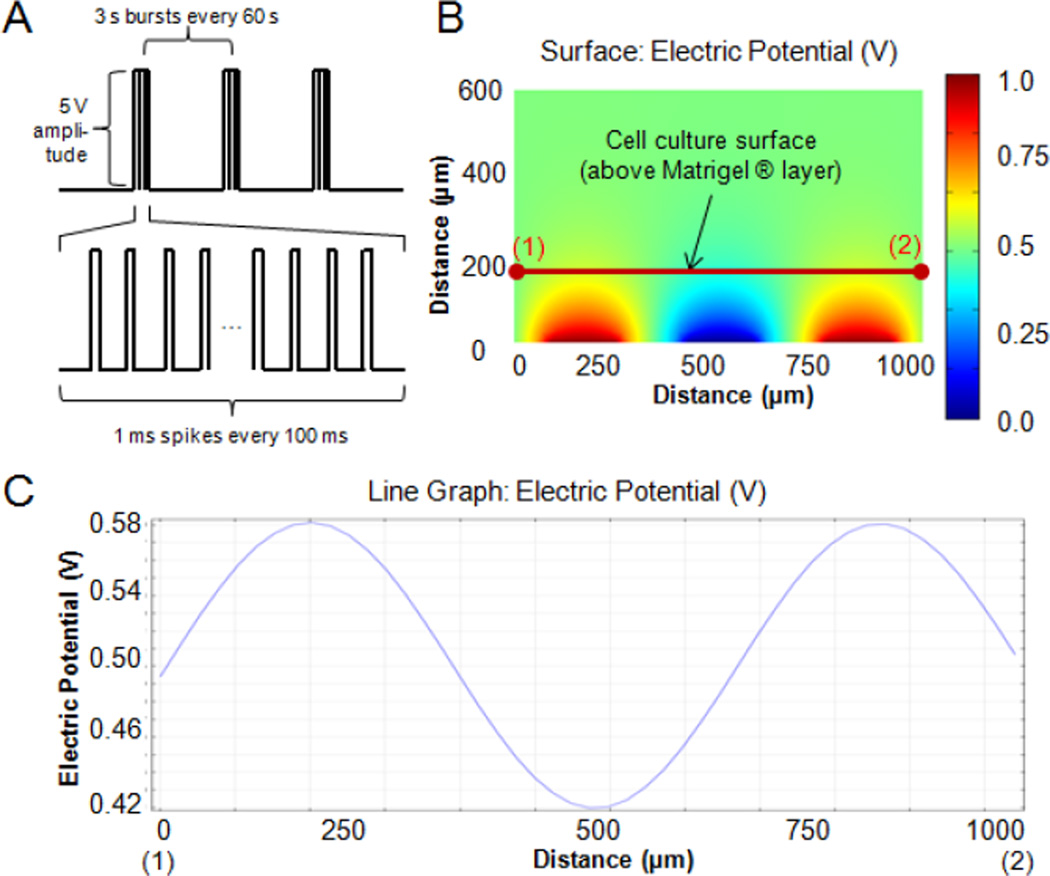
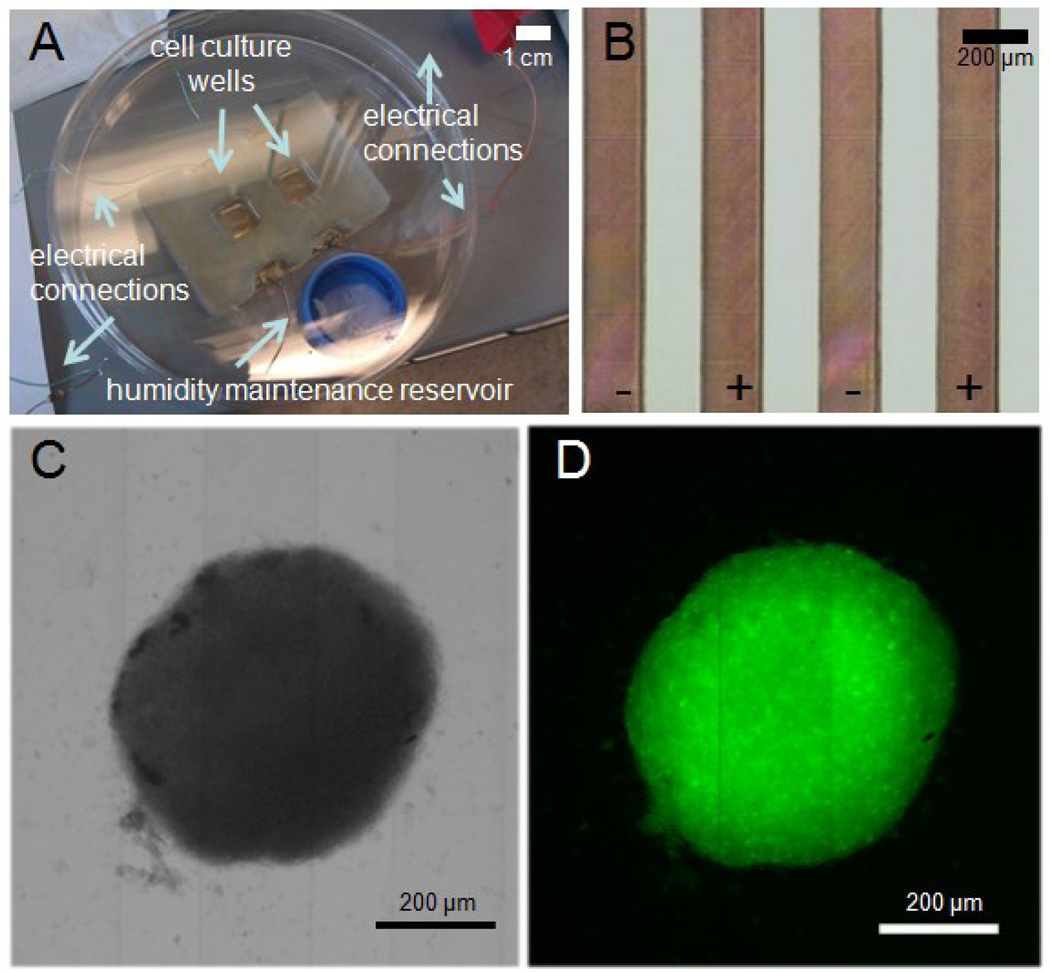
The regime of electrical stimulation was designed to mimic the spontaneous activity of the developing retina [4]: 5 V monophasic, square-wave pulses were delivered for 1 ms duration for 100 ms, the first 3 s every minute (Figure 2A). This regime was programmed into a custom-built stimulation device consisting of a microprocessor (Arduino® UNO) running custom software and performing stimulation via its digital output pins. Neurospheres were stimulated in a custom-built microscale cell culture system outfitted with an interdigitated microarray of excimer-laser-ablated indium tin oxide (ITO) electrodes as in our previous studies [13] (Figure 1). Neurospheres (5 per well) were placed via pipette on a base of 40uL 50% Matrigel (BD Biosciences), in 50% NB Medium, allowed to attach for 15 min, and 2 mL NB medium was added to wells. Neurospheres in electrically stimulated groups were exposed to the pulsatile electric field for 3 days, and non-stimulated neurospheres in identical bioreactor configuration were used as controls.
Figure 2.
(A) Schematic representation of the electrical stimulation regime delivered to RPCs via bioreactor (5 V monophasic, square-wave pulses, 1 ms duration per 100 ms, 3 s per minute followed by 57 s pause). (B-C) Modeling of electrical field in bioreactor during electrical pulse. (B) a cross-section heatmap of the electric field between three electrodes (two negative electrodes in blue and one positive electrode in red) with a 1 V applied stimulus. Points (1) and (2) correspond to the points directly above the centers between the positive and negative electrodes, respectively, on the cell culture surface, which is 200 μm above the ITO-patterned glass due to the coating of the cell culture surface prior to placement of neurospheres. (C) line graph of electric potential between points (1) and (2) in part (B).
Figure 1.
(A) Bioreactor setup incorporating two culture wells with interdigitated indium tin oxide (ITO) electrodes patterned onto the bottom glass surface, a humidity reservoir and electrical connections within a sterile Petri dish (B) Closeup of the interdigitated electrodes composed of laser-ablated ITO coated glass slides (C) Bright field image and (D) Fluorescent image of a GFP+ neurosphere in bioreactor; electrodes may be seen as faint vertical lines in the images.
C. Modeling of electrical field in bioreactor
To model the electrical field experienced by the cells at the bioreactor surface, Maxwell’s equations were solved under electroquasistatic conditions [14–15] with commercially available software (Multiphysics, Comsol, electric currents module). Measured conductivities (at 26 °C with Thermo Scientific Orion Probe) of 8.98 mS/cm and 5.61 mS/cm were used, and relative permitivities of 71 and 68 were calculated from published values [16] (for cell culture media and the 50% Matrigel®/50% culture media hydrogel layer, respectively). Electrodes were assumed to be of infinitesimal height relative to the laser-ablated surface, and that the bottom glass surface provides an electrically insulating boundary condition. Pre-defined “extremely fine” triangular mesh elements of 0.148 -74 μm were used.
D. Immunocytochemistry and image analysis
Neurospheres were fixed for 15 min in 1% paraformaldehyde, blocked and permeabilized for 2 hours by incubation with 0.1% Triton X-100 (Sigma), and 5% normal goat serum (Sigma), incubated overnight at 4 °C with primary antibodies, N-Cadherin (Sigma 10μg/ml), CDC42 (Santa Cruz 1:200), and ßIII-Tubulin (Abcam, 1μg/ml), then fluorescence conjugated secondary antibody (Jackson ImmunoResearch 1:100) for 1 hour at room temperature, and then stained with DAPI mounting medium (VectaShield, Vector Labs) before imaging on confocal microscope (Leica TSC-SP2), at 40X magnification. Semi-quantitative analysis of protein expression levels was performed using ImageJ Software (NIH) to evaluate average fluorescence intensity of labeled proteins in areas of uniform density of cells.
E. RNA expression
cDNA sequences were obtained from the National Center for Biotechnology Information and custom primers based on these sequences were synthesized using the OligoPerfect™ Designer (Invitrogen). Each sample was comprised from 5 pooled neurospheres. Total RNA was obtained from stimulated and control neurospheres (Omega). Total RNA preparations were treated with ProtoScript® AMV First Strand cDNA Synthesis Kit to generate cDNA using 250ng total RNA according to the manufacturer’s protocols. PCR products were resolved on 1% agarose gel. Band intensity was quantified by image analysis using ImageJ Software (NIH). Statistical significance was determined via the Wilcoxon-Mann-Whitney U-test calculator (available at http://nsdl.org/; p<0.05 was considered significant).
F. Calcium imaging
Intracellular calcium dynamics were compared for control and stimulated neurospheres using the Fura-2 calcium indicator. Whole neurospheres were transferred to 35 mm glass Petri dishes (MatTek, Ashland, MA), allowed to adhere in NB medium at 37 °C, and rinsed with Ringer’s solution maintained at 37°C containing (in mM): NaCl 119, KCl 4.16, CaCl 2.5, MgCl 0.3, MgSO 0.4, Na2HPO4 0.5, NaH2PO4 0.45, HEPES 20, Glucose 19 at pH 7.4. Cells were then incubated in Ringer’s solution containing 0.5 mm fura-2 tetra-acetoxymethyl ester (Fura-2) (Molecular Probes), 10% pluronic F127 (Sigma), and 250 mM sulfinpyrazone (Sigma) for 40 min at 22 °C. Fura-2 was excited by alternating 340 and 380 nm wavelength light with the use of a filter changer, under the control of NES Elements software (Nikon) paired to a Nikon Eclipse Ti Microscope and imaged with a Photometrics, Coolsnap HQ2 camera. A ratiometric readout corresponding to fluorescence intensities at 340 and 380 nm wavelengths, respectively, was obtained every 0.5 (s). Background intensity was zero.
III RESULTS/DISCUSSION
A. Modeling of electrical field in bioreactor
The finite-element modeling predicts an electric potential profile that is similar to our previous studies [13], with the electric field nearly constant between the electrodes at the bottom surface of the bioreactor (Figure 2B). Because neurospheres are cultured on a layer of Matrigel® 200 μm above the bottom surface of the bioreactor, the electric field experienced by an electrically-stimulated neurosphere (which spans several pairs of electrodes) is more sinusoidal in pattern (see Figure 2C, corresponding to points (1) and (2) in Figure 2B), and more attenuated than if the cells had been cultured on the bottom surface of the bioreactor. From Figure 2(C), we see that the voltage between adjacent electrodes oscillates from ~0.58 to 0.42 of the applied electrical potential, resulting in the cells sensing ~16% of the maximum electric field applied. We have therefore compensated for attenuation by increasing the applied voltage. In this case, from previous studies of this electrode configuration, the ratio of the voltage delivered to the cells versus the applied voltage is 0.41 [13], which multiplied by this attenuation factor of 16% results in an applied electrical field stimulus of 8.2 V/cm, which falls within the physiological range of 0.1–10 V/cm [17].
B. Expression and presence of neural proteins and genes
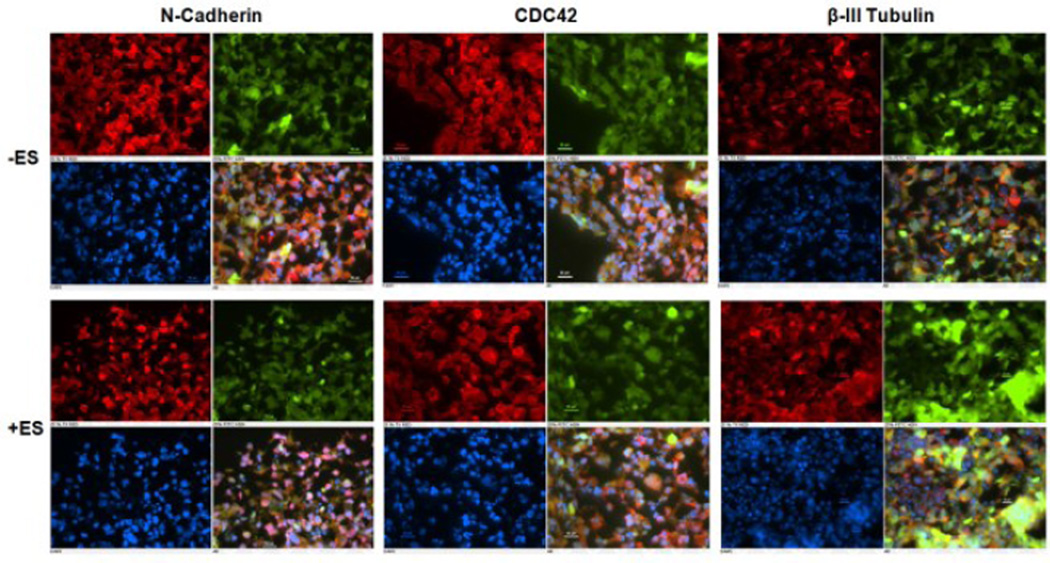
Figure 3 shows representative immunostaining of neurospheres imaged after 3 days in bioreactor conditions (stimulated and controls). Inspection of fluorescence intensity suggests that electrically stimulated mRPCs expressed lower levels of the retinal glial and cell adhesion marker, N-cadherin [18], comparable levels of the photoreceptor, dendritic and spine activation marker Cdc42 [19] , and higher levels of the neuronal microtubule element ßIII-tubulin [20],as compared to non-stimulated controls. An observed decrease of N-Cadherin within stimulated RPCs may indicate increasing neural differentiation away from a glial phenotype, while a trend of increased ßIII-tubulin may suggest activity dependent dendritic morphogeneis toward early functional morphology. Quantification of ICC labeled RPC fluorescence intensity provided results consistent with gene expression analysis via qPCR (Figure 4; the observed trends were not significantly different for qPCR). Electrical stimulation enhanced ßIII-tubulin, a protein evident throughout retinal neurons [21], on both the protein level (Figure 3) and gene level (Figure 4). Worth noting is that no significant differences were observed in either size or GFP intensity between stimulated neurospheres and controls, before and after stimulation. Both groups were observed to increase their diameters by ~15% over 3 days of cultivation (data not shown).
Figure 3.
Representative immunoflourescent images of relevant retinal proteins for control (−ES) and stimulated (+ES) samples. Images for NCadherin, CDC42, and ßIII-Tubulin are in the upper-left-hand position of each boxed set, GFP images are in the upper-right, DAPI nuclear stained images are in the lower-left, and composite images are in the lower-right, respectively. Scale bars correspond to 20 μm
Figure 4.
ß-III Tubulin gene and protein analysis (A) normalized RNA expression, and (B) normalized protein expression levels for electrically stimulated and control samples. (C) Representative Northern Blot used for generating part (A)
C. Calcium signalling
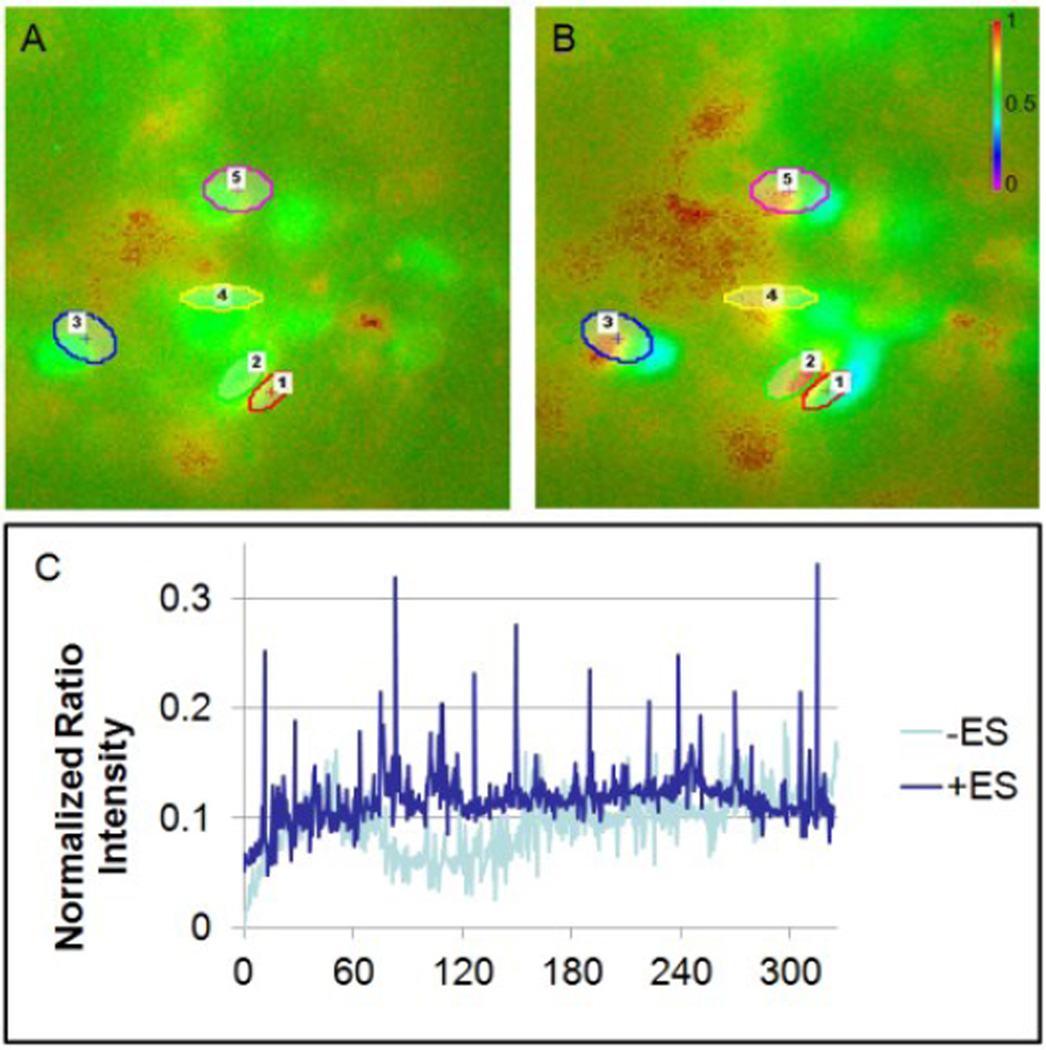
Figure 5 A–B shows repeated depolarization events in stimulated neurospheres. Figure 5C shows 5 min of continuous normalized intensity for one neurosphere that was stimulated during culture, and one non-stimulated control neurosphere. Spontaneous spikes occurring at varying time intervals (average time of around 32 seconds) were observed to occur in samples that had been stimulated during culture (none were observed in the control group). The action potentials observed in stimulated RPCs may be compared to the spontaneous depolarizations directing neuronal signaling refinement in developing retina. Similarly, oscillating calcium influxes observed in our stimulated RPCs are likely correlated to activity dependent neuronal gene expression, including ßIII-tubulin [22]. This initial evidence of increased electrical activity in response to electrical stimulation may be promising for directed differentiation of electrically excitable cells, it is important to note that the observed spike frequency does not directly correspond to the frequency of stimulation. Given that only spontaneous changes in calcium flux were observed, an interesting area of future work will be to analyze in depth neurospheres during a stimulus.
Figure 5.
Representative calcium dynamics for neurospheres that were electrically stimulated after 3 days of culture (A) before and (B) during a spontaneously observed depolarization with the regions of interest (outlined). (C) Normalized ratio intensity for a stimulated and a control neurosphere, for a period of 5 minutes.
D. Future Work
Based on the initial results from this study, biomimetic electrical stimulation appears to be a promising method for influencing cellular fate of retinal progenitor cells. Further studies will be required to confirm the upregulation of ß-III tubulin, and better understand the effects of electrical stimulation on other relevant retinal markers. Furthermore, ITO electrodes chosen in this study exhibit excellent electrical conductivity, optical transparency and can be micro-patterned with high precision. These abilities form the basis for spatial control of electrical signals acting on cultured cells. For example, the spatial pattern of electrical stimulation could be varied to study the effects of swirling patterns, and areas of refractoriness on retinal differentiation. If, however, a constant field stimulus is desired, another electrode configuration that applies an electric field in a configuration more amenable to 3-dimensional culture could be used, with electrodes placed on the side walls of the bioreactor [23]. Along these lines, studies with other electrical stimulation regimes based on observed waves (e.g. 30 Hz) [4], longer-term experiments, and measurements of calcium dynamics during stimulation, in addition to spontaneous activity, could help elucidate the effects of electrical stimulation. Finally, investigating these regimes with neural progenitors derived from ES and iPS cells will be key towards applying these results in a tissue-engineering context.
ACKNOWLEDGMENT
The authors thank Laetitia Saccenti, and Anastasia Felker for cell culture help. This work was funded by NIH (grants EB015888 and EB002520 to GVN, and GM096935 to SR).
REFERENCES
- 1.Yamada M, et al. Electrical stimulation modulates fate determination of differentiating embryonic stem cells. Stem Cells. 2007 Mar;25:562–570. doi: 10.1634/stemcells.2006-0011. [DOI] [PubMed] [Google Scholar]
- 2.Moody WJ. Control of spontaneous activity during development. J Neurobiol. 1998 Oct;37:97–109. doi: 10.1002/(sici)1097-4695(199810)37:1<97::aid-neu8>3.0.co;2-3. [DOI] [PubMed] [Google Scholar]
- 3.Zhang LI, Poo MM. Electrical activity and development of neural circuits. Nat Neurosci. 2001 Nov;4(Suppl):1207–1214. doi: 10.1038/nn753. [DOI] [PubMed] [Google Scholar]
- 4.Wong RO, et al. Transient period of correlated bursting activity during development of the mammalian retina. Neuron. 1993 Nov;11:923–938. doi: 10.1016/0896-6273(93)90122-8. [DOI] [PubMed] [Google Scholar]
- 5.Mooney R, et al. Thalamic relay of spontaneous retinal activity prior to vision. Neuron. 1996 Nov;17:863–874. doi: 10.1016/s0896-6273(00)80218-4. [DOI] [PubMed] [Google Scholar]
- 6.Feller MB, et al. Requirement for cholinergic synaptic transmission in the propagation of spontaneous retinal waves. Science. 1996 May 24;272:1182–1187. doi: 10.1126/science.272.5265.1182. [DOI] [PubMed] [Google Scholar]
- 7.Wong RO, Oakley DM. Changing patterns of spontaneous bursting activity of on and off retinal ganglion cells during development. Neuron. 1996 Jun;16:1087–1095. doi: 10.1016/s0896-6273(00)80135-x. [DOI] [PubMed] [Google Scholar]
- 8.Wong RO. Patterns of correlated spontaneous bursting activity in the developing mammalian retina. Semin Cell Dev Biol. 1997 Feb;8:5–12. doi: 10.1006/scdb.1996.0115. [DOI] [PubMed] [Google Scholar]
- 9.Torborg CL, Feller MB. Spontaneous patterned retinal activity and the refinement of retinal projections. Prog Neurobiol. 2005 Jul;76:213–235. doi: 10.1016/j.pneurobio.2005.09.002. [DOI] [PubMed] [Google Scholar]
- 10.Shatz CJ. Viktor Hamburger Award review. Role for spontaneous neural activity in the patterning of connections between retina and LGN during visual system development. Int J Dev Neurosci. 1994 Oct;12:531–546. doi: 10.1016/0736-5748(94)90061-2. [DOI] [PubMed] [Google Scholar]
- 11.Cang J, et al. Development of precise maps in visual cortex requires patterned spontaneous activity in the retina. Neuron. 2005 Dec 8;48:797–809. doi: 10.1016/j.neuron.2005.09.015. [DOI] [PMC free article] [PubMed] [Google Scholar]
- 12.Redenti S, et al. Retinal tissue engineering using mouse retinal progenitor cells and a novel biodegradable, thin-film poly(ecaprolactone) nanowire scaffold. J Ocul Biol Dis Infor. 2008 Mar;1:19–29. doi: 10.1007/s12177-008-9005-3. [DOI] [PMC free article] [PubMed] [Google Scholar]
- 13.Tandon N, et al. Surface-patterned electrode bioreactor for electrical stimulation. Lab Chip. 2010 Mar 21;10:692–700. doi: 10.1039/b917743d. [DOI] [PMC free article] [PubMed] [Google Scholar]
- 14.Voldman J. Electrical forces for microscale cell manipulation. Annu Rev Biomed Eng. 2006;8:425–454. doi: 10.1146/annurev.bioeng.8.061505.095739. [DOI] [PubMed] [Google Scholar]
- 15.Ashkenasi D, et al. Fundamentals and advantages of ultrafast micro-structuring of transparent materials. Applied Physics A: Materials Science & Processing. 2003;77:223–228. [Google Scholar]
- 16.Yoon G. Dielectric Properties of Body Fluids with Various Hematocrit Levels. World Academy of Science, Engineering and Technology. 2011;60 [Google Scholar]
- 17.Song B, et al. Application of direct current electric fields to cells and tissues in vitro and modulation of wound electric field in vivo. Nat Protoc. 2007;2:1479–1489. doi: 10.1038/nprot.2007.205. [DOI] [PubMed] [Google Scholar]
- 18.Marga F, et al. Developmental biology and tissue engineering. Birth Defects Res C Embryo Today. 2007 Dec;81:320–328. doi: 10.1002/bdrc.20109. [DOI] [PubMed] [Google Scholar]
- 19.Scott EK, et al. Small GTPase Cdc42 is required for multiple aspects of dendritic morphogenesis. J Neurosci. 2003 Apr 15;23:3118–3123. doi: 10.1523/JNEUROSCI.23-08-03118.2003. [DOI] [PMC free article] [PubMed] [Google Scholar]
- 20.Craddock TJA, et al. Cytoskeletal Signaling: Is Memory Encoded in Microtubule Lattices by CaMKII Phosphorylation? PLoS Comput Biol. 2012;8:e1002421. doi: 10.1371/journal.pcbi.1002421. [DOI] [PMC free article] [PubMed] [Google Scholar]
- 21.Woodford BJ, Blanks JC. Localization of actin and tubulin in developing and adult mammalian photoreceptors. Cell Tissue Res. 1989 Jun;256:495–505. doi: 10.1007/BF00225597. [DOI] [PubMed] [Google Scholar]
- 22.Chen Y, Ghosh A. Regulation of dendritic development by neuronal activity. J Neurobiol. 2005 Jul;64:4–10. doi: 10.1002/neu.20150. [DOI] [PubMed] [Google Scholar]
- 23.Serena E, et al. Electrical stimulation of human embryonic stem cells: cardiac differentiation and the generation of reactive oxygen species. Exp Cell Res. 2009 Dec 10;315:3611–3619. doi: 10.1016/j.yexcr.2009.08.015. [DOI] [PMC free article] [PubMed] [Google Scholar]


