

The ongoing measles outbreak linked to the Disneyland Resort in Anaheim, California, shines a glaring spotlight on our nation's growing antivaccination movement and the prevalence of vaccination-hesitant parents. Although the index case has not yet been identified, the outbreak likely started sometime between December 17 and 20, 2014.1,2 Rapid growth of cases across the United States indicates that a substantial percentage of the exposed population may be susceptible to infection due to lack of, or incomplete, vaccination. Herein, we attempt to analyze existing, publicly available outbreak data to assess the potential role of suboptimal vaccination coverage in the population.
Methods
Without vaccination, measles is a highly contagious disease; estimates of the basic reproductive number (R0) from the prevaccination era range from 11 to 18.3 R0 is the mean number of secondary infections per infectious agent that occurs during the course of the entire infectious period in a population that is 100% susceptible at time 0.3 However, when a portion of the population is immune to a given disease, effective reproductive number (RE) is observed instead of R0.3 When historical values of R0 are available and RE can be approximated, the rate of immunity in the exposed population can be estimated.3 Furthermore, in situations where immunity is primarily conferred via vaccination, rate of immunity (I) and rate of vaccination effectiveness (VE) can be used to estimate rate of vaccination (V) in the exposed population as follows:
To estimate the vaccination rate in the context of the 2015 measles outbreak, cumulative incidence data were obtained via the California Department of Public Health and Health-Map media alerts.2,4 We used the incidence decay and exponential adjustment (IDEA) method to approximate the effective reproductive number (RE).5 Historically, the serial interval (SI) associated with measles is 10 to 14 days; thus, this range was used to parameterize the model.6
Results
Using nonlinear optimization, RE was solved for SI= 10, 12, and 14 days at 3.2, 4.1, and 5.8, respectively. Measles, mumps, and rubella (MMR) vaccination rates among the exposed population were then estimated using RE = 3.2, 4.1, and 5.8; prevaccination era values of R0; and a vaccination effectiveness (VE) of 95%.3 Over the range of R0 = [11, 18], the estimated vaccination rates vary from 75% to 86% when RE = 3.2, from 66% to 81% when RE = 4.1, and from 50% to 71% when RE = 5.8 (Figure).
Figure.
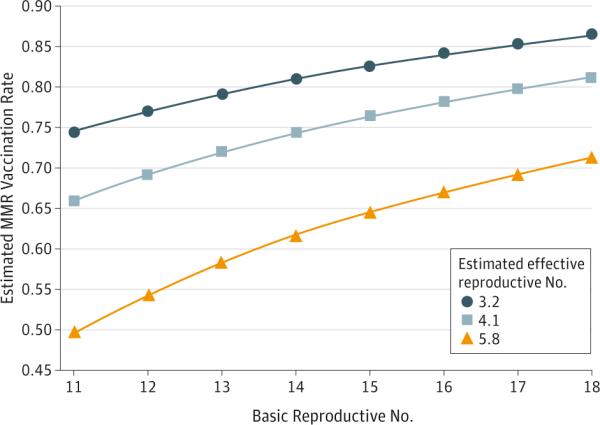
Estimated Measles, Mumps, and Rubella (MMR) Vaccination Rates Among the Exposed Population Associated With the 2015 Measles Outbreak
Vaccination rates were estimated using 3 approximated values for effective reproductive number (3.2, 4.1, and 5.8) and 8 well-established values for basic reproductive number (11-18). A vaccination effectiveness of 95% was used for all scenarios.
Discussion
This preliminary analysis indicates that substandard vaccination compliance is likely to blame for the 2015 measles outbreak. Our study estimates that MMR vaccination rates among the exposed population in which secondary cases have occurred might be as low as 50% and likely no higher than 86%. Given the highly contagious nature of measles, vaccination rates of 96% to 99% are necessary to preserve herd immunity and prevent future outbreaks.3 Even the highest estimated vaccination rates from our model fall well below this threshold. While data on MMR vaccination rates are available, coverage is often calculated at the state or county level and may not be granular enough to assess risk in an outbreak situation; this is especially the case for outbreaks originating at a tourist destination, where vaccination coverage among visitors is highly heterogeneous. Clearly, MMR vaccination rates in many of the communities that have been affected by this outbreak fall below the necessary threshold to sustain herd immunity, thus placing the greater population at risk as well.
Acknowledgments
Funding/Support: This work was supported by grant R01LM010812 from the National Library of Medicine.
Role of the Funder/Sponsor: The funder had no role in the design and conduct of the study; collection, management, analysis, and interpretation of the data; preparation, review, or approval of the manuscript; and decision to submit the manuscript for publication.
Footnotes
Author Contributions: Mss Majumder and Cohn had full access to all of the data in the study and take responsibility for the integrity of the data and the accuracy of the data analysis.
Study concept and design: Majumder, Cohn, Mekaru, Brownstein. Acquisition, analysis, or interpretation of data: All authors.
Drafting of the manuscript: All authors.
Critical revision of the manuscript for important intellectual content: All authors. Statistical analysis: Majumder.
Obtained funding: Brownstein.
Administrative, technical, or material support: Cohn, Mekaru, Huston.
Study supervision: Brownstein.
Conflict of Interest Disclosures: None reported.
References
- 1.Centers for Disease Control and Prevention [January 28, 2015];US multi-state measles outbreak, December 2014–January 2015. http://emergency.cdc.gov/HAN/han00376.asp.
- 2.California Department of Public Health [January 28, 2015];Measles. http://www.cdph.ca.gov/HealthInfo/discond/Pages/Measles.aspx.
- 3.Plans-Rubió P. Evaluation of the establishment of herd immunity in the population by means of serological surveys and vaccination coverage. Hum Vaccin Immunother. 2012;8(2):184–188. doi: 10.4161/hv.18444. [DOI] [PubMed] [Google Scholar]
- 4.HealthMap [January 28, 2015]; HealthMap website. http://www.healthmap.org/en/.
- 5.Fisman DN, Hauck TS, Tuite AR, Greer AL. An IDEA for short term outbreak projection: nearcasting using the basic reproduction number. PLoS One. 2013;8(12):e83622. doi: 10.1371/journal.pone.0083622. [DOI] [PMC free article] [PubMed] [Google Scholar]
- 6.Fine PEM. Herd immunity: history, theory, practice. Epidemiol Rev. 1993;15(2):265–302. doi: 10.1093/oxfordjournals.epirev.a036121. [DOI] [PubMed] [Google Scholar]