

Abstract
Rationale: More than 25 million American children breathe polluted air on diesel school buses. Emission reduction policies exist, but the health impacts to individual children have not been evaluated.
Methods: Using a natural experiment, we characterized the exposures and health of 275 school bus riders before, during, and after the adoption of clean technologies and fuels between 2005 and 2009. Air pollution was measured during 597 trips on 188 school buses. Repeated measures of exhaled nitric oxide (FeNO), lung function (FEV1, FVC), and absenteeism were also collected monthly (1,768 visits). Mixed-effects models longitudinally related the adoption of diesel oxidation catalysts (DOCs), closed crankcase ventilation systems (CCVs), ultralow-sulfur diesel (ULSD), or biodiesel with exposures and health.
Measurements and Main Results: Fine and ultrafine particle concentrations were 10–50% lower on buses using ULSD, DOCs, and/or CCVs. ULSD adoption was also associated with reduced FeNO (−16% [95% confidence interval (CI), −21 to −10%]), greater changes in FVC and FEV1 (0.02 [95% CI, 0.003 to 0.05] and 0.01 [95% CI, −0.006 to 0.03] L/yr, respectively), and lower absenteeism (−8% [95% CI, −16.0 to −0.7%]), with stronger associations among patients with asthma. DOCs, and to a lesser extent CCVs, also were associated with improved FeNO, FVC growth, and absenteeism, but these findings were primarily restricted to patients with persistent asthma and were often sensitive to control for ULSD. No health benefits were noted for biodiesel. Extrapolating to the U.S. population, changed fuel/technologies likely reduced absenteeism by more than 14 million/yr.
Conclusions: National and local diesel policies appear to have reduced children’s exposures and improved health.
Keywords: particulate matter, air pollution, asthma, absenteeism, lung function
At a Glance Commentary
Scientific Knowledge on the Subject
Exposures to traffic-related air pollution at home and school have been repeatedly linked to adverse respiratory health in children. Children also experience elevated pollution levels on diesel-powered school buses, yet little is known about the resultant health effects or the level of protection offered by clean air technologies and fuels on school buses.
What This Study Adds to the Field
The findings from this natural experiment suggest that when children ride buses with clean air technologies and/or fuels, they experience lower exposures to air pollution, less pulmonary inflammation, more rapid lung growth over time, and reduced absenteeism than when they are on buses without these technologies and fuels. These improvements were often strongest among children with asthma, suggesting that cleaner buses may be especially important to protecting the health of our most vulnerable students. Given that more than 25 million American children commute to school each day via school bus, these findings have clear policy implications for protecting the health of school children.
Traffic-related air pollution may adversely affect children’s respiratory health (1–11). Little is known, however, about the health effects of commuting to school, especially aboard diesel-powered school buses. As more than 25 million American children commute via school bus (12) and experience elevated pollution levels on these buses (13–19), commuting is a major contributor to children’s exposures to traffic-related air pollutants (14, 20–22).
To limit exposures to diesel exhaust and to protect health, the U.S. Environmental Protection Agency (USEPA) created a voluntary retrofit initiative to help states install clean air technologies on vehicles. Clean air technologies such as diesel oxidation catalysts (DOCs) and crankcase ventilation systems (CCVs) are used to reduce tailpipe and engine emissions, respectively. These technologies, which can be adopted on older buses and are commonly installed on newer buses, are estimated to reduce particulate emissions and onboard concentrations by 20 to 50% (23–28). The USEPA also required that refineries produce ultralow-sulfur diesel (ULSD) starting in 2006 under the Highway Diesel Fuel Sulfur Control Requirements. ULSD and biodiesel are projected to reduce particle generation by approximately 10–30% and to enhance the operation of clean air technologies (23, 29). Although these initiatives have been estimated to prevent approximately 20,000 hospitalizations and 3.3 million days of lost productivity (30), no study has directly assessed the health impacts of these policies on individual children.
We investigated the impacts of clean air technologies and fuels on air pollution levels in school buses and on pulmonary health in a cohort of elementary school children. Associations were explored using a natural experiment in which we monitored in-bus air pollution concentrations and markers of health before, during, and after the staggered adoption of clean air technologies and fuels. Early results of this study have been previously reported as abstracts (31–33), and one published article (16).
Methods
Population and Design
We sampled 307 school bus riders (6–12 yr) attending a public elementary school in the Seattle and Tahoma, Washington, school districts (see Figure E1 in the online supplement). Children were monitored monthly (2005–2009) while the Puget Sound Clean Air Agency (PSCAA) incentivized clean air technology installation and a fuel change occurred under USEPA rules. Children were unaware of the technology and fuel of their buses, resulting in a blinded natural experiment with the collection of exposure and health measurements before, during, and after the staggered implementation of interventions. Children with asthma were preferentially recruited for power and as a sensitive subpopulation (34). Children in smoking households, on buses with fewer than 50 seats, taking oral corticosteroids, or missing information were excluded, resulting in a sample of 275. All protocols were approved by our institutional review board and written guardian consent and child assent were obtained.
Bus Characteristics
Children’s buses were identified on the basis of information from the district transportation departments and later confirmed by school administrators and study technicians. When children rode more than one bus, we used their primary bus for our analyses. Bus characteristics, including age, mileage, technologies, and fuels, were compiled from the PSCAA, school transportation departments, and annual inspection. Adoption of clean air technologies and fuels was also tracked continuously with a focus on DOCs, CCVs, ULSD, and a biodiesel mixture (approximately 20%). Although we had also been interested in diesel particulate filters (DPFs), these were used only temporarily on five buses, so we had insufficient information for our models.
Air Pollution
We collected measurements inside 188 buses (“in cabin”) during 597 regular commutes greater than 10 minutes. Fine (PM2.5) and ultrafine (UFP) particulate matter were measured with a pDR-1200 equipped with a cyclone preseparator (Thermo Scientific, Waltham, MA) and P-TRAK 8525 (TSI, Shoreview, MN), respectively. A PAS2000CE (EcoChem Analytics, League City, TX) was also used to capture particle-bound polycyclic aromatic hydrocarbons (pb-PAHs) as well as the black carbon content of the particles. During most trips, pollution was also measured inside a gasoline hybrid electric car traveling before the bus with open windows (“on road”). Differences between the bus and road reflect the pollution from the bus itself (“self-pollution”) as has been validated by chemical tracer research (35). Ambient pollution measurements were also obtained from the PSCAA.
Pulmonary Health
Lung function and exhaled nitric oxide (FeNO) were measured monthly at school by technicians unaware of the children’s bus characteristics. Measurements were collected at fixed times on school day mornings and afternoons, in accordance with standard procedures (36). FeNO and room nitric oxide were collected with an offline collection kit (Sievers, Boulder, CO). Children exhaled into 1.5-liter aluminized Mylar balloons at a constant pressure of 12 cm H2O to prevent contamination by nasal nitric oxide and to normalize expiratory flow rates. FeNO samples were collected in triplicate and analyzed within 4 hours with an NOA 280i (Sievers), using the median value for our analysis. FEV1 and FVC were measured with a MicroDL spirometer (Micro Medical, Lewiston, ME). Self-reported absenteeism in the previous month was supplemented with technician-collected records on absenteeism on the day of health testing.
General health, including asthma symptoms and recent illness, was ascertained by technician-administered questionnaires. Asthma status was assessed annually by doctor diagnosis or symptoms of wheezing or whistling in chest, wheezing after exercise, or a dry cough at night over the previous year based on validated questions from the International Study of Asthma and Allergies in Childhood (ISAAC) survey (37). Asthma severity was defined as persistent asthma (on controller medication), intermittent asthma (not on controller medication), and nonasthmatic.
Covariates
Self-reported demographics (race, sex, parental education) and medical history were collected at an annual health screening. Height and weight were obtained during monthly examinations, concurrent with collection of pulmonary health endpoints. Meteorology (relative humidity and temperature) and flu prevalence data were obtained from the University of Washington Atmospheric Sciences Department and the U.S. Influenza-Like Illness Surveillance Network, respectively. School and home locations were classified as near a major roadway, using ArcGIS (ESRI, Redlands, CA), if they were within 100 m of an interstate or U.S. highway or within 50 m of a state or county highway.
Statistical Analysis
Descriptive statistics were generated using repeated-measures analysis of variance models. Exploratory analyses then compared pollution and health between buses that never or always had certain technologies/fuels as well as within buses before and after a switch. Pollutant and FeNO levels were log-transformed due to right-skewed distributions and investigated using multivariable mixed-effects models to account for correlation between repeated measures. Two-stage growth models with random intercepts and slopes were used for spirometry measures (38, 39). Risk differences for being absent within the past month were modeled with a mixed-effects log binomial regression. In-bus pollution models adjusted for ambient PM2.5, weather (wind speed, temperature, relative humidity), bus characteristics (manufacturer, mileage, year, engine position, make, and model, bus base), and trip covariates (stops, duration, window usage, time of day, on-road pollution events). Health models were adjusted for age, race, sex, asthma, temperature, relative humidity, ambient PM2.5, district flu prevalence, and seasonality. For FeNO and spirometry, height, weight, and cold/flu were also included. School air nitric oxide and day of week were included in FeNO models. Nonlinear relationships were assessed in R version 3.02 (www.r-project.org) and modeled with splines (flu prevalence) whereas other analyses used SAS version 9.3 (SAS Institute, Cary, NC). Models were run first with individual technologies and fuels and then with all technologies and fuels to separate the independent associations with pollutants and health. We further explored the impacts of DOC, CCV, and biodiesel among buses after the national switch to ULSD to assess the added benefit of nonrequired clean air interventions.
We tested for effect modification by asthma status and confirmed the robustness of our results to control for parental education, school/home roadway proximity, district, and additional time trends. We also explored sensitivity to classifying asthma on the basis of doctor diagnosis, restricting to children riding the same bus at least 75% of the time, control for or exclusion of buses with a DPF, and using fixed-effects models. Finally, we estimated preventable absences if all American school bus riders exclusively rode buses with clean air technologies and fuels. These calculations assumed that 54.6% of 54,876,000 school children ride buses (12), that 9.3% of these children have asthma (40), and that, of the children with asthma, 25% have persistent asthma (41).
Results
Study Participants
A total of 275 bus riders provided 3,223 observations with an average of 6 (range, 1–19) repeat visits over 4 years. These children were predominantly white and from college-educated families (Table 1). The mean age was 9.5 years. More than half (54%) were asthmatic, and the majority (85%) were not taking controller medication. Higher FeNO levels, more frequent absenteeism, and lower baseline lung function were observed among children with asthma compared with healthy children.
Table 1.
Characteristics of Bus-Riding Elementary School Children Monitored between 2005 and 2009 during the Adoption of Clean Air Technologies and Fuels
| All | No Asthma | Intermittent Asthma | Persistent Asthma | |
|---|---|---|---|---|
| Number of children | 275 (100%) | 126 (46%) | 126 (46%) | 23 (8%) |
| Number of samples | 3,223 (100%) | 1,590 (49%) | 1,326 (41%) | 307 (10%) |
| Baseline age, yr | ||||
| 6–8 | 90 (33%) | 34 (27%) | 47 (37%) | 9 (39%) |
| 9–10 | 127 (46%) | 65 (52%) | 52 (41%) | 10 (43%) |
| 11–12 | 58 (21%) | 27 (21%) | 27 (21%) | 4 (17%) |
| Female | 124 (45%) | 57 (45%) | 58 (46%) | 9 (39%) |
| Race | ||||
| Asian | 25 (9%) | 11 (9%) | 13 (10%) | 1 (4%) |
| Black | 23 (8%) | 4 (3%) | 18 (14%) | 1 (4%) |
| Other | 19 (7%) | 5 (4%) | 9 (7%) | 5 (22%) |
| White | 203 (74%) | 105 (83%) | 83 (66%) | 15 (65%) |
| Parental education | ||||
| College | 33 (12%) | 8 (6%) | 22 (17%) | 3 (13%) |
| Some college | 35 (13%) | 16 (13%) | 16 (13%) | 3 (13%) |
| College | 88 (32%) | 45 (36%) | 32 (25%) | 11 (48%) |
| College | 105 (38%) | 54 (43%) | 45 (36%) | 6 (26%) |
| School district | ||||
| Tahoma | 89 (32%) | 39 (31%) | 39 (31%) | 11 (48%) |
| Seattle | 186 (68%) | 87 (69%) | 87 (69%) | 12 (52%) |
| Height, m | 1.4 (0.1) | 1.4 (0.1) | 1.4 (0.1) | 1.4 (0.2) |
| Weight, kg | 35.2 (11.0) | 34.2 (9.1) | 36.2 (12.1) | 34.6 (14.1) |
| Outcomes | ||||
| FeNO, ppb | 12.1 (1.9) | 10.0 (1.6) | 14.2 (2.0) | 14.3 (2.3) |
| FEV1, L | ||||
| Baseline | 1.73 (0.4) | 1.78 (0.36) | 1.69 (0.42) | 1.67 (0.47) |
| Δ per year | 0.13 (0.49) | 0.15 (0.4) | 0.14 (0.51) | 0.01 (0.77) |
| FVC, L | ||||
| Baseline | 2.09 (0.48) | 2.13 (0.45) | 2.06 (0.49) | 2.09 (0.54) |
| Δ per year | 0.17 (0.54) | 0.2 (0.38) | 0.2 (0.57) | −0.06 (0.94) |
| MMEF, cl/s | ||||
| Baseline | 167.0 (56.1) | 176.2 (52.5) | 160.5 (58.2) | 152.3 (58.2) |
| Δ per year | 14.5 (121.1) | 14.4 (113.5) | 14.8 (125.7) | 12.9 (141.4) |
| Missed school days per month | 0.35 (0.25) | 0.32 (0.25) | 0.35 (0.26) | 0.40 (0.24) |
| Interventions | ||||
| DOC | ||||
| Never | 36 (13%) | 19 (15%) | 15 (15%) | 2 (9%) |
| Sometimes | 48 (17%) | 23 (18%) | 18 (18%) | 7 (30%) |
| Always | 191 (69%) | 84 (67%) | 93 (67%) | 14 (61%) |
| CCV | ||||
| Never | 81 (29%) | 37 (29%) | 36 (29%) | 8 (35%) |
| Sometimes | 101 (37%) | 52 (41%) | 41 (33%) | 8 (35%) |
| Always | 93 (34%) | 37 (29%) | 49 (39%) | 7 (30%) |
| ULSD | ||||
| Never | 13 (5%) | 8 (6%) | 5 (4%) | 0 (0%) |
| Sometimes | 40 (15%) | 18 (14%) | 15 (12%) | 7 (30%) |
| Always | 222 (81%) | 100 (79%) | 106 (84%) | 16 (70%) |
| Biodiesel | ||||
| Never | 183 (67%) | 90 (71%) | 77 (61%) | 16 (70%) |
| Sometimes | 72 (26%) | 32 (25%) | 38 (30%) | 2 (9%) |
| Always | 20 (7%) | 4 (3%) | 11 (9%) | 5 (22%) |
Definition of abbreviations: CCV = crankcase ventilation system; DOC = diesel oxidation catalyst; FeNO = fraction of exhaled nitric oxide; MMEF = maximal midexpiratory flow; ULSD = ultralow-sulfur diesel.
Data are given as n (%) or mean (SD).
Buses Serving Study Population
During our 4-year study the adoption of clean air technologies and fuels increased over time (Figure 1). Across all buses serving our study population, approximately half had DOCs and ULSD and 35% had CCVs in the first year whereas greater than 90% had these technologies and fuels in the final year. This resulted in the majority of students always riding buses with DOCs (69%) and ULSD (81%) and fewer always riding buses with CCV (34%) and biodiesel (7%). Between 15 and 37% of students rode buses with and without clean air technologies and/or fuels, allowing for within-subject comparisons (Table 1 and Table E1). In general, there was little correlation between the various technologies and fuels, with the exception of DOC and ULSD, which had a correlation of approximately 0.5.
Figure 1.

Clean air technologies and fuels over the 4-year study (defined as absent all year, changed during the year, or present all year). CCV = crankcase ventilation system; DOC = diesel oxidation catalyst; ULSD = ultralow-sulfur diesel.
Measured Pollution Levels on Monitored Buses
Among the 597 trips on 188 buses with air pollution monitoring, the average mileage was 65,100 (SD, 58,700) and bus body year was 2002 (SD, 5) (Table 2). The average trip had a duration of 40 minutes (SD, 17 min) with 27 riders (SD, 14). Mean (±SD) in-cabin PM2.5 concentrations (20 ± 18 μg/m3) were approximately three times higher than ambient levels (7 ± 5 μg/m3) and 1.5 times higher than roadway levels (13 ± 12 μg/m3). Mean in-cabin UFP levels (21 ± 12 thousand/cm3) were lower than on the surrounding roadways (29 ± 20 thousand/cm3). Average pb-PAH concentrations were also lower inside bus cabins (101 ± 70 ng/m3) than on surrounding roadways (125 ± 88 ng/m3).
Table 2.
Characteristics of Monitored School Buses and Trips
| All Buses |
Buses That Switched Technologies/Fuels |
|||
|---|---|---|---|---|
| Buses | Trips | Buses | Trips | |
| n | 188 | 597 | 62 | 292 |
| Clean air technologies* | ||||
| Diesel oxidative catalyst | 165 (88%) | 510 (85%) | 18 (29%) | 93 (32%) |
| Crankcase ventilation | 134 (71%) | 376 (63%) | 36 (58%) | 177 (61%) |
| Diesel particulate filter | 5 (3%) | 10 (2%) | 0 (0%) | 0 (0%) |
| Clean air fuels* | ||||
| Ultralow-sulfur diesel | 183 (97%) | 549 (92%) | 18 (29%) | 93 (32%) |
| Biodiesel | 59 (31%) | 152 (25%) | 28 (45%) | 138 (47%) |
| Mileage, in thousands | 65.7 (57.4) | 65.1 (58.7) | 70.1 (54.5) | 71.3 (58.9) |
| Body year | 2002 (5.2) | 2002 (5.0) | 2002 (4.7) | 2002 (4.7) |
| Seating capacity | 72 (4.4) | 72 (4.5) | 73 (4.0) | 73 (4.1) |
| Opacity, % | 4 (7.3) | 5 (9.8) | 5 (7.9) | 5 (9.6) |
Data are given as n (%) or mean (SD).
Bus results reported if bus ever had the technology or fuel. Trip data reflect the conditions during the monitoring event.
In multivariable models, we found strong evidence of lower in-cabin PM2.5 concentrations with clean air technology use but weaker evidence for fuel types (Figure 2). DOCs and CCVs were associated with 26% (95% CI, −42 to −6%) and 40% (95% CI, −48 to −30%) lower in-cabin PM2.5 concentrations, respectively. In contrast, UFPs were lowest with DOCs (−43%; 95% CI, −53 to −31%) and ULSD (−47%; 95% CI, −58 to −34%) with weaker reductions for CCVs and no associations with biodiesel. For pb-PAH concentrations, there were consistent increases with DOCs, CCVs, and ULSD. Only biodiesel was associated with lower in-cabin pb-PAH concentrations (−40%; 95% CI, −49 to −28%). Findings were similar for self-pollution concentrations and models adjusted for other technologies and fuels (results not shown).
Figure 2.

Associations of clean air technologies and fuels with air pollution concentrations inside school buses after control for ambient weather and pollutants, bus characteristics, and trip features. Models were adjusted for ambient wind speed, temperature, relative humidity, ambient PM2.5, noted pollution events, trip duration, number of stops, open windows, time of day, bus base, year bus was built, mileage, engine make and model, body make, and random intercept for each bus. These contrasts include data from different buses and those that switched technologies. B20 = biodiesel; CCV = crankcase ventilation system; DOC = diesel oxidative catalyst; PAH = polycyclic aromatic hydrocarbons; PM2.5 = fine particulate matter, ≤2.5-μm diameter; UFP = ultrafine particulate matter; ULSD = ultralow-sulfur diesel.
Exhaled Nitric Oxide
Strong and statistically significant associations were identified between FeNO and ULSD use in fully adjusted models (Figure 3). Among the whole cohort, ULSD was associated with 16% (95% CI, −21 to −10%) lower FeNO levels. These associations were strongest among children with asthma: 31% (95% CI, −39 to −21%), 20% (95% CI, −28 to −12%), and 6% (95% CI, −14 to 2%) lower levels among children with persistent asthma, intermittent asthma, and no asthma, respectively. These associations were robust to control for other technologies and fuels (results not shown).
Figure 3.

Adjusted associations (percent difference, 95% confidence interval) between levels of exhaled nitric oxide and clean air technologies and fuels among all students and by asthma status. Models were adjusted for age, sex, race/ethnicity, height, asthma status, ambient temperature, relative humidity, fine particulate matter (≤2.5-μm diameter), room nitric oxide, district flu prevalence, individual report of a cold or flu, within–school year time trend, time of day, and random subject effect. B20 = biodiesel; CCV = crankcase ventilation system; DOC = diesel oxidative catalyst; ULSD = ultralow-sulfur diesel.
For children with persistent asthma, lower FeNO levels were observed for children riding buses with DOCs (−12%; 95% CI, −23 to −0.4%) or CCVs (−14%; 95% CI, −24 to −4%) compared with buses without these technologies. Associations with CCVs, but not DOCs, were robust to control for other technologies and fuels but they were not found among other children. Biodiesel was unassociated with FeNO.
Pulmonary Function
Among all children, rates of change were 0.17 L/yr for FVC and 0.13 L/yr for FEV1. After control for other factors, we observed 0.02 (95% CI, 0.003–0.05) and 0.02 (95% CI, 0.001–0.04) L/yr faster rates of change in FVC among children riding buses with ULSD and DOCs, respectively (Figure 4). These associations with FVC were generally robust to control for other technologies and fuels as well as stratification by school year among children without asthma (results not shown). Suggestive increases in FEV1 over time were also found among all children for ULSD (0.01 L/yr; 95% CI, −0.006 to 0.03) and DOC (0.01 L/yr; 95% CI, −0.008 to 0.03) use, due primarily to associations with children without asthma and those with mild asthma. Lower changes in FEV1 were observed with DOCs, ULSD, and biodiesel among those with persistent asthma. Although these associations were generally robust to control for multiple interventions, they had wide confidence intervals and could not be distinguished from no association.
Figure 4.

Adjusted associations (percent difference, 95% confidence interval) between rate of change in lung function over time and clean air technologies and fuels among all students and by asthma status. Models were adjusted for age, sex, race/ethnicity, height, weight, asthma status, ambient temperature, relative humidity, fine particulate matter (≤2.5-μm diameter), district flu prevalence, individual report of a cold or flu, within–school year time trend, and random subject effect. B20 = biodiesel; CCV = crankcase ventilation system; DOC = diesel oxidative catalyst; ULSD = ultralow-sulfur diesel.
Absenteeism
Children missed an average of 3.1 school days over 9 months (2.9 for children without asthma, 3.6 for children with persistent asthma). Among all children, there was an 8% (95% CI, −16 to −1%) lower risk of being absent in the previous month when riding a bus with ULSD as compared with other buses (Figure 5). Similar findings were observed for DOC use: a 6% (95% CI, −11 to −0.2%) reduction in the risk of absenteeism over the past month. These associations were largest among children with asthma, especially those receiving controller therapy. Although associations with ULSD were robust to control for other technologies and fuels, associations with DOCs were diminished by control for ULSD (results not shown). On the basis of these findings, we estimate that the switch to ULSD resulted in 14 million fewer absences per year across the United States.
Figure 5.
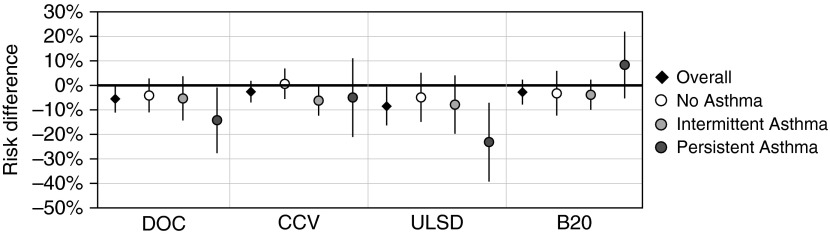
Adjusted associations (risk difference, 95% confidence interval) for any absenteeism in the past month as a function of clean air technologies and fuels among all students and by asthma status. Models were adjusted for age, sex, race/ethnicity, asthma status, ambient temperature, relative humidity, fine particulate matter (≤2.5-μm diameter), district flu prevalence, within–school year time trend, and random subject effect. B20 = biodiesel; CCV = crankcase ventilation system; DOC = diesel oxidative catalyst; ULSD = ultralow-sulfur diesel.
Sensitivity of Results
Associations between clean air technologies and fuels with each of the health endpoints were qualitatively robust to further adjustment for parental education, school/home proximity to major roads, district, and additional time trends. Our findings were also insensitive to use of doctor-diagnosed asthma, restricting to children riding the same bus at least 75% of the time, excluding or controlling for buses with a DPF, and modeling using fixed effects. Restriction to only those buses using ULSD suggested independent improvements with DOCs for absenteeism among children with severe asthma and changes in FVC over time, although little change was observed with FEV1 or FeNO after this restriction (results not shown).
Discussion
In this natural experiment, we documented lower in-vehicle exposures and improved pulmonary health of children with the adoption of clean air technologies and fuels on school buses. PM2.5 concentrations were 25–40% lower on buses with DOCs and CCVs, and UFP levels were 40–50% lower on buses with DOCs and ULSD. In health analyses, we found that ULSD was most consistently associated with beneficial effects with evidence of less pulmonary inflammation, faster lung growth, and lower risks of school absenteeism. These results were robust to control for other technologies and fuels and were often largest among children with asthma, especially those with persistent asthma. DOCs, and to a lesser extent CCVs, also were associated with better health, but these findings were primarily restricted to those with persistent asthma and were often sensitive to control for ULSD. Overall, we found that adopting certain clean air technologies and fuels reduced in-vehicle particulate exposures and likely improved respiratory health.
To our knowledge, no prior studies have examined the individual-level health impacts of clean air technologies and fuels, although one school district–level analysis suggested that a school bus emission reduction program was associated with decreased incidence of bronchitis, asthma, and pneumonia (42). Our findings suggest that the benefits of school bus emission reductions are also experienced at the child level. We identified sizeable improvements in absenteeism for children riding buses with ULSD that are comparable to 50–70% of the reductions observed for children living in nonsmoking homes as compared with homes with smokers (43). With 25 million children riding buses to school (12), we estimate that switching to ULSD resulted in 14 million fewer absences per year in the United States. Such reductions in absenteeism may translate to improved grades and health for the students (15, 16) as well as less missed work and lost productivity for their caregivers. Although results were strongest with ULSD, we also found evidence of reduced absenteeism among children with severe asthma and increased FVC over time with DOC usage even when restricted to buses using ULSD. This suggests that there may be additional benefit to clean air technologies independent of any changes in fuel.
Clean air technologies and fuels were not only associated with health benefits but also with reductions in on-board pollution. Both DOC and CCVs showed significant reductions in PM2.5 and UFPs. This is generally consistent with previous in-vehicle studies, which found reductions of 25–60% for PM2.5 and 5–70% for UFPs (17, 25, 27, 28). Reductions in UFPs, and to a lesser extent PM2.5, with ULSD are also consistent with an earlier in-cabin study using ULSD in combination with DPF (17). Interestingly, our findings of comparatively larger reductions in PM2.5 with CCVs and larger reductions in UFPs with DOCs are supported by previous research demonstrating that in-cabin PM2.5 concentrations are primarily due to crankcase emissions and that UFPs primarily originate from the tailpipe (35, 44). Although we have previously demonstrated distinct patterning of pb-PAHs from PM2.5 and UFPs in school buses (45), the observed increase in pb-PAHs with DOCs, CCVs, and ULSD is unexpected given that past research has generally shown reductions with clean air technologies and fuels (17, 46–48). Unfortunately, we have little explanation for these findings. One hypothesis is that a shift in the distribution of PAHs between the gaseous and particle phase may have led to measurement artifact because enhanced nitro-PAH formation and nucleation can occur with clean air technologies (46, 49, 50).
The finding that ULSD and DOCs were most strongly and consistently associated with health suggests that UFPs may be a critical exposure on school buses. This is not surprising because UFPs are hypothesized to be especially toxic because of their high deposition in the lower airways, large surface areas to absorb chemicals/free radicals, lower removal by alveolar macrophages, and ability to initiate inflammation (51). Associations with FeNO, a marker of cytokine activity in the airways and alveoli (52), also suggest that lowered inflammation is a likely mechanism through which decreased exposures may lead to improved health. Furthermore, our finding of greater health improvements among children with asthma is also consistent with UFPs because airway narrowing increases the deposition efficiency of UFP in the lungs (53).
The cohesiveness of our findings across several endpoints further supports the hypothesized benefits of clean air technologies and fuels on respiratory health. Our results are consistent with controlled exposure studies in animals and humans, which have reported increased inflammation after the inhalation of diesel exhaust (54–58). Given that ULSD, DOCs, and CCVs were associated with lower particulate concentrations, our results are further supported by population-based studies of children that have linked higher particulate concentrations with higher FeNO (59, 60), slower lung growth (61, 62), asthma exacerbation (63), and school absenteeism (61, 64–66). Although all of our results were on the same order of magnitude as past research, our lung growth findings were somewhat larger than expected (61, 64–67). This may be partially attributable to the young age of this population or the high asthma prevalence because some, although not all, research has reported enhanced associations among this group (34).
This study has numerous strengths including its large size and repeated, individual-level health and in-vehicle air pollution measurements surrounding the adoption of clean air technologies and fuels. It is not, however, without limitations. One key limitation is the possibility for residual confounding by time because some technologies/fuels, like ULSD, were used only in the later years of the study. If our statistical models inadequately captured any temporal trends in health, then we could incorrectly attribute some of the observed changes in health to the bus technologies/fuels. Sensitivity analyses indicated that this was unlikely for FeNO and absenteeism as our models were robust to additional adjustment for time and there were no significant time trends among children who rode buses that did not change technologies or fuels. In contrast, FVC is more closely linked to time in this population. We allowed for different growth curves by age and age-adjusted height after accounting for differences between the sexes, ages, and asthma status. Within this age range, linear trends are expected and observed. If, however, accelerated growth due to puberty occurred among a small fraction of children, then the true associations with lung growth could be overestimated. Another limitation is that our absenteeism information was not verified by school records. Any misclassification would not likely be differential, however, because children were unaware of their bus characteristics. In addition, we supplemented self-reported absenteeism data with technician-recorded absenteeism of children during their monthly examinations to account for the inherent problem that absent children cannot report their absenteeism. Finally, although we a priori anticipated that children with asthma would be more sensitive to exposures, we cannot exclude the possibility that our findings of enhanced associations among those with persistent asthma were due to chance given the small sample size (23 children, 307 samples).
In summary, we used a natural experiment to examine associations between clear air technologies and fuels in school buses and children’s health. Our results show that the national switch to ULSD fuel may have had a measureable positive public health impact on children riding diesel school buses. This benefit was likely especially important for children with asthma. Our results further suggest that children with asthma may also have benefited from the nationwide voluntary school bus retrofit initiative and the adoption of DOCs and CCVs. Although the exact results varied by outcome, ULSD and DOCs were most consistently associated with both reduced pollutant concentrations and improved health, suggesting a role for UFPs in the health effects of diesel-powered school buses.
Acknowledgments
Acknowledgment
This work would not have been possible without the efforts of René Irish, Erin Corwine, Nichole Real, Tim Gould, Alex Ineichen, and the Diesel Bus Monitoring Team. The authors are thankful for the advice and support of Dr. Jim Krieger (Seattle-King County Department of Public Health), Michael Boyer and David Adler (Department of Ecology), Bridget Anderson, Michelle Zaleski, Doug Sander, and Bruce Zahradnik (Tahoma Schools), Jill Lewis (Seattle Schools), Stacy Roberts, Robert Cook, and David Oylear (First Student), and Michael Montgomery (Curtis Transportation). The authors are also extremely grateful for collaborations with Joellen Lewtas (University of Washington), David Anderson (Seattle Schools Transportation Department), and Paul Carr and John Anderson (PSCAA Diesel Solution Program). The authors also thank the Seattle and Tahoma principals, teachers, and students whose daily support made this study possible.
Footnotes
Supported by the NIEHS (#1R01ES12657-01A1), the Washington Department of Ecology, and the University of Washington Center for Ecogenetics and Environmental Health (NIEHS, P30ES007033).
Author Contributions: S.D.A., L.S., J.D.K., T.S.H., M.E.D., J.K., and L.J.S.L. were involved in the study design of this project. S.D.A., T.S.H., M.E.D., J.R.S., and L.J.S.L. were involved in data collection. S.D.A., J.D’S., L.S., and J.J. were involved in data analysis. S.D.A., L.S., J.D.K., T.S.H., J.K., L.J.S.L., and T.V.L. were involved in data interpretation. S.D.A. wrote the first draft of the manuscript with feedback from all authors but L.J.S.L., who died before completion of the manuscript.
This article has an online supplement, which is accessible from this issue’s table of contents at www.atsjournals.org
Originally Published in Press as DOI: 10.1164/rccm.201410-1924OC on April 13, 2015
Author disclosures are available with the text of this article at www.atsjournals.org.
References
- 1.Brunekreef B, Janssen NA, de Hartog J, Harssema H, Knape M, van Vliet P. Air pollution from truck traffic and lung function in children living near motorways. Epidemiology. 1997;8:298–303. doi: 10.1097/00001648-199705000-00012. [DOI] [PubMed] [Google Scholar]
- 2.Gauderman WJ, Avol E, Lurmann F, Kuenzli N, Gilliland F, Peters J, McConnell R. Childhood asthma and exposure to traffic and nitrogen dioxide. Epidemiology. 2005;16:737–743. doi: 10.1097/01.ede.0000181308.51440.75. [DOI] [PubMed] [Google Scholar]
- 3.Gordian ME, Haneuse S, Wakefield J. An investigation of the association between traffic exposure and the diagnosis of asthma in children. J Expo Sci Environ Epidemiol. 2006;16:49–55. doi: 10.1038/sj.jea.7500436. [DOI] [PubMed] [Google Scholar]
- 4.McConnell R, Berhane K, Yao L, Jerrett M, Lurmann F, Gilliland F, Künzli N, Gauderman J, Avol E, Thomas D, et al. Traffic, susceptibility, and childhood asthma. Environ Health Perspect. 2006;114:766–772. doi: 10.1289/ehp.8594. [DOI] [PMC free article] [PubMed] [Google Scholar]
- 5.van Vliet P, Knape M, de Hartog J, Janssen N, Harssema H, Brunekreef B. Motor vehicle exhaust and chronic respiratory symptoms in children living near freeways. Environ Res. 1997;74:122–132. doi: 10.1006/enrs.1997.3757. [DOI] [PubMed] [Google Scholar]
- 6.Brauer M, Hoek G, Smit HA, de Jongste JC, Gerritsen J, Postma DS, Kerkhof M, Brunekreef B. Air pollution and development of asthma, allergy and infections in a birth cohort. Eur Respir J. 2007;29:879–888. doi: 10.1183/09031936.00083406. [DOI] [PubMed] [Google Scholar]
- 7.English P, Neutra R, Scalf R, Sullivan M, Waller L, Zhu L. Examining associations between childhood asthma and traffic flow using a geographic information system. Environ Health Perspect. 1999;107:761–767. doi: 10.1289/ehp.99107761. [DOI] [PMC free article] [PubMed] [Google Scholar]
- 8.Janssen NAH, Brunekreef B, van Vliet P, Aarts F, Meliefste K, Harssema H, Fischer P. The relationship between air pollution from heavy traffic and allergic sensitization, bronchial hyperresponsiveness, and respiratory symptoms in Dutch schoolchildren. Environ Health Perspect. 2003;111:1512–1518. doi: 10.1289/ehp.6243. [DOI] [PMC free article] [PubMed] [Google Scholar]
- 9.Morgenstern V, Zutavern A, Cyrys J, Brockow I, Gehring U, Koletzko S, Bauer CP, Reinhardt D, Wichmann HE, Heinrich J. Respiratory health and individual estimated exposure to traffic-related air pollutants in a cohort of young children. Occup Environ Med. 2007;64:8–16. doi: 10.1136/oem.2006.028241. [DOI] [PMC free article] [PubMed] [Google Scholar]
- 10.Ryan PH, LeMasters G, Biagini J, Bernstein D, Grinshpun SA, Shukla R, Wilson K, Villareal M, Burkle J, Lockey J. Is it traffic type, volume, or distance? Wheezing in infants living near truck and bus traffic. J Allergy Clin Immunol. 2005;116:279–284. doi: 10.1016/j.jaci.2005.05.014. [DOI] [PubMed] [Google Scholar]
- 11.Weinmayr G, Romeo E, De Sario M, Weiland SK, Forastiere F. Short-term effects of PM10 and NO2 on respiratory health among children with asthma or asthma-like symptoms: a systematic review and meta-analysis. Environ Health Perspect. 2010;118:449–457. doi: 10.1289/ehp.0900844. [DOI] [PMC free article] [PubMed] [Google Scholar]
- 12.Snyder TD, Dillow SA. Washington, DC: National Center for Education Statistics, Institute of Education Sciences, U.S. Department of Education; 2011. Digest of education statistics 2010 [NCES 2011-015] [Google Scholar]
- 13.Environmental and Human Health, Inc. North Haven, CT: EHHI; 2002. Children’s exposure to diesel exhaust on school buses. [Google Scholar]
- 14.Behrentz E, Sabin LD, Winer AM, Fitz DR, Pankratz DV, Colome SD, Fruin SA. Relative importance of school bus-related microenvironments to children’s pollutant exposure. J Air Waste Manag Assoc. 2005;55:1418–1430. doi: 10.1080/10473289.2005.10464739. [DOI] [PubMed] [Google Scholar]
- 15.Solomon GM, Campbell TR, Ruderman Feuer G, Masters J, Samkian A, Kavita AP. New York: National Resources Defense Council and Coalition for Clean Air; 2001. No breathing in the aisles: diesel exhaust inside school buses. [Google Scholar]
- 16.Adar SD, Davey M, Sullivan JR, Compher M, Szpiro A, Liu LJS. Predicting airborne particle levels aboard Washington State school buses. Atmos Environ (1994) 2008;42:7590–7599. doi: 10.1016/j.atmosenv.2008.06.041. [DOI] [PMC free article] [PubMed] [Google Scholar]
- 17.Hill LB, Zimmerman NJ, Gooch J. Boston, MA: Clean Air Task Force; 2005. A multi-city investigation of the effectiveness of retrofit emissions controls in reducing exposures to particulate matter in school buses. [Google Scholar]
- 18.Fitz DR, Winer AM, Colome SD, Behrentz E, Sabin LD, Lee SJ. Sacramento, CA: California Air Resources Board; 2003. Characterizing the range of children’s pollutant exposure during school bus commutes: final report prepared for the California Air Resources Board. [Google Scholar]
- 19.Sabin LD, Behrentz E, Winer AM, Jeong S, Fitz DR, Pankratz DV, Colome SD, Fruin SA. Characterizing the range of children’s air pollutant exposure during school bus commutes. J Expo Anal Environ Epidemiol. 2005;15:377–387. doi: 10.1038/sj.jea.7500414. [DOI] [PubMed] [Google Scholar]
- 20.Wu CF, Delfino RJ, Floro JN, Quintana PJE, Samimi BS, Kleinman MT, Allen RW, Liu LJS. Exposure assessment and modeling of particulate matter for asthmatic children using personal nephelometers. Atmos Environ. 2005;39:3457–3469. [Google Scholar]
- 21.Sabin LD, Kozawa K, Behrentz E, Winer AM, Fitz DR, Pankratz DV, Colome SD, Fruin SA. Analysis of real-time variables affecting children’s exposure to diesel-related pollutants during school bus commutes in Los Angeles. Atmos Environ. 2005;39:5243–5254. [Google Scholar]
- 22.Rea AW, Zufall MJ, Williams RW, Sheldon L, Howard-Reed C. The influence of human activity patterns on personal PM exposure: a comparative analysis of filter-based and continuous particle measurements. J Air Waste Manag Assoc. 2001;51:1271–1279. doi: 10.1080/10473289.2001.10464351. [DOI] [PubMed] [Google Scholar]
- 23.Neeft JPA, Makkee M, Moulijn JA. Diesel particulate emission control. Fuel Process Technol. 1996;47:1–69. [Google Scholar]
- 24.Hammond D, Jones S, Lalor M. In-vehicle measurement of ultrafine particles on compressed natural gas, conventional diesel, and oxidation-catalyst diesel heavy-duty transit buses. Environ Monit Assess. 2007;125:239–246. doi: 10.1007/s10661-006-9515-z. [DOI] [PubMed] [Google Scholar]
- 25.Trenbath K, Hannigan MP, Milford JB. Evaluation of retrofit crankcase ventilation controls and diesel oxidation catalysts for reducing air pollution in school buses. Atmos Environ. 2009;43:5916–5922. [Google Scholar]
- 26.Westphal GA, Krahl J, Munack A, Ruschel Y, Schröder O, Hallier E, Brüning T, Bünger J. Mutagenicity of diesel engine exhaust is eliminated in the gas phase by an oxidation catalyst but only slightly reduced in the particle phase. Environ Sci Technol. 2012;46:6417–6424. doi: 10.1021/es300399e. [DOI] [PubMed] [Google Scholar]
- 27.Rim D, Siegel J, Spinhirne J, Webb A, McDonald-Buller E. Characteristics of cabin air quality in school buses in central Texas. Atmos Environ. 2008;42:6453–6464. [Google Scholar]
- 28.Zhang Q, Zhu Y. Performance of school bus retrofit systems: ultrafine particles and other vehicular pollutants. Environ Sci Technol. 2011;45:6475–6482. doi: 10.1021/es201070t. [DOI] [PubMed] [Google Scholar]
- 29.Stanislaus A, Marafi A, Rana MS. Recent advances in the science and technology of ultra low sulfur diesel (ULSD) production. Catal Today. 2010;153:1–68. [Google Scholar]
- 30.U.S. Environmental Protection Agency (EPA) Washington DC: EPA; 2009. Report to Congress: highlights of the diesel emissions reduction program. [Google Scholar]
- 31.Adar SD, Hallstrand TS, Kaufman JD, Liu LS. Changes in pulmonary function in childhood are associated with exposures to traffic from school bus exhaust and residential proximity to roadways [abstract] Am J Respir Crit Care Med. 2009;179:A4737. [Google Scholar]
- 32.Sally Liu LJ. Modeling children’s exposures to diesel exhaust from commuting by diesel school buses before and after engine [abstract] Epidemiology. 2006;17:S36. [Google Scholar]
- 33.Liu L, Adar SD, Hallstrand T. Respiratory effects of exposures to diesel exhaust among children bus riders before and after the diesel bus engine retrofit [abstract] Epidemiology. 2008;19:S300. [Google Scholar]
- 34.Sacks JD, Stanek LW, Luben TJ, Johns DO, Buckley BJ, Brown JS, Ross M. Particulate matter-induced health effects: who is susceptible? Environ Health Perspect. 2011;119:446–454. doi: 10.1289/ehp.1002255. [DOI] [PMC free article] [PubMed] [Google Scholar]
- 35.Liu LJS, Phuleria HC, Webber W, Davey M, Lawson DR, Ireson RG, Zielinska B, Ondov JM, Weaver CS, Lapin CA, et al. Quantification of self pollution from two diesel school buses using three independent methods. Atmos Environ (1994) 2010;44:3422–3431. doi: 10.1016/j.atmosenv.2010.06.005. [DOI] [PMC free article] [PubMed] [Google Scholar]
- 36.American Thoracic Society; European Respiratory Society. ATS/ERS recommendations for standardized procedures for the online and offline measurement of exhaled lower respiratory nitric oxide and nasal nitric oxide, 2005. Am J Respir Crit Care Med. 2005;171:912–930. doi: 10.1164/rccm.200406-710ST. [DOI] [PubMed] [Google Scholar]
- 37.Jenkins MA, Clarke JR, Carlin JB, Robertson CF, Hopper JL, Dalton MF, Holst DP, Choi K, Giles GG. Validation of questionnaire and bronchial hyperresponsiveness against respiratory physician assessment in the diagnosis of asthma. Int J Epidemiol. 1996;25:609–616. doi: 10.1093/ije/25.3.609. [DOI] [PubMed] [Google Scholar]
- 38.Wypij D, Pugh M, Ware JH. Modeling pulmonary function growth with regression splines. Stat Sin. 1993;3:329–350. [Google Scholar]
- 39.Berhane K, Gauderman WJ, Stram DO, Thomas DC. Statistical issues in studies of the long-term effects of air pollution: the Southern California Children’s Health Study. Stat Sci. 2004;19:414–434. [Google Scholar]
- 40.Bloom B, Jones LI, Freeman G. Summary health statistics for U.S. children: National Health Interview Survey, 2012. Vital Health Stat 10. 2013;258:1–81. [PubMed] [Google Scholar]
- 41.Peters SP, Ferguson G, Deniz Y, Reisner C. Uncontrolled asthma: a review of the prevalence, disease burden and options for treatment. Respir Med. 2006;100:1139–1151. doi: 10.1016/j.rmed.2006.03.031. [DOI] [PubMed] [Google Scholar]
- 42.Beatty TK, Shimshack JP. School buses, diesel emissions, and respiratory health. J Health Econ. 2011;30:987–999. doi: 10.1016/j.jhealeco.2011.05.017. [DOI] [PubMed] [Google Scholar]
- 43.Levy DE, Winickoff JP, Rigotti NA. School absenteeism among children living with smokers. Pediatrics. 2011;128:650–656. doi: 10.1542/peds.2011-1067. [DOI] [PMC free article] [PubMed] [Google Scholar]
- 44.Ireson RG, Easter MD, Lakin ML, Ondov JM, Clark NN, Wright DB. Estimation of diesel particulate matter concentrations in a school bus using a fuel-based tracer—a sensitive and specific method for quantifying vehicle contributions. Transport Res Record. 2004;1880:21–28. [Google Scholar]
- 45.Larson T, Zielinska B, Ireson R, Liu LS. Source apportionment of PM2.5 inside two school buses using partial least squares regression discriminant analysis with chemical mass balance. Atmos Pollut Res. 2011;2:144–150. [Google Scholar]
- 46.Hesterberg TW, Long CM, Sax SN, Lapin CA, McClellan RO, Bunn WB, Valberg PA. Particulate matter in new technology diesel exhaust (NTDE) is quantitatively and qualitatively very different from that found in traditional diesel exhaust (TDE) J Air Waste Manag Assoc. 2011;61:894–913. doi: 10.1080/10473289.2011.599277. [DOI] [PubMed] [Google Scholar]
- 47.Tang S, Frank BP, Lanni T, Rideout G, Meyer N, Beregszaszy C. Unregulated emissions from a heavy-duty diesel engine with various fuels and emission control systems. Environ Sci Technol. 2007;41:5037–5043. doi: 10.1021/es0622249. [DOI] [PubMed] [Google Scholar]
- 48.Laroo CA, Schenk CR, Sanchez LJ, McDonald J. Emissions of PCDD/Fs, PCBs, and PAHs from a modern diesel engine equipped with catalyzed emission control systems. Environ Sci Technol. 2011;45:6420–6428. doi: 10.1021/es104220f. [DOI] [PubMed] [Google Scholar]
- 49.Zhao H, Ge Y, Zhang T, Zhang J, Tan J, Zhang H. Unregulated emissions from diesel engine with particulate filter using Fe-based fuel borne catalyst. J Environ Sci (China) 2014;26:2027–2033. doi: 10.1016/j.jes.2014.08.004. [DOI] [PubMed] [Google Scholar]
- 50.Heeb NV, Schmid P, Kohler M, Gujer E, Zennegg M, Wenger D, Wichser A, Ulrich A, Gfeller U, Honegger P, et al. Impact of low- and high-oxidation diesel particulate filters on genotoxic exhaust constituents. Environ Sci Technol. 2010;44:1078–1084. doi: 10.1021/es9019222. [DOI] [PubMed] [Google Scholar]
- 51.Ibald-Mulli A, Wichmann H-E, Kreyling W, Peters A. Epidemiological evidence on health effects of ultrafine particles. J Aerosol Med. 2002;15:189–201. doi: 10.1089/089426802320282310. [DOI] [PubMed] [Google Scholar]
- 52.Barnes PJ, Dweik RA, Gelb AF, Gibson PG, George SC, Grasemann H, Pavord ID, Ratjen F, Silkoff PE, Taylor DR, et al. Exhaled nitric oxide in pulmonary diseases: a comprehensive review. Chest. 2010;138:682–692. doi: 10.1378/chest.09-2090. [DOI] [PubMed] [Google Scholar]
- 53.Anderson PJ, Wilson JD, Hiller FC. Respiratory tract deposition of ultrafine particles in subjects with obstructive or restrictive lung disease. Chest. 1990;97:1115–1120. doi: 10.1378/chest.97.5.1115. [DOI] [PubMed] [Google Scholar]
- 54.Lim HB, Ichinose T, Miyabara Y, Takano H, Kumagai Y, Shimojyo N, Devalia JL, Sagai M. Involvement of superoxide and nitric oxide on airway inflammation and hyperresponsiveness induced by diesel exhaust particles in mice. Free Radic Biol Med. 1998;25:635–644. doi: 10.1016/s0891-5849(98)00073-2. [DOI] [PubMed] [Google Scholar]
- 55.Steerenberg PA, Nierkens S, Fischer PH, van Loveren H, Opperhuizen A, Vos JG, van Amsterdam JG. Traffic-related air pollution affects peak expiratory flow, exhaled nitric oxide, and inflammatory nasal markers. Arch Environ Health. 2001;56:167–174. doi: 10.1080/00039890109604069. [DOI] [PubMed] [Google Scholar]
- 56.van Amsterdam JG, Hollander A, Snelder JD, Fischer PH, van Loveren H, Vos JG, Opperhuizen A, Steerenberg PA. The effect of air pollution on exhaled nitric oxide of atopic and nonatopic subjects. Nitric Oxide. 1999;3:492–495. doi: 10.1006/niox.1999.0258. [DOI] [PubMed] [Google Scholar]
- 57.Steerenberg PA, Bischoff EW, de Klerk A, Verlaan AP, Jongbloets LM, van Loveren H, Opperhuizen A, Zomer G, Heisterkamp SH, Hady M, et al. Acute effect of air pollution on respiratory complaints, exhaled NO and biomarkers in nasal lavages of allergic children during the pollen season. Int Arch Allergy Immunol. 2003;131:127–137. doi: 10.1159/000070928. [DOI] [PubMed] [Google Scholar]
- 58.Pourazar J, Mudway IS, Samet JM, Helleday R, Blomberg A, Wilson SJ, Frew AJ, Kelly FJ, Sandström T. Diesel exhaust activates redox-sensitive transcription factors and kinases in human airways. Am J Physiol Lung Cell Mol Physiol. 2005;289:L724–L730. doi: 10.1152/ajplung.00055.2005. [DOI] [PubMed] [Google Scholar]
- 59.Koenig JQ, Jansen K, Mar TF, Lumley T, Kaufman J, Trenga CA, Sullivan J, Liu LJ, Shapiro GG, Larson TV. Measurement of offline exhaled nitric oxide in a study of community exposure to air pollution. Environ Health Perspect. 2003;111:1625–1629. doi: 10.1289/ehp.6160. [DOI] [PMC free article] [PubMed] [Google Scholar]
- 60.Fischer PH, Steerenberg PA, Snelder JD, van Loveren H, van Amsterdam JGC. Association between exhaled nitric oxide, ambient air pollution and respiratory health in school children. Int Arch Occup Environ Health. 2002;75:348–353. doi: 10.1007/s00420-002-0320-x. [DOI] [PubMed] [Google Scholar]
- 61.Rojas-Martinez R, Perez-Padilla R, Olaiz-Fernandez G, Mendoza-Alvarado L, Moreno-Macias H, Fortoul T, McDonnell W, Loomis D, Romieu I. Lung function growth in children with long-term exposure to air pollutants in Mexico City. Am J Respir Crit Care Med. 2007;176:377–384. doi: 10.1164/rccm.200510-1678OC. [DOI] [PubMed] [Google Scholar]
- 62.Gauderman WJ, Avol E, Gilliland F, Vora H, Thomas D, Berhane K, McConnell R, Kuenzli N, Lurmann F, Rappaport E, et al. The effect of air pollution on lung development from 10 to 18 years of age. N Engl J Med. 2004;351:1057–1067. doi: 10.1056/NEJMoa040610. [DOI] [PubMed] [Google Scholar]
- 63.Evans KA, Halterman JS, Hopke PK, Fagnano M, Rich DQ. Increased ultrafine particles and carbon monoxide concentrations are associated with asthma exacerbation among urban children. Environ Res. 2014;129:11–19. doi: 10.1016/j.envres.2013.12.001. [DOI] [PMC free article] [PubMed] [Google Scholar]
- 64.Gilliland FD, Berhane K, Rappaport EB, Thomas DC, Avol E, Gauderman WJ, London SJ, Margolis HG, McConnell R, Islam KT, et al. The effects of ambient air pollution on school absenteeism due to respiratory illnesses. Epidemiology. 2001;12:43–54. doi: 10.1097/00001648-200101000-00009. [DOI] [PubMed] [Google Scholar]
- 65.Park H, Lee B, Ha EH, Lee JT, Kim H, Hong YC. Association of air pollution with school absenteeism due to illness. Arch Pediatr Adolesc Med. 2002;156:1235–1239. doi: 10.1001/archpedi.156.12.1235. [DOI] [PubMed] [Google Scholar]
- 66.Avol EL, Gauderman WJ, Tan SM, London SJ, Peters JM. Respiratory effects of relocating to areas of differing air pollution levels. Am J Respir Crit Care Med. 2001;164:2067–2072. doi: 10.1164/ajrccm.164.11.2102005. [DOI] [PubMed] [Google Scholar]
- 67.Wang X, Wypij D, Gold DR, Speizer FE, Ware JH, Ferris BG, Jr, Dockery DW. A longitudinal study of the effects of parental smoking on pulmonary function in children 6-18 years. Am J Respir Crit Care Med. 1994;149:1420–1425. doi: 10.1164/ajrccm.149.6.8004293. [DOI] [PubMed] [Google Scholar]