

Abstract
Rationale: A high proportion of influenza infections are asymptomatic. Animal and human challenge studies and observational studies suggest T cells protect against disease among those infected, but the impact of T-cell immunity at the population level is unknown.
Objectives: To investigate whether naturally preexisting T-cell responses targeting highly conserved internal influenza proteins could provide cross-protective immunity against pandemic and seasonal influenza.
Methods: We quantified influenza A(H3N2) virus–specific T cells in a population cohort during seasonal and pandemic periods between 2006 and 2010. Follow-up included paired serology, symptom reporting, and polymerase chain reaction (PCR) investigation of symptomatic cases.
Measurements and Main Results: A total of 1,414 unvaccinated individuals had baseline T-cell measurements (1,703 participant observation sets). T-cell responses to A(H3N2) virus nucleoprotein (NP) dominated and strongly cross-reacted with A(H1N1)pdm09 NP (P < 0.001) in participants lacking antibody to A(H1N1)pdm09. Comparison of paired preseason and post-season sera (1,431 sets) showed 205 (14%) had evidence of infection based on fourfold influenza antibody titer rises. The presence of NP-specific T cells before exposure to virus correlated with less symptomatic, PCR-positive influenza A (overall adjusted odds ratio, 0.27; 95% confidence interval, 0.11–0.68; P = 0.005, during pandemic [P = 0.047] and seasonal [P = 0.049] periods). Protection was independent of baseline antibodies. Influenza-specific T-cell responses were detected in 43%, indicating a substantial population impact.
Conclusions: Naturally occurring cross-protective T-cell immunity protects against symptomatic PCR-confirmed disease in those with evidence of infection and helps to explain why many infections do not cause symptoms. Vaccines stimulating T cells may provide important cross-protective immunity.
Keywords: cellular immunity, T lymphocytes, cohort studies
At a Glance Commentary
Scientific Knowledge on the Subject
Evidence from previous studies has supported the hypothesis that T cells protect against influenza disease and virus shedding. However, the extent of naturally preexisting T-cell responses across the community and their protective effect against nasal viral shedding (which is the best measure of influenza infectiousness) in naturally acquired pandemic and seasonal infection has not been determined previously.
What This Study Adds to the Field
In those infected with seasonal or pandemic influenza A, commonly occurring cross-protective T cells targeting internal proteins have a major effect on population immunity by protecting against symptomatic polymerase chain reaction–confirmed disease. Vaccines stimulating T cells may provide important cross-protective immunity.
Our recent research shows influenza infects around 18% of unvaccinated individuals each year, but up to 75% of those infections are asymptomatic (1–3). The underlying immunologic correlates of asymptomatic infections are not well understood. Antibodies specific for hemagglutinin (H) and neuraminidase (N) protect against repeat infection (4), but these proteins are highly variable, enabling the virus to cause annual winter epidemics (5). Sporadically, a new pandemic virus emerges, with introduction of genes from animal reservoirs (6). Absence of preexisting antibody immunity during pandemics can cause more severe illness and high mortality rates (7). In 2009, a new pandemic A(H1N1) virus appeared with gene segments from avian, porcine, and human viruses (8). H1 and N1 proteins were sufficiently distant from previously circulating viruses to evade antibodies prevalent in the human population (8). Most infections were asymptomatic or minimally symptomatic (1) and mortality rates were considerably lower than feared (8, 9). However, the emergence of pathogenic avian influenza viruses, such as the A(H7N9) subtype, which has caused recent human deaths in China (10), remains a constant threat.
Although antibodies prevent infection, T-cell responses that target the highly conserved internal proteins of influenza A virus, such as nucleoprotein (NP) and matrix (M) protein, may prevent or modulate symptoms following influenza infection. CD8+ T cells cannot prevent initial infection, but they, and to some extent CD4+ T cells, mediate viral clearance after infection in mice (11–15). Experimental influenza A virus infection induces murine CD8+ T-cell responses that reduce the severity of subsequent infection with viruses of different H and N subtypes (11–13, 16, 17). Human challenge studies provided the first evidence that preexisting T cells protect against seasonal influenza disease; but generalizing findings from artificial infections has been difficult (18, 19).
A recent study reported preexisting T-cell protection against natural pandemic influenza disease in healthy adults among 25 participants infected with influenza (20). However, it is not clear whether such protection is important in the wider community, whether T cells provide protection against both pandemic and seasonal strains, and what the extent of protection is against polymerase chain reaction (PCR)–positive disease.
There is substantial interest in alternative vaccine strategies because cross-protection with conventional vaccines is minimal. Stimulation of T-cell responses targeting highly conserved internal proteins of influenza A virus offers the promise of both reducing morbidity and spread of virus shed from the upper respiratory tract (21, 22). Vaccines targeting the T-cell response are in development (23–25). A further, suitably powered demonstration of the population importance of T cell–mediated protection against seasonal and pandemic infection would help to justify future investments in trials of such vaccines. This study aimed to define the role of T cell–based immunity in protection against seasonal and pandemic influenza in the general population.
Methods
Cohort Design
The Flu Watch Study has been described previously (1). In brief, each autumn (2006–2009) general practices across England randomly selected individuals from general practice lists and invited their households to participate over the coming winter. Participants were asked weekly for symptoms of “cough, cold, sore throat or flu-like illness” and completed prospective daily symptom diaries throughout any illness. The Oxford MultiCentre Research Ethics Committee approved this study and participants gave written informed consent.
PCR Detection of Virus Shedding
Participants submitted, by mail, nasal swabs on Day 2 of any illness for reverse transcription PCR identification of influenza and other respiratory viruses (26, 27). Because qualitative real-time assays were used, we believed it was inappropriate to use Ct values to make quantitative inferences about viral shedding. Meaningful quantitative measurement would require samples to be taken in a highly standardized way, with close attention to time from symptom onset and rapid transfer to the laboratory. This was not possible because of the geographically dispersed community nature of this research, which relied on self-sampling and postal submission by participants.
Serology
Preseason and post-season sera were batch-tested for anti–influenza virus antibody using hemagglutination inhibition assays (see online supplement). Seroconversion was defined as a fourfold titer rise and considered indicative of infection occurring between baseline and follow-up samples. We excluded vaccinated participants because of the difficulty in interpreting fourfold titer rises in the context of vaccination.
T Cells
Ex vivo T-cell responses to overlapping peptides representing the whole proteome of influenza A(H3N2) virus, prevalent in 2006–2007 and 2008–2009, were measured by IFN-γ enzyme-linked immunospot (ELISPOT) assay (28) before each influenza season (see online supplement). The ELISPOT assay did not distinguish CD4 from CD8 T-cell responses. Therefore in stored samples from a random subset of unvaccinated individuals taken during the winter wave of the pandemic (n = 174), T cells were further cultured and CD4+ and CD8+ T-cell responses were then quantified by measuring intracellular IFN by flow cytometry (see online supplement) (29). Staff conducting serologic and virologic assays was masked to T-cell results and vice versa.
Statistical Analysis
We focused on the immunoprevalent, highly cross-reactive NP-specific T-cell responses and the dominant strain of influenza circulating in any given year. Linear regression models were used to investigate the relationship between log-transformed T-cell responses and serologic/symptom variables. We used Poisson regression models to explore the effect of NP response and other variables on rates of infection. Logistic regression models were built to test the primary hypothesis that preexisting T-cell responses to NP would protect against detectable viral shedding in individuals serologically infected with influenza. Robust standard errors accounted for correlation between repeated measurements in the same individual, and adjustments were made for potential confounders. Fisher's exact test was used to assess the protective effect of response separately for pandemic and seasonal influenza. Sensitivity analyses using the less specific respiratory illness outcome are reported in the online supplement. Estimates are presented with a 95% confidence interval (CI) and a P value (P < 0.05 was considered statistically significant). Analyses were performed in STATA 12 (StataCorp, College Station, TX).
There is no accepted threshold for quantifiable ex vivo influenza-specific T-cell responses. Therefore values of greater than or equal to 20 spot-forming units per million (SFU/M) peripheral blood mononuclear cells (PBMC) (above the 99th percentile of the negative control well distribution) were considered detectable if the original pooled test well result was also significantly higher than the pooled negative control well results (P < 0.05; negative binomial distribution).
Results
A total of 1,414 participants met inclusion criteria, some contributing to more than one season: 2006/2007 (n = 321), 2007/2008 (n = 404), 2008/2009 (n = 322), 2009/2010 (n = 656) giving 1,703 observation sets. Follow-up serology was available for 84% (1,431/1,703). Of these, 14% (205/1,431) were infected with the season’s dominant circulating influenza A strain (fourfold rise in specific antibody titer). Infected participants contributed 2,289 person-weeks follow-up with illness status reports returned for 1,877 (82%) weeks. Among those infected there were 143 illnesses reported with 112 (78%) submitting nasal swabs (see Table E1 in the online supplement).
Baseline influenza-specific T-cell responses to peptide pools spanning individual proteins in most participants were low (Figures 1A and 1B) but comparable with previous studies (18, 30). The median total A(H3N2) specific T-cell response after subtraction of background no-peptide control responses was 83 SFU/M PBMC. NP was the immunodominant antigen (median ex vivo NP T-cell response, 15 SFU/M PBMC). A total of 25% of the total T-cell response was specific for NP and 19% for M (Figure 1C summarizes variation in the proportion of the total response caused by each protein by individual). A total of 43% (730 of 1,703) of observations had a T-cell response to NP (≥20 SFU/M PBMC) compared with 35% for M (Figure 1D). NP T-cell responses were detectable in 45% (65 of 146), 53% (302 of 570), 40% (319 of 804), and 24% (44 of 183) of baseline ex vivo assays in children aged 5–15, young adults aged 16–44, older adults aged 45–64, and those aged 65 and over, respectively (chi-square test; P < 0.001).
Figure 1.
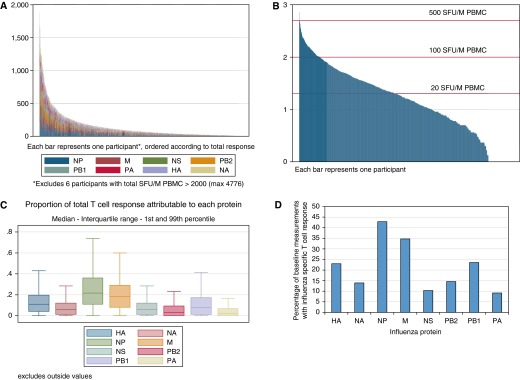
Preexisting ex vivo influenza-specific T-cell response. The preseason ex vivo frequency of influenza (H3N2)-specific T-cell responses from 1,703 baseline measurements from 1,414 Flu Watch participants were quantified by IFN-γ enzyme-linked immunospot assay. Some participants contributed to more than one season, but no participant had more than one baseline measurement per season. (A) Each column represents a different baseline sample. The height of each column represents the ex vivo frequency (spot-forming units per million [SFU/M] peripheral blood mononuclear cells [PBMC]) of H3N2-specific T-cell response; each color represents the T-cell responses targeted at each H3N2 viral antigen as indicated below the bar chart. (B) For the same samples as in A, the ex vivo nucleoprotein (NP)-specific T-cell responses (y-axis) are plotted on a log10 scale and ordered on the x-axis by the strength of the response. (C) For the total ex vivo T-cell responses in the whole study, the proportional contribution of each H3N2 viral antigen specificity is shown, indicating for instance that NP-specific T cells constitute 25% of the whole response. (D) Percentage of Flu Watch baseline samples that had ex vivo detectable memory T-cell responses. For each influenza protein response, we subtracted the negative control well result from the test well result and accepted values of greater than or equal to 20 SFU/M PBMC as reactors if the original result was also significantly higher than that of the negative control wells (P < 0.05 based on the negative binomial distribution). HA = hemagglutinin; M = matrix; NA = neuraminidase; NS = nonstructural; PA = polymerase A; PB1 = polymerase B1; PB2 = polymerase B2.
We found strong evidence (P < 0.001) of cross-reactivity between T-cell responses to H3N2 and A(H1N1)pdm09 (Figures 2A and 2B). Using a culture assay to expand antigen-specific T cells in the presence of peptide and IL-2, followed by peptide-stimulated cytokine expression and flow cytometry, we found that the contribution of CD8+ T cells was higher for the internal influenza proteins compared with H and N, and highest for NP (Figure 3). NP-specific ELISPOT responses ex vivo and cultured NP responses in vitro were strongly correlated (log-transformed regression coefficient, 0.86; 95% CI, 0.36–1.36; P < 0.001). This correlation held for influenza-specific CD8+ cells (1.65; 95% CI, 1.02–2.28; P < 0.001) but not for CD4+ cells (0.45; 95% CI, −0.16 to 1.06; P = 0.146) (see Figures E1A–E1C). There was no evidence that NP-specific T-cell responses differed at baseline between those vaccinated and unvaccinated in the last 2 years (age and baseline antibody adjusted odds ratio, 0.96; 95% CI, 0.71–1.28; P = 0.77).
Figure 2.

Preexisting influenza nucleoprotein (NP)- and matrix (M)-specific T cells cross-react to pandemic H1N1 2009 (H1N1pdm2009). The frequencies of T-cell responses to pandemic H1N1 2009 NP and M peptides were quantified ex vivo from Flu Watch participants (n = 222) who had no detectable antibody against pandemic H1N1 2009 HA at baseline. Each dot represents one Flu Watch participant. (A) The log10-transformed ex vivo frequency of H3N2 NP-specific T-cell response is shown on the x-axis, and the log10-transformed ex vivo frequency of the T cells targeted at pandemic H1N1 2009 NP is shown on the y-axis. The NP T-cell responses were quantified by IFN-γ enzyme-linked immunospot assay, and backgrounds were subtracted in the data presented in this figure. Linear regression line coefficient = 0.79 (95% confidence interval, 0.77–0.81); P < 0.001. (B) The equivalent for M responses. Linear regression line coefficient = 0.68 (95% confidence interval, 0.66–0.70); P < 0.0001. PBMC = peripheral blood mononuclear cells; SFU/M = spot-forming units per million.
Figure 3.

CD4 and CD8 phenotype of preexisting influenza-specific T cells. The preseason influenza (H3N2)-specific T-cell responses from 174 randomly selected Flu Watch participants were expanded by culture with peptide and IL-2, and the frequency of CD4+ and CD8+ influenza-specific T cells were measured by intracellular IFN-γ staining (y-axis). The height of each column indicates the percentage of all influenza-specific T cells (CD3+ IFN-γ+) responding to H3N2 virus peptides representing each protein. The gray and red indicate the relative CD4+ and CD8+ T-cell responses. HA = hemagglutinin; M = matrix; NA = neuraminidase; NP = nucleoprotein; NS = nonstructural; PA = polymerase A; PB1 = polymerase B1; PB2 = polymerase B2.
The primary outcome was nasal shedding of influenza virus as detected by PCR. The average incubation period (time between infection and symptom onset) is 48 hours and viral shedding generally peaks another 24 hours later (18). Viral shedding is associated with both disease severity and infectiousness (2, 31). The rate of serologically confirmed infections per 100 person-seasons was strongly inversely associated with baseline homotypic antibody titer but as expected was not affected by baseline NP-specific T-cell response (Table 1). Among those infected 35 of 205 (17.1%) shed detectable influenza virus from nasal swabs taken during illness (cough, cold, sore throat, or influenza-like illness) (Table 1). In univariate analysis the primary outcome was only associated with an NP-specific T-cell response and sex, with viral shedding lower in those with a response and in females. In the final adjusted model only a preexposure NP-specific T-cell response greater than or equal to 20 SFU/M PBMC was significantly associated with reduced odds of nasal viral shedding (adjusted odds ratio, 0.27; 95% CI, 0.11–0.68; P = 0.005). The protective effect was significant for seasonal influenza (9.9% [6 of 66] of those with a detectable NP response shed influenza virus vs. 21.7% [20 of 92] of those without; Fisher's exact test; P = 0.049). The protective effect was equally significant for pandemic influenza (0% [0 of 13] of those with NP response shed virus vs. 26.5% [9 of 34] of those without; P = 0.047).
Table 1.
Cohort Characteristics and Analysis of Risk Factors for Infection and PCR-confirmed Symptomatic Illness in those Infected
| Number with Paired Sera (Person-Seasons) | Number of Infections (Number Per 100 Person-Seasons)* | Unadjusted IRR (95% CI), P Value | Adjusted IRR (95% CI), P Value | Number (%) of Infections with PCR-Positive Influenza A* | Unadjusted OR (95% CI), P Value | Adjusted OR (95% CI), P Value | |
|---|---|---|---|---|---|---|---|
| NP SFU/M PBMC | |||||||
| NP <20 | 869 (762) | 126 (16) | 1 | 29 (23%) | 1 | 1 | |
| NP ≥20 | 630 (562) | 79 (14) | 0.94 (0.70–1.25), 0.659 | 6 (8%) | 0.26 (0.10–0.64), 0.003 | 0.27 (0.11–0.68), 0.005 | |
| Year | |||||||
| 2006 | 294 (289) | 51 (18) | 1 | 6 (12%) | 1 | ||
| 2007 | 351 (339) | 40 (12) | 0.63 (0.43–0.94), 0.024 | 0.65 (0.44–0.95), 0.03 | 8 (20%) | 1.5 (0.43–5.2), 0.52 | |
| 2008 | 285 (221) | 67 (30) | 1.35 (0.97–1,88), 0.073 | 1.45 (1.05–1.98), 0.023 | 12 (18%) | 1.0 (0.31–3.3), 0.97 | |
| 2009 | 569 (475) | 47 (9.9) | 0.46 (0.34–0.67), <0.001 | 0.44 (0.30–0.64), <0.001 | 9 (19%) | 1.3 (0.39–4.2), 0.69 | |
| Sex | |||||||
| Male | 692 (612) | 85 (14) | 0.86 (0.65–1.14), 0.303 | 19 (22%) | 2.3 (1.0–6.1), 0.04 | 1.9 (0.91–4.1), 0.09 | |
| Female | 807 (712) | 120 (17) | 1 | 16 (13%) | |||
| Age group | |||||||
| 5–15 | 105 (94) | 25 (27) | 1.76 (1.16–2.68), 0.008 | 2.56 (1.68–3.88), <0.001 | 2 (8%) | 1 | |
| 16–45 | 499 (440) | 77 (18) | 1 | 1 | 14 (19%) | 2.5 (0.58–11), 0.22 | |
| 45–64 | 734 (651) | 89 (14) | 0.77 (0.57–1.05), 0.107 | 0.74 (0.054–1.00), 0.05 | 19 (21%) | 2.9 (0.65–13), 0.16 | |
| 65+ | 161 (139) | 14 (10) | 0.50 (0.28–0.91), 0.022 | 0.70 (0.37–1.29), 0.253 | 0 (0%) | n/a | |
| Baseline titer | |||||||
| <16 | 1,170 (1,033) | 186 (18) | 1 | 1 | 34 (18%) | 1 | |
| 16–32 | 206 (183) | 18 (9.8) | 0.58 (0.35–0.96), 0.034 | 0.42 (0.25–0.70), 0.001 | 1 (6%) | 0.29 (0.04–2.0), 0.22 | |
| 64–128 | 89 (78) | 1 (1.3) | 0.06 (0.01–0.43), 0.005 | 0.04 (0.01–0.30), 0.002 | 0 | n/a | |
| >128 | 34 (29) | 0 (0.0) | n/a | n/a | n/a | n/a |
Definition of abbreviations: CI = confidence interval; IRR = incidence rate ratio; n/a = not applicable; NP = nucleoprotein; OR = odds ratio; PBMC = peripheral blood mononuclear cells; PCR = polymerase chain reaction; SFU/M = spot-forming units per million.
Refers to dominant influenza strain: H3N2 in 2006–2007 and 2008–2009; seasonal H1N1 in 2007–2008 and A(H1N1)pdm09 in 2009–2010. Each year, one strain of influenza A dominated: in 2006–2007, there were six PCR-positive cases of H3N2; in 2007–2008, there were nine PCR-positive cases of seasonal H1N1 and one of H3N2; in 2008–2009, there were 16 H3N2 and 2 seasonal H1N1; and in 2009–2010, there were 12 PCR-positive cases of A(H1N1)pdm09. PCR and serology results refer to the dominant influenza strain circulating each year.
Although the study is underpowered for further breakdown by seasonal influenza strain, the direction of effect was the same for both seasonal H1N1 and H3N2. For those infected with seasonal H1N1, 8 of 32 (25.0%) of those without a baseline T-cell response shed seasonal H1N1 virus compared with 1 of 24 (4.2%) of those with a baseline T-cell response (Fisher's exact test; P = 0.063). For those infected with H3N2, 12 of 78 (15.4%) of those without a detectable NP shed H3N2 virus versus 6 of 57 (10.5%) of those without a detectable NP response (Fisher's exact test; P = 0.454). Among those who shed virus we found no evidence of a positive or negative correlation between preexposure NP-specific T-cell responses (log-transformed SFU/million PBMC) and log-transformed symptom severity scores (correlation coefficient, 0.30; 95% CI, −0.19 to 0.79; P = 0.225).
In sensitivity analyses, using the less specific outcome of self-reported respiratory illnesses (cough, cold, sore throat, or influenza-like illness) in those with serologic evidence of infection (excluding illnesses known to be caused by other viruses and those occurring outside the period of influenza circulation), we found no significant protection associated with the baseline NP-specific T-cell response in the seasonal epidemics. However, in 34 participants infected with the pandemic strain who did not have a positive baseline NP-specific T-cell response, there were 33 illnesses. This contrasts with 4 illnesses among 13 participants infected with the pandemic strain who had a positive baseline ex vivo NP T-cell response (age and baseline antibody adjusted incidence rate ratio, 0.49; 95% CI, 0.25–0.96; P = 0.037).
Discussion
We show that preexisting cross-reactive T-cell responses to NP were independently associated with decreased odds of nasal viral shedding in those infected with seasonal or pandemic influenza. Although homotypic antibodies provide strong protection against infection, our work supports our primary hypothesis that, in those who become infected, baseline T cells provide heterotypic protection against the highly specific outcome of detectable viral shedding. T-cell responses at protective levels were present in 43% of participants and correlated with a reduced risk of shedding virus by around two-thirds, indicating an important population level effect.
This is the first large community cohort study of human T-cell immunity against influenza. The large study size allowed assessment of both confounders and interactions. It covered a cross-section of the population and spanned both seasonal and pandemic periods. Weekly follow-up minimized recall bias but was less intense than during human challenge studies likely leading to some under-ascertainment of influenza illnesses and viral shedding. PCR on self-submitted nasal swabs have been shown to have comparable sensitivity with samples taken by healthcare workers (32). Sensitivity analyses using the more sensitive but less specific outcome of respiratory illness show similar cross-protective immunity against illness in those infected with the 2009 pandemic strain, perhaps unsurprising given the virologic dominance of A(H1N1)pdm09 during 2009–2010 (1).
Because nasal swabbing was only requested from symptomatic individuals we are unable to determine whether T cells affected viral shedding in asymptomatic infection (33). We did not measure baseline innate immune responses, which by definition are not antigen-specific. Severe influenza involves hyperactivation of innate immune responses in the lungs, particularly of monocyte and macrophage populations (34). These responses are also involved in mild disease involving only the upper respiratory tract, particularly in children, but investigating this was beyond the scope of our study (35–37).
Participants had baseline influenza-specific memory T-cell responses at low levels, which is compatible with the known expansion and contraction of T cells following acute viral infection (18). Stringent criteria were applied to define a robust threshold (≥20 SFU/M PBMC) for detectable ELISPOT responses ex vivo. This cut-off is lower than that used in vaccine testing, but is statistically sound given the very low backgrounds in the assays and is appropriate because of the low level of baseline T-cell responses in the general population. The few very strong responses may have identified actively infected participants sampled during the early stages of the epidemic or pandemic, which was possible because the preseason bleeds were not completed before the influenza season had started. However, exclusion or inclusion of these donors in the sensitivity analyses did not affect conclusions.
The main previous evidence of T cell–based protection in naturally acquired influenza comes from a London-based cohort study over the 2009–2010 and 2001–2011 seasons of the pandemic. Healthy adults (n = 342; median age = 28) recruited at a University/Medical School were asked to report symptoms every 3 weeks and submit self-taken nasal swabs during illness. By contrast we report 1,703 participant observation sets from 1,414 general population participants across all age groups and including those with chronic illness followed up over periods of both pandemic and seasonal influenza. We used weekly symptom reporting and self-submission of nasal swabs to maximize ascertainment of influenza.
In the previous study the infected group (n = 43) was identified on the basis of fourfold antibody titer rises or positive PCR. The authors do not make it clear whether those who were vaccinated between baseline and follow-up bleeds were excluded (which would be expected to cause a fourfold titer rise). We exclude those in whom vaccination could have caused fourfold titer rises from our definition of infection. The previous study analyzes T-cell responses as a continuous variable, whereas we categorized our T-cell results into positive and negative responses as described previously. This was both because the highly skewed distribution of the responses meant it could not be readily transformed to meet assumptions of appropriate statistical tests and because we saw no evidence of a quantitative effect above this binary cut off.
Neither study found evidence of T-cell protection against infection. In the previous study infected patients who reported multiple illnesses during follow-up were excluded because it was not considered possible to identify which illness was caused by influenza, leaving 25 adults for study of the protective effect of T cells. We did not exclude such patients because our primary outcome was PCR-confirmed disease, which did not occur more than once during follow-up, and our secondary outcome was whether or not participants reported illness during follow-up. Thus our main analysis focuses on 205 infected patients.
In the previous study, when examining total preexisting cross-reactive total cytokine-secreting T cells to live pH1N1 virus in the 25 infected patients, they report higher baseline T-cell results among those who reported no fever (n = 12; P = 0.03), among those with completely asymptomatic infection (n = 3; P = 0.02), and among those with lower symptom scores (P = 0.05), but no difference in those who were PCR positive (n = 11). By contrast, we found no protective effect of total cell response to H3N2 influenza proteins against PCR-positive disease, symptoms, or symptom scores. In the previous study, when examining cellular responses to highly conserved CD8 epitopes from the immunodominant internal PB1 (polymerase B1), NP, and M1 proteins in these 25 patients, they reported higher baseline levels among those who reported no fever (n = 12; P = 0.02), no influenza-like illness (n = 15; P = 0.04), and those with lower symptom scores (P = 0.01). Finally, when examining IFN-γ+IL-2− T cells specific for conserved CD8 epitopes they found negative correlations with symptom scores (P = 0.004) and higher baseline levels in those who were PCR negative (P = 0.05).
By contrast, we focused analyses on the response to the immunodominant NP protein (where the response was shown to be dominated by CD8 cells). We found those with a positive response at baseline were less likely to shed virus (adjusted odds ratio, 0.27 [95% CI, 0.11–0.68; P = 0.005], during pandemic [P = 0.047], and seasonal periods [P = 0.049]), and during the pandemic were less likely to report symptoms. We found no association with total symptom scores (although we used lower weights for severe symptoms compared with the previous report).
Given the different population groups and methods used we consider both studies to provide consistent evidence that baseline cross-reactive CD8 T-cell responses to conserved internal proteins do not protect against infection with influenza but do protect against symptoms and PCR-positive disease in those infected with the pandemic strain. In addition we show protection against PCR-positive seasonal influenza. We also show that around 43% of the population has baseline T-cell responses associated with protection indicating a substantial role of T cells for protection at a population level (see Table E2 for a summary comparison of these two studies).
Influenza symptoms with fever appear around 48 hours after infection (18) and nasal swabs to detect virus shedding in the nose by PCR were taken from the second day of illness. Therefore, the T cells had at least 72 hours to act before the swab was taken. This time would allow accumulation of T cells at the site of infection in the upper respiratory tract and some expansion. Memory T cells can respond by releasing IFN-γ and other cytokines within 6 hours of antigen contact (38) and can expand up to 10,000-fold in 10 days, approximately one division every 20 hours (39).
Therefore, even low levels of functional memory T cells in the blood of 20 per million, which is equivalent to 105 in the whole blood volume, could provide enough T cells to migrate to the site of infection to clear virus quickly. The lower frequency of detectable nasal virus shedding in infected participants (proven by an antibody rise) with positive baseline NP-specific T-cell responses compared with those without this response suggests that T cells promote more effective control of infecting virus in the upper respiratory tract. There was a strong correlation between ex vivo NP-specific T-cell responses and cultured CD8+ T-cell responses to NP, but no such correlation with cultured CD4+ T-cell responses. Thus the NP-specific T-cell response, which was the most prevalent influenza protein-specific response and which showed an independent protective effect, comprised proportionately more CD8+ T cells than CD4+ T cells. Therefore, as also reported by others, NP-specific CD8+ T cells are likely to be important mediators of protection (20). However, we cannot exclude some additional protective effect of CD4 T cells, as shown in a previous small challenge study (19), just as that study could not exclude a role for CD8 T cells. Most likely both are involved.
We excluded vaccinated participants from the analysis, but found no evidence that T-cell responses at baseline were associated with recent vaccination. This is consistent with previous research that has shown that subunit vaccines fail to, or only weakly, stimulate CD8 T-cell responses (12, 40). At the time of the study the live attenuated influenza virus vaccine was not licensed in the United Kingdom and no volunteer had been given that vaccine. The relatively poor protection offered by that vaccine in adults could be related to preexisting T-cell immunity preventing virus take; this needs to be explored further in future studies.
Previous work, including animal models (11–13, 16, 41–44) and some studies in humans (18–20), suggests a potentially important role for T cell–based immunity to provide cross- protective immunity to influenza. However, this is the first study to show a significant strong effect for both seasonal and pandemic influenza viral shedding that is independent of baseline antibodies in a broadly based population sample.
Widespread adaptive heterotypic immunity provided by cross-reactive T cells along with innate immune responses could help to explain why many seasonal infections are asymptomatic and why this phenomenon was also common in the 2009 pandemic, despite antibody-based immunity being very low in the population at the outset (45). These results suggest that vaccine induction of CD8+ and/or CD4+ T cells specific for NP could offer partial protection by reducing virus shedding resulting in clearance of infection, reduced respiratory symptoms, and possibly reduced influenza transmission. This could be useful during the first 6 months of a pandemic before a conventional vaccine becomes available. This could also be of benefit in years when vaccine is poorly matched to circulating influenza strains, as happened in the 2014–2015 influenza season (46).
There have been concerns that overstimulation of T-cell responses could increase risk of postinfection immunopathology (47, 48). The absence of a positive correlation between NP concentration and symptom severity in those who do become ill is therefore reassuring. Also, the experimental virus vectored vaccines currently being tested are unlikely to give very high levels of T-cell responses in humans once the initial post-vaccination peak is over reducing any risk (49). Therefore this demonstration that quite modest levels of NP-specific T cells in the blood correlate with protection, at least for the relatively weakly virulent viruses of recent years, is encouraging.
Acknowledgments
Acknowledgment
The authors thank Dr. Yan Zhao, Dr. Dayan Wang, Dr. Shiwu Ma, Dr. Mingxia Zhang, Dr. Weihua Li, Dr. Xin Zhang, Dr. Qiongyu Chen, Dr. Sarah Bangs, Mr. Arjun Krishnakumar, Mr. Micheal Pan, Dr. Tao Dong, Dr. Chris Li, Dr. Demin Li, Ms. Christy Kam, Mr. James Heather, Dr. Chih-Hao Lucas Chang, Mrs. Yanchun Peng, and Ms. Amina Dawoodji for support with T-cell assays.
Members of the Flu Watch Group consist of all those who have played a substantive role in study design and/or data collection, analysis, and interpretation: A. Bermingham and M. Zambon, Respiratory Virus Unit, Centre for Infections, Public Health England, Colindale, United Kingdom; M. Cooke, A. Copas, G. Harvey, A. M. Johnson, J. Kovar, M. Lim, D. Mazo (visiting scientist), E. R. C. Millett, R. Pebody, and J. M. Watson, Research Department of Infection and Population Health, University College London, London, United Kingdom; O. Dukes, E. Fragaszy, A. C. Hayward, and F. Wurie, Department of Infectious Disease Informatics, Farr Institute of Health Informatics Research, University College London, London, United Kingdom; J. Edmunds, E. Fragaszy, and E. R. C. Millett, Department of Infectious Disease Epidemiology, London School of Hygiene and Tropical Medicine, London, United Kingdom; N. Ferguson, MRC Centre for Outbreak Analysis and Modelling, Department of Infectious Disease Epidemiology, Imperial College London, London, United Kingdom; N. Goonetilleke, A. McMichael, and L. Wang, Weatherall Institute of Molecular Medicine, University of Oxford, Oxford, United Kingdom; N. Goonetilleke, Department of Microbiology and Immunology, University of North Carolina at Chapel Hill, Chapel Hill, North Carolina; L. Lettley, Medical Research Council General Practice Research Framework, London, United Kingdom; I. Nazareth, Department of Primary Care and Population Health, University College London, London, United Kingdom; J. S. Nguyen-Van-Tam, Health Protection and Influenza Research Group, Division of Epidemiology and Public Health, University of Nottingham, Nottingham, United Kingdom; R. Pebody, Respiratory Diseases Department, Public Health England, Colindale, United Kingdom; and J. M. Watson, Department of Health, London, United Kingdom.
Footnotes
Supported by awards establishing the Farr Institute of Health Informatics Research, London, from the Medical Research Council, in partnership with Arthritis Research UK, the British Heart Foundation, Cancer Research UK, the Economic and Social Research Council, the Engineering and Physical Sciences Research Council, the National Institute of Health Research, the National Institute for Social Care and Health Research (Welsh Assembly Government), the Chief Scientist Office (Scottish Government Health Directorates), and the Wellcome Trust (MR/K006584/1). O.D. is supported by a National Institute for Health Research Methods fellowship.
Author Contributions: A.C.H. developed the epidemiologic design for Flu Watch as a framework for assessing the hypothesis that T-cell responses protect against detectable nasal shedding in those infected with influenza with input from A.M.J. and A.J.M. L.W. developed the approach to conducting large scale enzyme-linked immunospot assays and led the T-cell laboratory analysis with support from A.J.M. and N.G. A.C.H. is the principal investigator of the Flu Watch study. He conceived the idea for and designed the original seasonal influenza study and the pandemic extension in discussion with A.M.J., J.M.W., and M.Z. A.B., A.J.M., J.S.N.-V.-T., I.N., J.M.W., A.M.J., and M.Z. were coapplicants on the seasonal and pandemic grants, members of the steering group, and contributors to study design. A.C. was a coapplicant for the pandemic extension and joined the steering group in 2009 contributing to design of the pandemic phase. L.W., N.G., E.B.F., and E.R.C.M. also contributed to study design. Data collection was done by L.W., E.B.F., E.R.C.M., and A.B. E.B.F. led the data management with contributions from E.R.C.M. and O.D. A.C.H. led the development of the analytical strategy with major contributions from A.J.M., A.M.J., L.W., and N.G., and contributions from E.B.F., A.B., A.C., E.R.C.M., I.N., J.S.N.-V.-T., J.M.W., and M.Z. L.W., A.J.M., and N.G. led the T-cell laboratory analyses. M.Z. and A.B. led the serologic and polymerase chain reaction laboratory analyses with contributions from L.W. A.B. tragically and unexpectedly died shortly before publication; her tireless work was central to the success of this study. A.C. was the statistical advisor for Flu Watch, with input from O.D. A.C.H. analyzed the data with contributions from L.W. All authors contributed to interpretation of findings. A.C.H. and A.J.M. wrote the manuscript with major contributions from L.W., N.G., A.M.J., E.B.F., and O.D. and input on drafts from all authors. Literature search was conducted by A.C.H., L.W., N.G., and A.J.M. Tables and figures were created by A.C.H. with input from L.W., N.G., A.J.M., E.B.F., and O.D.
This article has an online supplement, which is accessible from this issue's table of contents at www.atsjournals.org
Originally Published in Press as DOI: 10.1164/rccm.201411-1988OC on April 6, 2015
Author disclosures are available with the text of this article at www.atsjournals.org.
References
- 1.Hayward AC, Fragaszy EB, Bermingham A, Wang L, Copas A, Edmunds JW, Ferguson N, Goonetilleke N, Harvey G, Kovar J, et al. Comparative community burden and severity of seasonal and pandemic influenza: results of the Flu Watch cohort study. Lancet Respir Med. 2014;2:445–454. doi: 10.1016/S2213-2600(14)70034-7. [DOI] [PMC free article] [PubMed] [Google Scholar]
- 2.Carrat F, Vergu E, Ferguson NM, Lemaitre M, Cauchemez S, Leach S, Valleron AJ. Time lines of infection and disease in human influenza: a review of volunteer challenge studies. Am J Epidemiol. 2008;167:775–785. doi: 10.1093/aje/kwm375. [DOI] [PubMed] [Google Scholar]
- 3.Wang TE, Lin CY, King CC, Lee WC. Estimating pathogen-specific asymptomatic ratios. Epidemiology. 2010;21:726–728. doi: 10.1097/EDE.0b013e3181e94274. [DOI] [PubMed] [Google Scholar]
- 4.Hoyle L, Fairbrother RW. Isolation of the influenza virus and the relation of antibodies to infection and immunity: the Manchester influenza epidemic of 1937. BMJ. 1937;1:655–657. doi: 10.1136/bmj.1.3977.655. [DOI] [PMC free article] [PubMed] [Google Scholar]
- 5.Noble GR. Epidemiological and clinical aspects of influenza. In: Beare AS, editor. Basic and applied influenza research. Boca Raton, FL: CRC Press; 1982. pp. 11–50. [Google Scholar]
- 6.Salomon R, Webster RG. The influenza virus enigma. Cell. 2009;136:402–410. doi: 10.1016/j.cell.2009.01.029. [DOI] [PMC free article] [PubMed] [Google Scholar]
- 7.Belshe RB. The origins of pandemic influenza—lessons from the 1918 virus. N Engl J Med. 2005;353:2209–2211. doi: 10.1056/NEJMp058281. [DOI] [PubMed] [Google Scholar]
- 8.Dawood FS, Iuliano AD, Reed C, Meltzer MI, Shay DK, Cheng PY, Bandaranayake D, Breiman RF, Brooks WA, Buchy P, et al. Estimated global mortality associated with the first 12 months of 2009 pandemic influenza A H1N1 virus circulation: a modelling study. Lancet Infect Dis. 2012;12:687–695. doi: 10.1016/S1473-3099(12)70121-4. [DOI] [PubMed] [Google Scholar]
- 9.Hardelid P, Pebody R, Andrews N. Mortality caused by influenza and respiratory syncytial virus by age group in England and Wales 1999-2010. Influenza Other Respi Viruses. 2013;7:35–45. doi: 10.1111/j.1750-2659.2012.00345.x. [DOI] [PMC free article] [PubMed] [Google Scholar]
- 10.Horby P. H7N9 is a virus worth worrying about. Nature. 2013;496:399. doi: 10.1038/496399a. [DOI] [PubMed] [Google Scholar]
- 11.Lin YL, Askonas BA. Biological properties of an influenza A virus-specific killer T cell clone. Inhibition of virus replication in vivo and induction of delayed-type hypersensitivity reactions. J Exp Med. 1981;154:225–234. doi: 10.1084/jem.154.2.225. [DOI] [PMC free article] [PubMed] [Google Scholar]
- 12.Webster RG, Askonas BA. Cross-protection and cross-reactive cytotoxic T cells induced by influenza virus vaccines in mice. Eur J Immunol. 1980;10:396–401. doi: 10.1002/eji.1830100515. [DOI] [PubMed] [Google Scholar]
- 13.Lukacher AE, Braciale VL, Braciale TJ. In vivo effector function of influenza virus-specific cytotoxic T lymphocyte clones is highly specific. J Exp Med. 1984;160:814–826. doi: 10.1084/jem.160.3.814. [DOI] [PMC free article] [PubMed] [Google Scholar]
- 14.Eichelberger M, Allan W, Zijlstra M, Jaenisch R, Doherty PC. Clearance of influenza virus respiratory infection in mice lacking class I major histocompatibility complex-restricted CD8+ T cells. J Exp Med. 1991;174:875–880. doi: 10.1084/jem.174.4.875. [DOI] [PMC free article] [PubMed] [Google Scholar]
- 15.Sant AJ, McMichael A. Revealing the role of CD4(+) T cells in viral immunity. J Exp Med. 2012;209:1391–1395. doi: 10.1084/jem.20121517. [DOI] [PMC free article] [PubMed] [Google Scholar]
- 16.Epstein SL, Lo CY, Misplon JA, Bennink JR. Mechanism of protective immunity against influenza virus infection in mice without antibodies. J Immunol. 1998;160:322–327. [PubMed] [Google Scholar]
- 17.Kreijtz JH, Bodewes R, van Amerongen G, Kuiken T, Fouchier RA, Osterhaus AD, Rimmelzwaan GF. Primary influenza A virus infection induces cross-protective immunity against a lethal infection with a heterosubtypic virus strain in mice. Vaccine. 2007;25:612–620. doi: 10.1016/j.vaccine.2006.08.036. [DOI] [PubMed] [Google Scholar]
- 18.Wilkinson TM, Li CK, Chui CS, Huang AKY, Perkins M, Liebner JC, Lambkin-Williams R, Gilbert A, Oxford J, Nicholas B, et al. Preexisting influenza-specific CD4+ T cells correlate with disease protection against influenza challenge in humans. Nat Med. 2012;18:274–280. doi: 10.1038/nm.2612. [DOI] [PubMed] [Google Scholar]
- 19.McMichael AJ, Gotch FM, Noble GR, Beare PA. Cytotoxic T-cell immunity to influenza. N Engl J Med. 1983;309:13–17. doi: 10.1056/NEJM198307073090103. [DOI] [PubMed] [Google Scholar]
- 20.Sridhar S, Begom S, Bermingham A, Hoschler K, Adamson W, Carman W, Bean T, Barclay W, Deeks JJ, Lalvani A. Cellular immune correlates of protection against symptomatic pandemic influenza. Nat Med. 2013;19:1305–1312. doi: 10.1038/nm.3350. [DOI] [PubMed] [Google Scholar]
- 21.Zweerink HJ, Courtneidge SA, Skehel JJ, Crumpton MJ, Askonas BA. Cytotoxic T cells kill influenza virus infected cells but do not distinguish between serologically distinct type A viruses. Nature. 1977;267:354–356. doi: 10.1038/267354a0. [DOI] [PubMed] [Google Scholar]
- 22.Doherty PC, Kelso A. Toward a broadly protective influenza vaccine. J Clin Invest. 2008;118:3273–3275. doi: 10.1172/JCI37232. [DOI] [PMC free article] [PubMed] [Google Scholar]
- 23.Antrobus RD, Lillie PJ, Berthoud TK, Spencer AJ, McLaren JE, Ladell K, Lambe T, Milicic A, Price DA, Hill AV, et al. A T cell-inducing influenza vaccine for the elderly: safety and immunogenicity of MVA-NP+M1 in adults aged over 50 years. PLoS One. 2012;7:e48322. doi: 10.1371/journal.pone.0048322. [DOI] [PMC free article] [PubMed] [Google Scholar]
- 24.Berthoud TK, Hamill M, Lillie PJ, Hwenda L, Collins KA, Ewer KJ, Milicic A, Poyntz HC, Lambe T, Fletcher HA, et al. Potent CD8+ T-cell immunogenicity in humans of a novel heterosubtypic influenza A vaccine, MVA-NP+M1. Clin Infect Dis. 2011;52:1–7. doi: 10.1093/cid/ciq015. [DOI] [PMC free article] [PubMed] [Google Scholar]
- 25.Lillie PJ, Berthoud TK, Powell TJ, Lambe T, Mullarkey C, Spencer AJ, Hamill M, Peng Y, Blais ME, Duncan CJ, et al. Preliminary assessment of the efficacy of a T-cell-based influenza vaccine, MVA-NP+M1, in humans. Clin Infect Dis. 2012;55:19–25. doi: 10.1093/cid/cis327. [DOI] [PMC free article] [PubMed] [Google Scholar]
- 26.Ellis J, Iturriza M, Allen R, Bermingham A, Brown K, Gray J, Brown D. Evaluation of four real-time PCR assays for detection of influenza A(H1N1)v viruses. Euro Surveill. 2009;14:19230. doi: 10.2807/ese.14.22.19230-en. [DOI] [PubMed] [Google Scholar]
- 27.Stephenson I, Democratis J, Lackenby A, McNally T, Smith J, Pareek M, Ellis J, Bermingham A, Nicholson K, Zambon M. Neuraminidase inhibitor resistance after oseltamivir treatment of acute influenza A and B in children. Clin Infect Dis. 2009;48:389–396. doi: 10.1086/596311. [DOI] [PubMed] [Google Scholar]
- 28.Tan LC, Gudgeon N, Annels NE, Hansasuta P, O’Callaghan CA, Rowland-Jones S, McMichael AJ, Rickinson AB, Callan MF. A re-evaluation of the frequency of CD8+ T cells specific for EBV in healthy virus carriers. J Immunol. 1999;162:1827–1835. [PubMed] [Google Scholar]
- 29.Goonetilleke N, Moore S, Dally L, Winstone N, Cebere I, Mahmoud A, Pinheiro S, Gillespie G, Brown D, Loach V, et al. Induction of multifunctional human immunodeficiency virus type 1 (HIV-1)-specific T cells capable of proliferation in healthy subjects by using a prime-boost regimen of DNA- and modified vaccinia virus Ankara-vectored vaccines expressing HIV-1 Gag coupled to CD8+ T-cell epitopes. J Virol. 2006;80:4717–4728. doi: 10.1128/JVI.80.10.4717-4728.2006. [DOI] [PMC free article] [PubMed] [Google Scholar]
- 30.Lee LY, Ha LA, Simmons C, de Jong MD, Chau NV, Schumacher R, Peng YC, McMichael AJ, Farrar JJ, Smith GL, et al. Memory T cells established by seasonal human influenza A infection cross-react with avian influenza A (H5N1) in healthy individuals. J Clin Invest. 2008;118:3478–3490. doi: 10.1172/JCI32460. [DOI] [PMC free article] [PubMed] [Google Scholar]
- 31.Hall CB, Douglas RG, Jr, Geiman JM, Meagher MP. Viral shedding patterns of children with influenza B infection. J Infect Dis. 1979;140:610–613. doi: 10.1093/infdis/140.4.610. [DOI] [PubMed] [Google Scholar]
- 32.Dhiman N, Miller RM, Finley JL, Sztajnkrycer MD, Nestler DM, Boggust AJ, Jenkins SM, Smith TF, Wilson JW, Cockerill FR, III, et al. Effectiveness of patient-collected swabs for influenza testing. Mayo Clin Proc. 2012;87:548–554. doi: 10.1016/j.mayocp.2012.02.011. [DOI] [PMC free article] [PubMed] [Google Scholar]
- 33.Loeb M, Singh PK, Fox J, Russell ML, Pabbaraju K, Zarra D, Wong S, Neupane B, Singh P, Webby R, et al. Longitudinal study of influenza molecular viral shedding in Hutterite communities. J Infect Dis. 2012;206:1078–1084. doi: 10.1093/infdis/jis450. [DOI] [PubMed] [Google Scholar]
- 34.Cheung CY, Poon LL, Lau AS, Luk W, Lau YL, Shortridge KF, Gordon S, Guan Y, Peiris JS. Induction of proinflammatory cytokines in human macrophages by influenza A (H5N1) viruses: a mechanism for the unusual severity of human disease? Lancet. 2002;360:1831–1837. doi: 10.1016/s0140-6736(02)11772-7. [DOI] [PubMed] [Google Scholar]
- 35.Voudoukis E, Pappas A, Panoutsopoulos A, Xynos K, Rozi F, Giannakopoulou K, Paulaki M, Stofa E, Seretis C, Lagoudianakis E, et al. Novel influenza A (H1N1) infection vs. common influenza-like illness: a prospective study. Med Sci Monit. 2011;17:CR185–CR188. doi: 10.12659/MSM.881713. [DOI] [PMC free article] [PubMed] [Google Scholar]
- 36.Frisullo G, Iorio R, Plantone D, Nociti V, Patanella AK, Marti A, Palermo C, Valentini P, Mariotti P, Batocchi AP. Involvement of type I immune responses in swine-origin H1N1 influenza virus infection. Hum Immunol. 2011;72:632–635. doi: 10.1016/j.humimm.2011.04.006. [DOI] [PubMed] [Google Scholar]
- 37.Oshansky CM, Gartland AJ, Wong SS, Jeevan T, Wang D, Roddam PL, Caniza MA, Hertz T, Devincenzo JP, Webby RJ, et al. Mucosal immune responses predict clinical outcomes during influenza infection independently of age and viral load. Am J Respir Crit Care Med. 2014;189:449–462. doi: 10.1164/rccm.201309-1616OC. [DOI] [PMC free article] [PubMed] [Google Scholar]
- 38.Lalvani A, Brookes R, Hambleton S, Britton WJ, Hill AV, McMichael AJ. Rapid effector function in CD8+ memory T cells. J Exp Med. 1997;186:859–865. doi: 10.1084/jem.186.6.859. [DOI] [PMC free article] [PubMed] [Google Scholar]
- 39.Geiger R, Duhen T, Lanzavecchia A, Sallusto F. Human naive and memory CD4+ T cell repertoires specific for naturally processed antigens analyzed using libraries of amplified T cells. J Exp Med. 2009;206:1525–1534. doi: 10.1084/jem.20090504. [DOI] [PMC free article] [PubMed] [Google Scholar]
- 40.McMichael AJ, Gotch F, Cullen P, Askonas B, Webster RG. The human cytotoxic T cell response to influenza A vaccination. Clin Exp Immunol. 1981;43:276–284. [PMC free article] [PubMed] [Google Scholar]
- 41.Yap KL, Braciale TJ, Ada GL. Role of T-cell function in recovery from murine influenza infection. Cell Immunol. 1979;43:341–351. doi: 10.1016/0008-8749(79)90178-3. [DOI] [PubMed] [Google Scholar]
- 42.Guillonneau C, Mintern JD, Hubert FX, Hurt AC, Besra GS, Porcelli S, Barr IG, Doherty PC, Godfrey DI, Turner SJ. Combined NKT cell activation and influenza virus vaccination boosts memory CTL generation and protective immunity. Proc Natl Acad Sci USA. 2009;106:3330–3335. doi: 10.1073/pnas.0813309106. [DOI] [PMC free article] [PubMed] [Google Scholar]
- 43.Epstein SL, Stack A, Misplon JA, Lo CY, Mostowski H, Bennink J, Subbarao K. Vaccination with DNA encoding internal proteins of influenza virus does not require CD8(+) cytotoxic T lymphocytes: either CD4(+) or CD8(+) T cells can promote survival and recovery after challenge. Int Immunol. 2000;12:91–101. doi: 10.1093/intimm/12.1.91. [DOI] [PubMed] [Google Scholar]
- 44.Ewing C, Allan W, Daly K, Hou S, Cole GA, Doherty PC, Blackman MA. Virus-specific CD8+ T-cell responses in mice transgenic for a T-cell receptor beta chain selected at random. J Virol. 1994;68:3065–3070. doi: 10.1128/jvi.68.5.3065-3070.1994. [DOI] [PMC free article] [PubMed] [Google Scholar]
- 45.Hardelid P, Andrews NJ, Hoschler K, Stanford E, Baguelin M, Waight PA, Zambon M, Miller E. Assessment of baseline age-specific antibody prevalence and incidence of infection to novel influenza A/H1N1 2009. Health Technol Assess. 2010;14:115–192. doi: 10.3310/hta14550-03. [DOI] [PubMed] [Google Scholar]
- 46.Pebody RG, Warburton F, Ellis J, Andrews N, Thompson C, von Wissmann B, Green HK, Cottrell S, Johnston J, de Lusignan S, et al. Low effectiveness of seasonal influenza vaccine in preventing laboratory-confirmed influenza in primary care in the United Kingdom: 2014/15 mid-season results. Euro Surveill. 2015;20:21025. [PubMed] [Google Scholar]
- 47.Heinen PP, Rijsewijk FA, de Boer-Luijtze EA, Bianchi AT. Vaccination of pigs with a DNA construct expressing an influenza virus M2-nucleoprotein fusion protein exacerbates disease after challenge with influenza A virus. J Gen Virol. 2002;83:1851–1859. doi: 10.1099/0022-1317-83-8-1851. [DOI] [PubMed] [Google Scholar]
- 48.Xu L, Yoon H, Zhao MQ, Liu J, Ramana CV, Enelow RI. Cutting edge: pulmonary immunopathology mediated by antigen-specific expression of TNF-alpha by antiviral CD8+ T cells. J Immunol. 2004;173:721–725. doi: 10.4049/jimmunol.173.2.721. [DOI] [PubMed] [Google Scholar]
- 49.Powell TJ, Peng Y, Berthoud TK, Blais ME, Lillie PJ, Hill AVS, Rowland-Jones SL, McMichael AJ, Gilbert SC, Dong T. Examination of influenza specific T cell responses after influenza virus challenge in individuals vaccinated with MVA-NP+M1 vaccine. PLoS ONE. 2013;8:e62778. doi: 10.1371/journal.pone.0062778. [DOI] [PMC free article] [PubMed] [Google Scholar]