

Abstract
The HyperCyt® high-throughput (HT) flow cytometry sampling platform uses a peristaltic pump in combination with an autosampler and a novel approach to data collection to circumvent time delay bottlenecks of conventional flow cytometry. This approach also dramatically reduces the amount of sample aspirated for each analysis, typically requiring ~2 μl per sample while making quantitative fluorescence measurements of 40 or more samples per min with thousands to tens of thousands of cells in each sample. Here, we describe a simple robust screening assay that exploits the high-content measurement capabilities of the flow cytometer to simultaneously probe the binding of test compounds to two different receptors in a common assay volume, a duplex assay format. The ability of the flow cytometer to distinguish cell-bound from free fluorophore is also exploited to eliminate wash steps during assay setup. HT flow cytometry with this assay has allowed efficient screening of tens-of-thousands of small molecules from the NIH Small Molecule Repository to identify selective ligands for two related G-protein-coupled receptors, the formylpeptide receptor and formylpeptide receptor-like 1.
Keywords: flow cytometry, high content, high-throughput screening, fluorescence, formylpeptide receptor, formylpeptide receptor-like 1, NIH Molecular Libraries Screening Network
1. Introduction
Because of its facility for making high content measurements, flow cytometry has played an accessory role in many phases of drug discovery in pharma and many biotech companies. Historically, it has been severely limited in throughput rates for the serial analysis of multiple discrete cell suspensions, with maximum speeds approaching only 6 samples per minute in the most advanced commercial system available at this writing. One feature of conventional flow cytometry that hampers throughput is the one-sample-one-file paradigm, the practice of creating a separate data file for each cell suspension analyzed. Repetitive time delays are incurred for each sample that include one at the onset while hardware and software are initialized for data collection, and another at the end while data are saved to a file on a hard disk or other storage destination. A second rate-limiting feature is a consequence of the traditional cell sample processing loop. The entire sample uptake/transport pathway is first rinsed with fluid to flush away the previous sample, then the new sample suspension must be transported all the way from the source well to the point of analysis before the next data acquisition sequence can be started.
A recently developed high-throughput (HT) flow cytometry sampling platform, designated HyperCyt® (1) addresses these limitations. In contrast to the traditional sample handling paradigm, the HyperCyt® HT flow cytometry approach is to fill the sample uptake/transport line with a stream of discrete sample particle suspensions, each typically a ~2 μl volume aspirated from one of the source wells and separated one from the other by air bubbles. The entire sample stream is continuously delivered to the flow cytometer so that data from all the samples in a plate are acquired and stored in a single data file. A high resolution time parameter is also recorded during data acquisition. Temporal gaps in particle detection are created in the data stream by the passage of the air bubbles, allowing the individual particle suspensions to be easily distinguished and separately evaluated when plotted in conjunction with the time parameter. This approach not only eliminates the time lags associated with multiple rounds of initialization, data storage and sample line filling, but also dramatically reduces the amount of sample aspirated for each analysis. Sampling rates in excess of 1 sample/sec have been successfully demonstrated for endpoint assays, but a rate of ~40 samples/min is more routinely used as the most practical for producing robust assay analysis results. It is possible to make quantitative fluorescence measurements of thousands to tens of thousands of cells in each sample under such conditions of serial sample throughput (2–5).
Described herein is a simple robust assay that detects active compounds on the basis of their ability to block the binding of a high affinity fluorescent ligand to cellular receptors (3–5). In negative control wells or in wells containing inactive compounds, cells exhibit bright green fluorescence due to the bound fluorescent ligand. Compounds with receptor-binding activity promote displacement of fluorescent ligand from the receptor, causing a decrease in green cell fluorescence intensity. Since ligand binding is measured directly, the assay detects active compounds independently of potential complexities in the patterns of the physiological responses of cells. For example, it should detect molecules regardless of whether they act as agonists or antagonists or mediate full, partial or selective (e.g., signaling pathway specific) activity. This is an advantage over HT functional response assays (e.g., intracellular Ca2+ flux) that are typically designed to exclusively detect agonists or antagonists and less sensitive for detecting compounds with selective or partial response activity. The assay is homogeneous in that cells, compounds and fluorescent peptide are added in sequence and the wells subsequently analyzed without intervening wash steps. Elimination of wash steps is feasible because of the ability of the flow cytometer to distinguish cell-bound and free fluorophore at free fluorophore concentrations of up to several hundred nM.
The specific assay described here exploits the high-content measurement capabilities of the flow cytometer to simultaneously probe two different receptors in a common assay volume, a duplex assay format. Cells expressing different receptors are color coded to allow their distinction in a red fluorescence detection channel during the analysis. The ligand binding response is recorded in a separate green fluorescence detection channel. An important advantage of the duplex approach, and of higher levels of assay multiplexing compatible with flow cytometry, is the ability to obtain both activity and selectivity information as an integral part of a primary screen. This assay is performed in 384-well plates, afacilitated by the unique capability of HT flow cytometry with the HyperCyt® platform. In addition, this assay detects ligands to two related G-protein-coupled receptors (GPCR), the formylpeptide receptor (FPR) and formylpeptide receptor-like 1 (FPRL1) (6). The FPR, a prototypic GPCR in the chemoattractant receptor superfamily, has been implicated in mediating inflammatory responses of clinical significance (7, 8). FPRL1 is a related GPCR that shares 69% identity at the amino acid level with FPR (9, 10). Although even micromolar levels of potent FPR agonists such as the N-formyl peptide fMLF only weakly activate FPRL1 (11), a number of host-derived FPRL1 peptide agonists have been identified in chronic inflammation-associated diseases such as systemic amyloidosis (12), Alzheimer’s disease (13, 14), and prion diseases (15, 16). This assay has been used at the New Mexico Molecular Libraries Screening Center to screen more than 25,000 compounds from the NIH Small Molecule Repository to identify selective ligands for each of the receptors (see NMMLSC assays at http://pubchem.ncbi.nlm.nih.gov/).
2. Materials
-
1
Tissue culture medium (TCM): RPMI-1640 medium (Mediatech MT-10-040-CVMP) supplemented with 10% fetal bovine serum (US Biotechnologies FBU 3195, heat-inactivated 30 min, 54°C), 2mM L-glutamine-10U/ml penicillin-10 μg/ml streptomycin (Mediatech MT-30-009-CI), 10 mM HEPES (Mediatech MT-25-060-CI), 4 μg/ml CIPRO (Bayer Pharmaceuticals). This may be stored at 4°C for up to 3 weeks. TCM is supplemented with 2.5 μg/ml Amphotericin B (CellGro #30-003-CF) for culture of transfected RBL-2H3 cells.
-
2
A solution of 0.25% Trypsin, 1mM EDTA (InVitrogen #25200-056) is used for passaging and preparation of RBL-2H3 cells.
-
3
N-formyl-methionine-leucine-phenylalanine-phenylalanine peptide (fMLFF) (Sigma, F2009) is a peptide that selectively binds FPR.
-
4
Tryptophan-lysine-tyrosine-methionine-valine-D-methionine (Wpep) is a hexapeptide reported to bind with high affinity to both FPRL1 and FPR, but with a Kd < 1 nM for FPRL1 (17, 18) as compared to 95 nM for FPR (17).
-
5
Fluorescein isothiocyanate-labeled Wpep (Wpep-FITC) (Bachem, special synthesis) is used to quantify free FPR and FPRL1 receptors. (see Note 1).
-
6
Peptide dilution buffer (PDB): 110 mM NaCl (SIGMA S-9625), 30 mM HEPES, 10 mM KCl (SIGMA P-3911), 1mM MgCl2 (SIGMA M-8266), 10 mM glucose (SIGMA G-7528), and 0.1% bovine serum albumin (SIGMA A-3059). This solution is prepared fresh weekly and stored at 4°C.
-
7
Peptide solutions: Peptides are stored as 1 mM or 100 μM aliquots in 100% DMSO (Omnisolv Methylsulfoxide, EMD Chemicals #MX1456-6) at −20°C. On each day of assay, aliquots are freshly thawed, diluted in PDB and used immediately. The following solutions are adequate for preparation of 4 assay plates:
-
7a
Wpep-FITC: 4.5 μl of 100 μM Wpep-FITC in 15 ml cold PDB (15 nM Wpep-FITC)
-
7b
Blocking Control Solution: 20 μl of 100 μM Wpep + 3.6 μl of 1 mM fMLFF + 176 μl DMSO in 10ml PDB (360 nM fMLFF/200 nM Wpep/2% v/v DMSO),
-
8
FuraRed staining solution: Add 46 μl DMSO to each of 2 × 50 μg Fura Red™, AM (InVitrogen #F-3021, special packaging) for a 1 mM stock solution.
-
9
Cell Strainer: a receptacle with a 70 μM nylon mesh filter (BD Falcon # 352350) that is used to remove clumped cells from cell suspensions
-
10
Compound dilution plate: a polypropylene 384-well plate with conical-bottom wells (Greiner #781280) that is used for diluting compounds prior to addition to the assay sample.
-
11
Assay plate: a polystyrene 384-well plate with flat bottom, small volume wells (Greiner #784101) in which ligand binding assays are performed.
-
12
ThermalSeal Sealing Film adhesive plate well covers (Excel Scientific #100THERPLT) are used to cover assay plate wells during incubations.
-
13
Contrad70 (Fisher 04355), is diluted with water to 2.5% (v/v) for cleaning of microfluidics tubing.
-
14
Test compounds are obtained from a variety of sources and stored at −25°C in DMSO. Source 384-well plates for use in assays contain 1mM compound and are sealed with Seal and Sample aluminum foil adhesive plate well covers (Beckman Coulter #538619).
3. Methods
3A. Preparation of Cells
Cells are passaged twice weekly in T175 plastic tissue culture flasks. Cell density should be no less than 6 × 10⁵ cells/ml after the split. Cells expressing 100,000 to 250,000 receptors per cell are used in assays (see Note 2).
RBL/FPRL1, RBL-2H3 cells expressing human FPRL1, are grown as adherent cell cultures in TCM supplemented with 2.5 μg/ml Amphotericin B. Cells may be grown beyond confluence prior to harvesting as long as fresh TCM is added to maintain neutral pH. Use 3 × T175 flasks/per 4 assay plates of RBL/FPRL1. Rinse each flask with 25 ml of sterile PBS, add 10 ml 0.25% Trypsin-EDTA and incubate at 37° C until cells are detached. Pool cells in 40 ml TCM, centrifuge 10 min at 450×g, resuspend at 4 × 10⁶/ml in PDB and store on ice.
U937/FPR, U937 cells expressing human FPR, are grown as 100 ml suspensions in TCM and color coded with Fura Red for use in assays. Use 1 × T175 flasks of U937/FPR cells per 4 assay plates. Cell density should not exceed 106/ml at the time of harvest. Centrifuge cells 10 min at 450×g. Resuspend cells in PDB at 8 × 10⁶ cells/15 ml of TCM. Add 90 μl Fura Red, AM solution per 15 ml cells and incubate 15 min at 37°C. Wash loaded cells twice by centrifugation in PDB (15 ml per wash). Resuspend the cell pellet in the RBL/FPRL1 cell suspension so that U937/FPR cells are also brought to a concentration of 4 × 10⁶/ml. Store the cell mixture on ice.
Just prior to dispensing into the assay plate, the cell mixture is passed through a Cell Strainer to remove cell clumps.
3B. Setup of 384-Well Dilution and Assay Plates
These instructions assume the use of automated pipetting robots and a liquid dispensing instrument. A Biomek NX Multichannel pipetting robot (Beckman Coulter) equipped with a 384-P20 pod is used for plate-to-plate liquid transfers (steps 3 and 4). A Biomek NX Span-8 pipetting robot (Beckman Coulter) is used for addition of control reagents to plates (steps 5 and 6). A MAP-C2 liquid dispensing instrument (TiterTek) is used for dispensing cells and reagents into microplate wells (steps 2, 7 and 9). Other comparable instruments capable of accurately pipetting 1 to 5 μl fluid volumes and dispensing 5 μl fluid volumes should also be suitable. Manual pipetting with multichannel pipets is also feasible. However, for this assay configuration it is not recommended due to time constraints on some of the assay steps that will be difficult to satisfy.
Remove the 384-well plates containing test compounds from the freezer and allow them to warm to room temperature before removing the adhesive aluminum foil lid (see Note 3).
Dispense 49 μl ice cold PDB to wells in columns 3–22 of a 384-well compound dilution plate.
Pipet 1 μl of test compounds from a compound storage plate to the matching, PDB-containing wells in columns 3–22 of the dilution plate.
Pipet 5 μl of test compounds from the dilution plate into the corresponding wells of a separate 384-well assay plate (columns 3–22). Use 3 aspirate/dispense pipetting cycles to mix the test compounds in the dilution plate wells before transfer.
Pipet 5 μl peptide blocking control solution into positive control wells (columns 2 and 23).
Pipet 5 μl PDB/2% V/V DMSO into negative control wells (columns 1 and 24).
Into each well dispense 5 μl of a cell mixture containing 50,000 of each cell type. The cell mixture contains U937/FPR (pre-labeled with Fura-Red) and RBL/FPRL1 cells, each at 4 × 10⁶ cells/ml, and is chilled on ice prior to addition (see Note 4).
Seal the plate wells with ThermalSeal Film and incubate the assay plate at 4°C for 30 min, periodically inverting the plate to maintain cells in suspension (see Note 5).
Remove the sealing film and dispense 5 μl Wpep-FITC solution into each well (see Note 4).
Reseal the plate wells with ThermalSeal Film and incubate the plate at 4°C for 30 min or more while rotating.
Move the plates one at a time from the rotator to the deck of the HyperCyt® autosampler. Wait until sampling of one plate is completed before moving the next to the deck.
3C. Setup of the HyperCyt® platform and Flow Cytometer
These instructions assume the use of a HyperCyt® platform with a Dako CyAn flow cytometer. The HyperCyt® platform has been successfully used with several other flow cytometers, but as of this writing only the CyAn has been validated for uninterrupted analysis of 384-well plate assays. A critical flow cytometer feature is the availability of a high-resolution time parameter (data binning at intervals of 100 ms or less) that can be collected continuously for 10 or more min during data acquisition (see Note 6). The HyperCyt® platform must be properly configured and calibrated on a daily basis before use.
Align the HyperCyt® sampling probe to the four corner wells of a 384-well assay plate. The autosampler controlling software, HyperSip, has a programmed function to assist the user in this operation. First the probe is moved to Well A1 at which is defined the X–Y axis location corresponding to the center of the well and two Z-axis height locations corresponding to the bottom of the well and the height above the plate at which the probe will travel between wells. The probe is then moved to the other corner wells (A24, P24, and P1) in sequence to define their X–Y axis locations. Alignment once a day is typically sufficient and requires ~5 min.
If necessary, connect the HyperCyt® fluidics tubing to the sample uptake pathway of the flow cytometer (see Note 6). This requires < 1 min.
Clamp the fluidics tubing in the peristaltic pump.
Move the sampling probe to the rinse station and turn on the peristaltic pump (15 rpm).
The sampling probe is repeatedly moved up and down, in and out of the rinse station solution (PDB), to generate a moving stream of discrete fluid volumes (~ 1 inch in length) separated by air bubbles.
Adjust the peristaltic pump clamping pressure. When adjusted properly there should be uniform air bubbles on both sides of the pump. If the bubbles are broken up on the flow cytometer side of the pump, the clamp has probably been tightened too much. Finding just the right tension will sometimes take a bit of time and patience (~5–10 min or less for the experienced operator). Once set, clamping pressure typically remains stable over the course of several days without requiring operator intervention.
Prior to the first sampling run and between subsequent runs the sampling probe is moved to the rinse station while the peristaltic pump continues to run. The 0.1% BSA in the PDB is an important surfactant that helps flush particles from the sample line. The presence of at least 0.1% BSA (or some other equivalent protein) in all solutions helps minimize particle carryover. It is also good practice to run detergent (2.5% v/v Contrad70) followed by distilled water through the fluidics tubing at the beginning and end of each day.
Use the “Plate Setup” feature of HyperSip software to create a worklist that controls the pattern with which wells will be sampled. Sample identifying information for each well may also be included in the worklist for post-analysis annotation of flow cytometry data. Worklists may be created in advance and automatically loaded just prior to assay plate sampling.
A pre-configured flow cytometry software protocol is loaded into the flow cytometer that defines the lasers and optical detectors to be used, the sensitivity settings for each detector and graphical plots to be displayed during data acquisition. Quantitative analysis of the present assay requires acquisition of green and red fluorescence emission wavelength bands (FL1, 530±20 nm and FL4, 630±15 nm, respectively), two light scatter signals (FS, forward scatter and SS, side scatter), and a high resolution time parameter (data binned at intervals of 100 ms or less). All optical signals are excited by a single laser line of 488 nm wavelength.
3D. Sampling and Data Acquisition
Position an assay plate on the HyperCyt® autosampler deck.
Initiate HyperCyt® sampling and flow cytometer data acquisition.
The sampling probe moves from well to well, sampling from each and moving to the next without an intervening probe wash step. The probe is programmed to remain in each well aspirating sample for 900 ms and in the air between wells aspirating air bubbles for 400 ms. The peristaltic pump that mediates liquid transfer runs continuously during sampling of the entire plate (see Note 7).
The flow cytometer continuously acquires data during sampling of the entire plate and for about 40 s thereafter. This allows time for the last sample to transit the length of the sampling tube from the plate to the point of analysis. During this interval the sampling probe is at the rinse station moving up and down while the peristaltic pump continues to run (see Note 8).
At the end of data acquisition, the single data file is saved in flow cytometry standard (FCS) 3.0 format. The total time required for sampling, data acquisition and data file storage is typically 11–12 min.
3E. Analysis of Flow Cytometry data
The flow cytometry data file is loaded into IDLeQuery analysis software.
Four graphical plots of the data are created: i) FL1 vs. FL4, ii) FS vs. SS, iii) FS vs. FL4, and iv) Time vs. Number of Events.
The fluorescence compensation control is used to correct the green fluorescence signal of Wpep-FITC for the small fraction of cell-associated Fura Red fluorescence that is picked up by the FL1 detector. The FL1 vs. FL4 plot is used to evaluate compensation. Compensation is correct when the two cell populations are aligned one atop the other and the leftmost tail of the U937/FPR population distribution is extended to a similar extent as in the RBL/FPRL1 population (Fig 1B) (see Note 9).
In the FS vs. SS plot, an electronic gate (gate 1) is constructed to exclude dead cells and debris from the analysis (Fig 2A).
In the FS vs. FL4 plot, two electronic gates are constructed, one about the bright red fluorescent U937/FPR cell population (gate 2) and the other about the dim red fluorescent RBL/FPRL1 cell population (gate 3) (Fig 2B).
The Time vs. Number of Events plot is displayed in the specialized Time Bins Analysis window (Fig. 3). Each peak in the plot corresponds to cells sampled from a separate well. The “AutoBins” software function is invoked to enclose each of the 384 peaks in separate analysis rectangles or bins (Fig 3B). The worklist created earlier with the HyperSip “Plate Setup” function is imported using the IDLeQuery “Import Well ID” function to provide appropriate labels for each bin and to annotate the contents of the corresponding wells (see Note 10).
The Stats Control Window is used to display the number of cells and the median green fluorescence intensities calculated for each of the two cell populations in each well, along with the imported well identification and annotation data.
Export the fluorescence intensity data to a Microsoft Excel spread sheet template that automatically performs the calculations required to quantify test compound effects on Wpep-FITC ligand binding to the two receptors.
- Calculate the assay response as the inhibition of fluorescent ligand binding mediated by the test compound:
in which MfiTest, MfiPCAVG and MfiNCAVG represent the median fluorescence intensities (MFI) in individual wells containing test compounds, average MFI in positive control wells and average MFI in negative control wells, respectively. - Calculate the Z’ factor, a measure of screening assay quality that reflects both assay signal dynamic range and data variation associated with the signal measurements (19).
in which MfiNCSD and MfiPCSD represent the standard deviation of MFI in negative and positive control wells, respectively. Z′ factor values typically average ~0.65 for this assay and values of 0.4 or more are considered to indicate acceptable assay quality.
Figure 1.
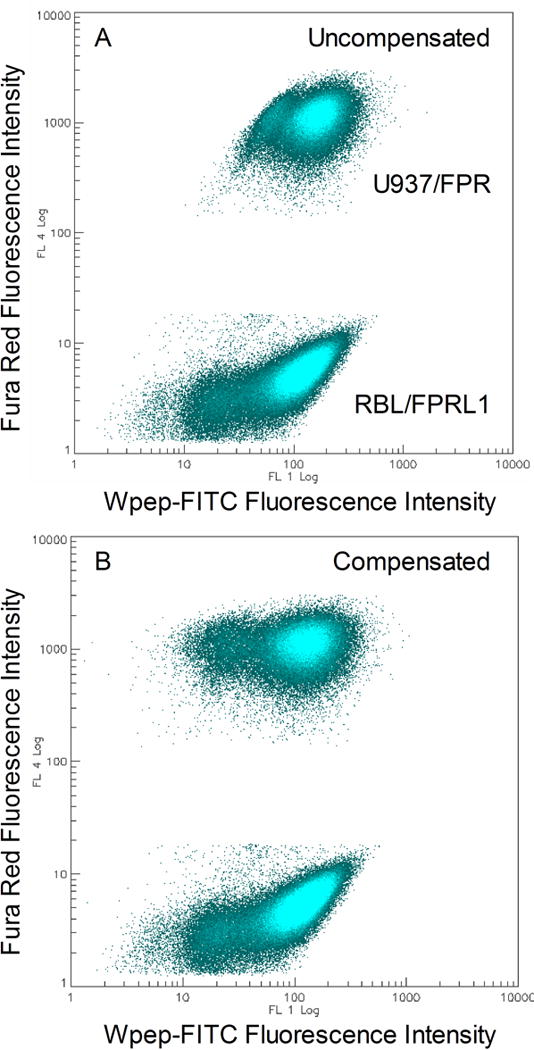
Fluorescence compensation to correct for red fluorescence spillover into the green fluorescence detection channel. A. Uncompensated fluorescence data. B. Fluorescence profile after compensation. Approximately 3% of the signal detected in the red FL4 channel for each event was subtracted from the corresponding signal detected in the green FL1 channel. The plots represent combined data from all 384 wells.
Figure 2.
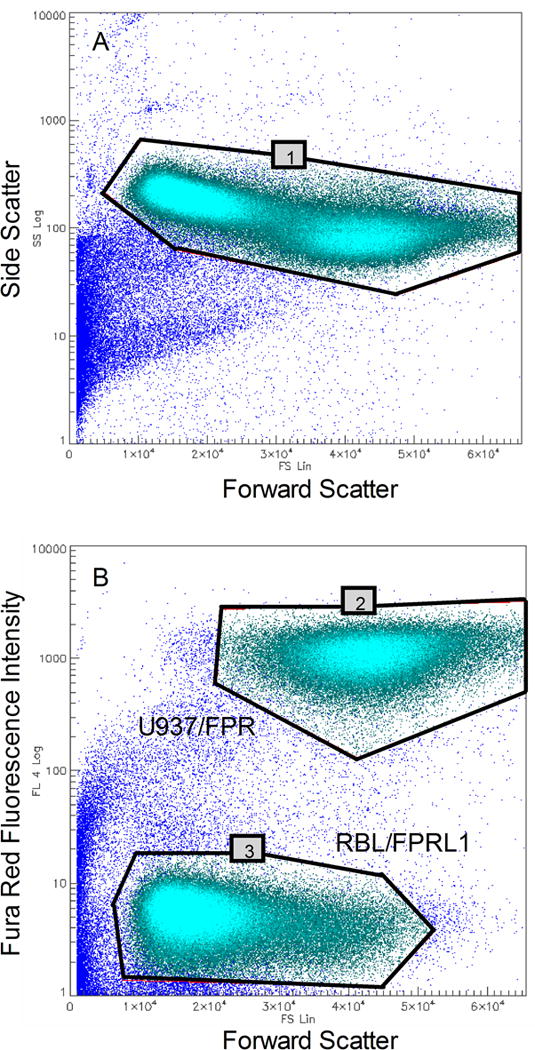
Electronic gates required for analysis. A. A light scatter gate (gate 1) is constructed to exclude debris and non-viable cells from the analysis. B. Two additional gates are constructed on the basis of the color coding signals in the red fluorescence channel. One encloses red fluorescent U937/FPR cells (gate 2) and the other encloses unstained RBL/FPRL1 cells (gate 3). The plots represent combined data from all 384 wells.
Figure 3.
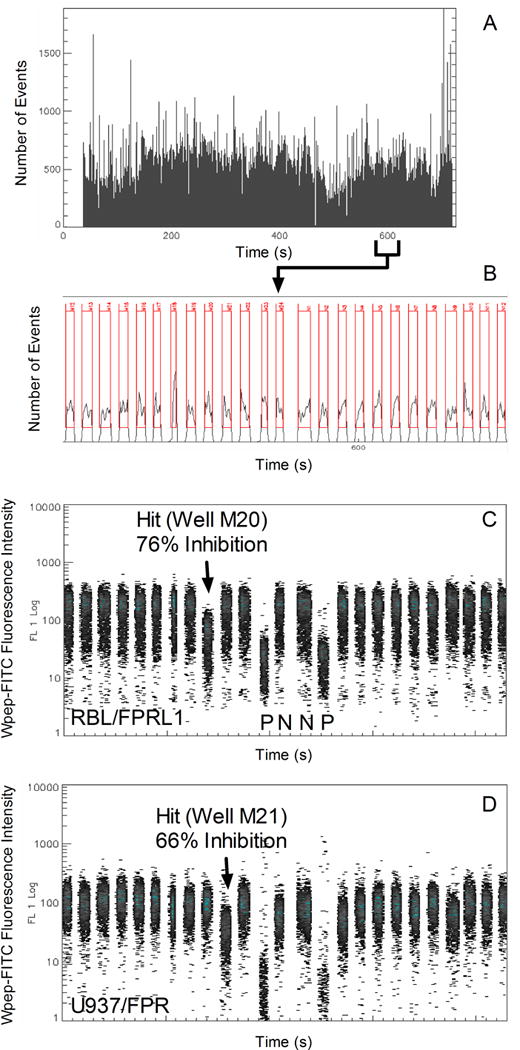
Resolution and analysis of cells sampled from individual wells. A. Display of data from all 384 wells in the Time Bins Analysis window in which the numbers of events detected at 100 ms time intervals are plotted as a function of time. B. A zoomed-in view of data from 25 wells measured in the vicinity of the 600 s time point (boundaries indicated below the time axis in panel A). A software peak detection algorithm identified 384 sets of data and enclosed each in a separate rectangular analysis region or Time Bin. Data sets were segregated on the basis of time gaps in the data stream produced by the passage of air bubbles. The first set is from well M12 and the last from well N12. C. Green fluorescence data from RBL/FPRL1 cells (gate 3) in wells M12 to N12. The test compound in well M20 (arrow) caused a 75% inhibition of Wpep-FITC binding relative to fluorescence intensities measured in control wells. It did not detectably affect Wpep-FITC binding to U937/FPR cells in the same well (see panel D). Data from two positive control wells (P) and two negative control wells (N) are also indicated. D. Green fluorescence data from U937/FPR cells (gate 2) in wells M12 to N12. Well M21 contained a test compound that caused 66% inhibition of Wpep-FITC binding and no detectable effect on Wpep-FITC binding to RBL/FPRL1 cells in the same well (see panel C).
Figure 4.
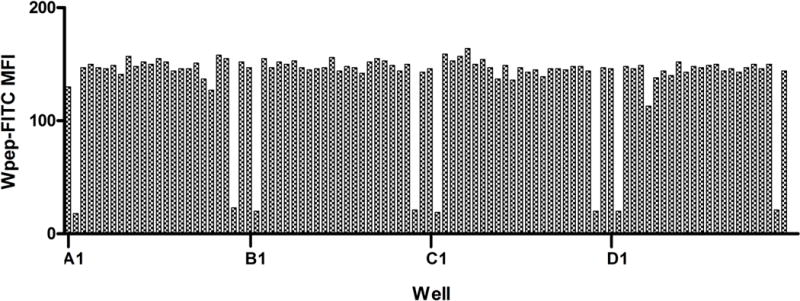
Repetitive fluorescence intensity pattern provides supplementary sample indexing information. Illustrated are green fluorescence data from the first 96 wells of a 384-well plate. Wells are sampled from left-to right (columns 1 to 24) one row at a time, starting with the top row (row A) and moving down. This results in a repetitive pattern of low median fluorescence intensity (MFI) signals marking the 2nd and 23rd wells of each row, the locations of the positive control samples. This information facilitates identification of a row in which an indexing error has occurred.
Acknowledgments
This work was supported by NIH R03 MH076381-01, U54 MH074425-01, the New Mexico Molecular Libraries Screening Center, the University of New Mexico Shared Flow Cytometry Resource and Cancer Research and Treatment Center.
Footnotes
Addition of the fluorescein label to the lysine residue of Wpep alters the affinity to a Kd of 1.8 nM for FPRL1 and 1.2 nM for FPR, as determined in equilibrium binding assays at 4°C (data not shown).
Receptor expression is determined by incubating cells with 10 nM Wpep-FITC for 30 min at 4°C in the presence and absence of 1 μM fMLFF + 1 μM Wpep. Specific peptide binding is computed as the difference in cell median fluorescence intensity (MFI) between unblocked and blocked (fMLFF/Wpep present) conditions and this is transformed to the estimated number of receptors (ligand binding sites) per cell by comparison to an MFI standard curve generated with Quantum FITC MESF calibration beads (Bangs Labs Inc., #825B). If receptor expression decreases of becomes heterogeneous, cells are stained with Wpep-FITC as above and sorted in the flow cytometer to purify and expand cells with high receptor expression (typically 1–5% of cells with brightest fluorescence).
The time required for the thawing of compound solutions will depend upon the volume in each well and well geometry. Remove plate covers only after any condensation has evaporated and minimize any subsequent exposure of compounds dissolved in DMSO to humidity. This is especially important if the compounds will be subjected to multiple freeze-thaw cycles. DMSO rapidly absorbs water and compounds will be increasingly prone to becoming insoluble during a freeze-thaw cycle as DMSO water content increases. Once thawed, the plates are centrifuged at 500×g for 2 min at room temperature. This positions compound solutions uniformly in the bottom of the wells to facilitate accurate automated pipetting.
Cell or reagent dispensing must be done quickly in this step (< 3 min) to minimize warming and cell settling.
Plates are placed on a custom-built system that rotates at 4 RPM to periodically invert the plates. The assay plate well geometry favors fluid retention in wells of an inverted plate due to surface tension. Alternatively, incubation can be performed under static conditions without continuous rotation of the plate. A pipetting mix step to resuspend cells should be added at the end of the incubation if this option is selected.
At this writing, the HyperCyt® platform is available for purchase under a beta testing agreement at IntelliCyt (http://www.intellicyt.com). A simple modification of the sample uptake fluidics pathway of the CyAn flow cytometer is required to allow it to interface with the HyperCyt® platform. One end of the OEM silicone sample transport tubing is detached from the bottom of flow cytometer sample interrogation cuvette. An 8-inch length of PVC tubing is attached there instead. A 1-inch length of 25G stainless steel tubing is used to join the free end of this PVC tubing to either 1) the free end of the OEM silicone tubing to enable manual sample introduction, or 2) the free end of the PVC sample transport tubing of the HyperCyt® platform to enable HT sample introduction. Switching between the two modes of operation requires less than one min.
The peristaltic pump is rotated at 15 rpm to result in a sample flow rate of ~2 μl/s. Faster or slower is typically suboptimal and can also result in increased particle carryover.
This generates a trailing train of bubble-separated liquid volumes to ensure that the last samples are pushed through the data analysis point under the same conditions as the others. Air bubbles are compressible, water is not. A trailing train of PDB would cause the last of the sample-separating air bubbles to compress more than the preceding, pushing the last samples through through more rapidly.
The leftmost tail represents cells with low green fluorescence intensity that came from wells containing compounds that block Wpep-FITC binding. This includes the 32 positive control wells and wells containing active test compounds.
Several redundant sources of information are used to ensure accurate indexing of time-resolved flow cytometry data to source samples. Current practice is to index microplate wells at fixed intervals using the green FL1 fluorescence intensity profiles of the control wells. A pattern is generated by the positive control wells that distinguishes the boundaries of each 24-well span (Fig. 4). Temporal gaps in the data caused by air bubbles provide additional reference signals for indexing data from individual wells. This combined indexing approach has proven to be quite reliable but not without occasional ambiguities of automated data analysis requiring human intervention to resolve. Additional overlapping and redundant indexing signals will likely extend system performance capabilities for full automation.
References
- 1.Kuckuck FW, Edwards BS, Sklar LA. Cytometry. 2001;44:83–90. [PubMed] [Google Scholar]
- 2.Ramirez S, Aiken CT, Andrzejewski B, Sklar LA, Edwards BS. Cytometry. 2003;53A:55–65. doi: 10.1002/cyto.a.10035. [DOI] [PubMed] [Google Scholar]
- 3.Young SM, Bologa C, Prossnitz E, Oprea TI, Sklar LA, Edwards BS. J Biomol Screen. 2004;10:374–382. doi: 10.1177/1087057105274532. [DOI] [PubMed] [Google Scholar]
- 4.Edwards BS, Bologa C, Young SM, Balakin KV, Prossnitz E, Savchuck NP, Sklar LA, Oprea TI. Mol Pharmacol. 2005;68:1301–1310. doi: 10.1124/mol.105.014068. [DOI] [PubMed] [Google Scholar]
- 5.Edwards BS, Young SM, Oprea TI, Bologa C, Prossnitz E, Sklar LA. Nat Protocols. 2006;1:59–66. doi: 10.1038/nprot.2006.9. [DOI] [PubMed] [Google Scholar]
- 6.Migeotte I, Communi D, Parmentier M. Cytokine Growth Factor Rev. 2006;17:501–519. doi: 10.1016/j.cytogfr.2006.09.009. [DOI] [PubMed] [Google Scholar]
- 7.Le Y, Murphy PM, Wang JM. Trends Immunol. 2002;23:541–8. doi: 10.1016/s1471-4906(02)02316-5. [DOI] [PubMed] [Google Scholar]
- 8.Oppenheim JJ, Zachariae CO, Mukaida N, Matsushima K. Annu Rev Immunol. 1991;9:617–48. doi: 10.1146/annurev.iy.09.040191.003153. [DOI] [PubMed] [Google Scholar]
- 9.Murphy PM. In: Chemoattractant ligands and their receptors. Horuk R, editor. CRC Press; Boca Raton, FL: 1996. pp. 269–299. [Google Scholar]
- 10.Prossnitz ER, Ye RD. Pharmacol Ther. 1997;74:73–102. doi: 10.1016/s0163-7258(96)00203-3. [DOI] [PubMed] [Google Scholar]
- 11.Ye RD, Cavanagh SL, Quehenberger O, Prossnitz ER, Cochrane CG. Biochem Biophys Res Commun. 1992;184:582–9. doi: 10.1016/0006-291x(92)90629-y. [DOI] [PubMed] [Google Scholar]
- 12.Snipe JD. In: Immunophysiology: the role of cells and cytokines in immunity and inflammation. Oppenheim JJ, Shevac EM, editors. Oxford University Press; New York, NY: 1990. pp. 259–273. [Google Scholar]
- 13.Lambert MP, Barlow AK, Chromy BA, Edwards C, Freed R, Liosatos M, Morgan TE, Rozovsky I, Trommer B, Viola KL, Wals P, Zhang C, Finch CE, Krafft GA, Klein WL. Proc Natl Acad Sci U S A. 1998;95:6448–53. doi: 10.1073/pnas.95.11.6448. [DOI] [PMC free article] [PubMed] [Google Scholar]
- 14.Kalaria RN. Curr Opin Hematol. 1999;6:15–24. doi: 10.1097/00062752-199901000-00004. [DOI] [PubMed] [Google Scholar]
- 15.Brown DR, Schmidt B, Kretzschmar HA. Nature. 1996;380:345–7. doi: 10.1038/380345a0. [DOI] [PubMed] [Google Scholar]
- 16.Le Y, Yazawa H, Gong W, Yu Z, Ferrans VJ, Murphy PM, Wang JM. J Immunol. 2001;166:1448–51. doi: 10.4049/jimmunol.166.3.1448. [DOI] [PubMed] [Google Scholar]
- 17.Bae YS, Song JY, Kim Y, He R, Ye RD, Kwak JY, Suh PG, Ryu SH. Mol Pharmacol. 2003;64:841–7. doi: 10.1124/mol.64.4.841. [DOI] [PubMed] [Google Scholar]
- 18.Bae YS, Yi HJ, Lee HY, Jo EJ, Kim JI, Lee TG, Ye RD, Kwak JY, Ryu SH. J Immunol. 2003;171:6807–13. doi: 10.4049/jimmunol.171.12.6807. [DOI] [PubMed] [Google Scholar]
- 19.Zhang JH, Chung TD, Oldenburg KR. J Biomol Screen. 1999;4:67–73. doi: 10.1177/108705719900400206. [DOI] [PubMed] [Google Scholar]