Abstract
Navigation depends on multiple neural systems that encode the moment-to-moment changes in an animal's direction and location in space.These include head direction (HD) cells representing the orientation of the head and grid cells that fire at multiple locations, forming a repeating hexagonal grid pattern. Computational models hypothesize that generation of the grid cell signal relies upon HD information that ascends to the hippocampal network via the anterior thalamic nuclei (ATN). We inactivated or lesioned the ATN and subsequently recorded single units in the entorhinal cortex and parasubiculum. ATN manipulation significantly disrupted grid and HD cell characteristics while sparing theta rhythmicity in these regions.These results indicate that the HD signal via the ATN is necessary for the generation and function of grid cell activity.
The ability to navigate is critical for survival of all animals and relies on a broad network of hippocampal and limbic brain circuits (1, 2). The parahippocampal cortex contains grid cells, which fire at multiple locations, forming a hexagonal pattern covering the entire environment (3, 4). Computational models explain grid cell generation from combined inputs of distance and direction displacement, which can subsequently be used for path integration (5–7). Theta rhythm is thought to be necessary for the computation of distance in grid cell models, and disruption of this signal eliminates gridlike firing patterns (8, 9). HD cells fire as a function of an animal's directional orientation in the horizontal plane and are thought to convey the directional heading component to grid cells. However, some models use movement-direction cells, which have yet to be experimentally verified (10). The HD cell signal is generated subcortically and then projected rostrally via the anterior thalamic nuclei (ATN) to the parahippocampal cortices (2, 11, 12). Two nuclei within the ATN are known to contain HD cells—the anterodorsal and anteroventral thalamic nuclei (13, 14). We tested the role of the HD signal in generating grid cell activity in the parahippocampal cortices.
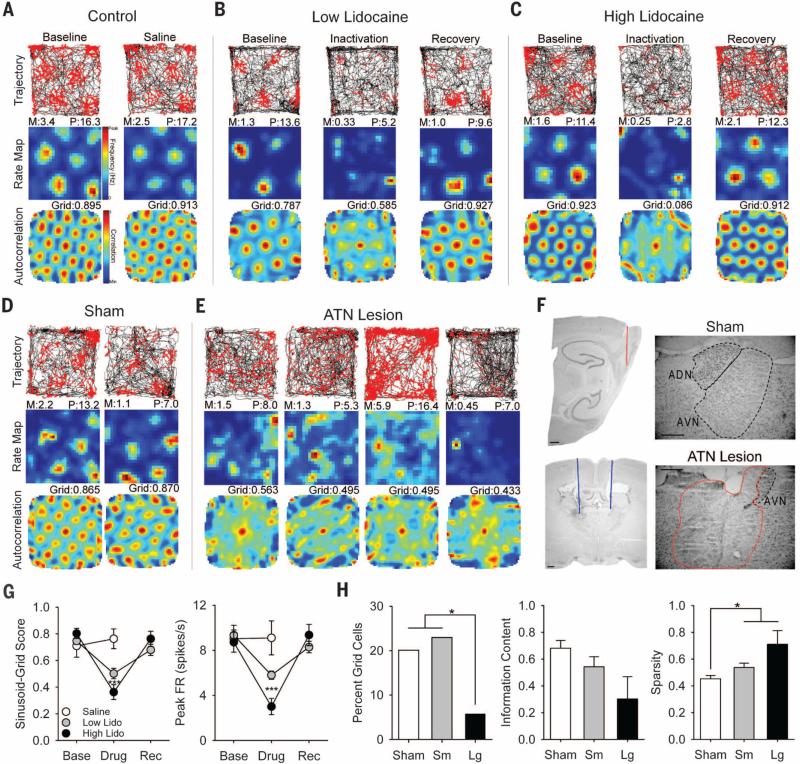
Experiment 1 recorded from parahippocampal cortex, including medial entorhinal cortex (MEC) and parasubiculum, while female Long-Evans rats (n = 3) received infusions of lidocaine bilaterally into the ATN (15), which served to inactivate HD cell activity within this region. Lidocaine infusion resulted in a significant reduction of grid scores (Fig. 1G, left) at low doses (n = 55 cells; baseline mean ± SE: 0.746 ± 0.025; low inactivation: 0.502 ± 0.039; t(54) = 6.807, P < 0.001) (Fig. 1B) and high doses of lidocaine (n = 17 cells; baseline: 0.803 ± 0.038; high inactivation: 0.363 ± 0.056; t(16) = 7.112, P < 0.001) (Fig. 1C). For the high-dose group, 10 of 17 cells had reduced grid scores > 60% compared with baseline (>2 SD); the remaining cells all had decreased grid scores, and most of them had no discernible grid pattern during the inactivation session (Figs. 1C and 2C and fig. S6). Recovery of grid scores occurred ~1.5 hours after the infusion [n = 35 cells; low recovery: 0.680 ± 0.041; t(34) = 2.446, not significant (n.s.); n = 17 cells; high recovery: 0.762 ± 0.057; t(16) = 0.793, n.s.]. Grid scores were spared by saline infusions (n = 10 cells; baseline: 0.709 ± 0.084; saline: 0.763 ± 0.074; t(9) = 0.488, n.s.) (Fig. 1A). Lidocaine had the same effect upon peak firing rate (Fig. 1G right), which was significantly decreased by lidocaine infusions at low doses (n = 55 cells; baseline: 9.33 ± 0.46; low inactivation: 5.79 ± 0.37; t(54) = 6.696, P < 0.001) and high doses (n = 17 cells; baseline: 8.71 ± 0.89; high inactivation: 3.01 ± 0.72; t(16) = 7.162, P < 0.001) and recovered within ~1.5 hours (low: n = 35 cells; recovery: 8.28 ± 0.51; t(34) = 2.604, n.s.; high: n = 17 cells; recovery: 9.35 ± 0.95; t(16) = 0.693, n.s.). Decreased firing rates cannot account for the loss of the grid signal observed during inactivation because subsampling firing rates during baseline spared grid scores (fig. S4).
Fig. 1. Effects of ATN manipulation on grid cell activity.
Grid cell response to (A) saline, (B) low-lidocaine, and (C) high-lidocaine infusions. Row 1: rat path and individual spikes (red dots). Row 2: smoothed firing rate map. Row 3: autocorrelation map. Column 1: baseline recording. Column 2: recording after infusion. Column 3: recording after ~1.5 hours of recovery. M, mean firing rate in spikes/s; P, peak firing rate in spikes/s, Grid, sinusoid-grid score. (D) Two grid cells from sham animals. (E) Four highest-scoring grid cells from ATN large-lesion animals. (F) Electrode track through the parahippocampal cortex (top left), guide cannulae placement (blue line) within ATN (bottom left), and representative ATN region from sham (top right) and ATN large lesion (bottom right) animals. Minimal healthy ATN tissue [specifically in anteroventral thalamic nucleus (AVN)] was observed in the lesioned group (healthy, black; lesioned, red). Only the right hemisphere is illustrated; however, this example is representative of bilateral damage in animals with ≥85% damage. Scale bars, 0.5 mm. (G) Data for sinusoid-grid score (left) and peak firing rate (right) measures, with asterisks indicating significant difference from baseline. (H) Data for percentage of grid cell (left), information content (bits/spike) (middle), and sparsity (right) measures. *P < 0.05; ***P < 0.001.
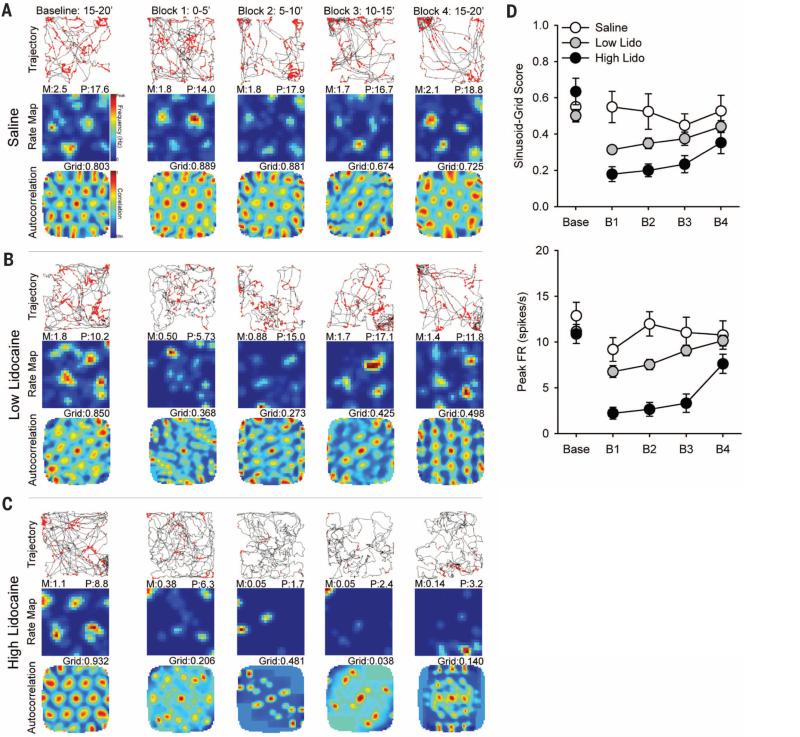
Fig. 2. Time course of lidocaine inactivation.
Grid cell response to (A) saline, (B) low-lidocaine, and (C) high-lidocaine infusions. Column 1: last 5 min of baseline recording session. Column 2: Block 1: 0 to 5 min from inactivation session. Column 3: Block 2: 5 to 10 min. Column 4: Block 3: 10 to 15 min. Column 5: Block 4: 15 to 20 min. Rows are the same as in Fig. 1. (D) Data for sinusoid-grid score (top) and peak firing rate (bottom) measures.
To understand the relationship between the concentration of lidocaine and the time course of inactivation, the inactivation session was divided into four consecutive blocks of 5 min. Saline infusion had no effect on grid scores or peak firing rates (Fig. 2, A and D). Low doses of lidocaine significantly impaired grid scores for the firstthree blocks, and scores recovered by the last block (n = 55 cells; baseline 5 min: 0.501 ± 0.034; F(4,216) = 7.647, P < 0.001; low-inactivation block 1: 0.314 ± 0.021, P < 0.001; block 2: 0.349 ± 0.029, P < 0.001; block 3: 0.374 ± 0.036, P < 0.010; block 4: 0.441 ± 0.033, n.s.) (Fig. 2, B and D). High doses significantly impaired grid scores that never recovered within the session (n = 17 cells; baseline 5 min: 0.634 ± 0.073; F(4,64) = 11.389, P < 0.001; high-inactivation block 1: 0.179 ± 0.041, P < 0.001; block 2: 0.200 ± 0.035, P < 0.001; block 3: 0.234 ± 0.047, P < 0.010; block 4: 0.352 ± 0.061, P < 0.010) (Fig. 2, C and D). Low doses significantly impaired peak firing rates for the first three blocks and recovered by the last block (n = 55 cells; baseline 5 min: 11.15 ± 0.50; F(3.061,165.305) = 14.035, P < 0.001; low-inactivation block 1: 6.77 ± 0.65, P < 0.001; block 2: 7.54 ± 0.56, P < 0.001; block 3: 7.54 ± 0.56, P < 0.010; block 4: 10.15 ± 0.58, n.s.). High doses significantly impaired peak firing rates for the first three blocks and recovered by the last block (n = 17 cells; baseline 5 min: 10.88 ± 1.04; F(2.475,39.596) = 30.301, P < 0.001; high inactivation block 1: 2.22 ± 0.65, P < 0.001; block 2: 2.65 ± 0.75, P < 0.001; block 3: 3.32 ± 1.01, P < 0.001; block 4: 7.62 ± 1.05, n.s.). These results are also consistent with mean firing rate (fig. S9) and overall suggest a dissociation between grid-specific firing and peak firing rate.
In experiment 2, we investigated whether permanent bilateral damage to the ATN disrupts grid cell generation. Short-term inactivation could impair network processing necessary for grid cell expression while sparing the mechanisms for generation. Recovery after permanent damage may allow for a compensatory mechanism to provide input suitable for grid cell generation. Sham and small (including <85% loss) ATN-lesioned animals had comparable numbers of grid cells exceeding the 95th percentile of a shuffled distribution (criterion = 0.439) of grid scores (sham, 48 of 239 = 20.8%; small lesion, 31 of 135 = 23.0%); however, large ATN lesions (including ≥85% loss) had significantly fewer cells pass the grid score criterion [large lesion, 3 of 52 = 5.8%; χ2(1) = 4.62, P < 0.05] (Fig. 1, E and H, left). The effect was even more pronounced when using the 99th-percentile criterion (fig. S3). Overall, grid cells recorded in lesioned animals displayed appreciably lower information content(bits per spike) measures (sham: 0.682 ± 0.058; small lesion: 0.542 ± 0.076, W = 1067, P = 0.087; large lesion: 0.302 ± 0.166, W = 36, P = 0.097) (Fig. 1H, middle) and significantly higher sparsity scores (sham: 0.452 ± 0.025; small lesion: 0.537 ± 0.033, W = 1469, P < 0.05; large lesion: 0.710 ± 0.103, W = 132, P < 0.05) (Fig. 1H, right), suggesting that these cells fired across a broader range of spatial locations relative to sham animals. In addition, we failed to detect significant differences in the peak firing rates of grid cells between groups (sham: 5.78 ± 0.583; small lesion: 5.21 ± 0.533; W = 1226, P = 0.892; large lesion: 9.89 ± 3.33; W = 115, P = 0.144).
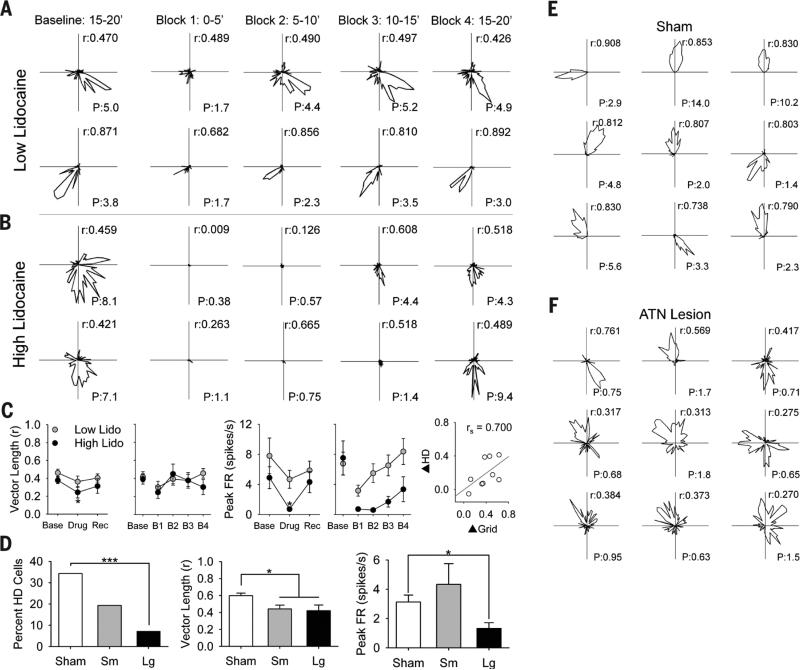
We additionally recorded from cells that contained directional tuning (16). Most of these cells are better considered directionally modulated rather than “classic” HD cells because of their low peak firing rate and broad tuning curve. Experiment 1 lidocaine infusions produced a similar pattern of results on HD cells as they did on grid cells; however, a small sample size did not provide the power necessary to produce significant effects with an adjusted alpha, but there was a significance below P < 0.05. Mean vector length of HD cells was non-significantly reduced at low doses (n = 12 cells; baseline: 0.461 ± 0.041; low inactivation: 0.364 ± 0.063; t(11) = 1.730, n.s.) (Fig. 3, A and C, left) but was significantly reduced at high doses of lidocaine (n = 5 cells; baseline: 0.378 ± 0.036; high inactivation: 0.244 ± 0.063; t(4) = 4.538, P < 0.05) (Fig. 3, B and C, left). Peak firing rate of HD cells was nonsignificantly reduced at low doses (baseline: 7.80 ± 2.37; low inactivation: 4.68 ± 1.19; t(11) = 1.248, n.s.) (Fig. 3C, middle) but was significantly reduced at high doses of lidocaine (baseline: 4.89 ± 1.45; high inactivation: 0.72 ± 0.23; t(4) = 3.006, P < 0.05) (Fig. 3C, middle). When analyzed by 5-min blocks across the inactivation session, there was no effect of lidocaine at either concentration on mean vector length. However, there was a tendency for decreased mean vector length during the first block (low inactivation: baseline 5 min: 0.419 ± 0.056; block 1: 0.303 ± 0.065; F(2.308,25.384) = 2.490, n.s.; high inactivation: baseline: 0.394 ± 0.057; block 1: 0.244 ± 0.066; F(4,16) = 1.050, n.s.) (Fig. 3C, left). In contrast, peak firing rate was significantly decreased for the first block with low doses (baseline 5 min: 6.77 ± 1.52; F(2.063,22.696) = 7.091, P < 0.010.; block 1: 3.17 ± 0.72, P < 0.05; block 2: 5.50 ± 1.25, n.s.; block 3: 6.53 ± 1.38, n.s.; block 4: 8.37 ± 1.72, n.s.) and for three blocks with high doses of lidocaine (baseline: 7.53 ± 2.25; F(4,16) = 5.167, P < 0.010; block 1: 0.73 ± 0.13, P < 0.05; block 2: 0.60 ± 0.12, P < 0.05; block 3: 1.70 ± 0.70, P < 0.05; block 4: 3.36 ± 1.65, n. s.) (Fig. 3C, middle). Lidocaine's effect on peak firing rate likely influenced the measure of mean vector length, which is susceptible to reporting high values with few spikes (17). Although there were modest effects on HD cell mean vector length, simultaneously recorded cells had changes in mean vector length and grid score that were significantly correlated (rs = 0.700, P < 0.05) (Fig. 3C, far right). Additionally, the effect of inactivation on grid and HD cell peak firing rates was highly correlated across sessions (low: r = 0.933; high: r = 0.976) and blocks (low: r = 0.828; high: r = 0.970). In cases where it was possible to examine the time course of recovery of HD-specific firing for HD cells or conjunctive grid-by-HD cells, the time of recovery generally correlated well with the time of recovery for grid cell characteristics (fig. S11).
Fig. 3. Effects of ATN manipulation on HD cell activity.
HD cell response to (A) low- and (B) high-lidocaine doses for 5-min blocks within the inactivation session. Columns are the same as in Fig. 2. Each row is a different cell's polar plot of firing rate by direction. r, mean vector length; P, peak firing rate. (C) Data for mean vector length (left), peak firing rate (middle), and correlation between grid and HD signal change (right). Asterisks indicate significant difference from baseline. (D) Data for percentage of HD cells (left), mean vector length (middle), and peak firing rate (right) measures. Examples of nine HD cells from sham (E) and ATN large lesion (F) animals. HD cells from ATN lesion animals have less robust polar plots, with lower r and P. *P < 0.05; ***P < 0.001.
Experiment 2 also observed a disruption in HD cell activity in parahippocampal cortices after ATN lesions. In lesioned rats, the number of cells that passed the 95th-percentile criterion of a shuffled distribution (criterion = 0.292) of mean vector length was not reduced for small lesions but was significantly reduced for large lesions [sham: 35 of 102 = 34.3%; small lesion: 6 of 31 = 19.4%; n.s.; large lesion: 7 of 97 = 7.2%; χ2(1) = 14.55, P < 0.001] (Fig. 3D, left, and E and F). Furthermore, cells that were classified as HD cells in lesioned animals showed significantly lower mean vector length (sham: 0.599 ± 0.030; small lesion: 0.442 ± 0.045, W = 206, P < 0.001; large lesion: 0.421 ± 0.067, W = 89, P < 0.05) (Fig. 3D, middle). HD cell peak firing rates were significantly reduced after large but not small lesions (sham: 3.13 ± 0.47; smalllesion: 4.34 ± 1.41, n.s.; large lesion: 1.33 ± 0.39, W = 85, P < 0.05) (Fig. 3D, right).
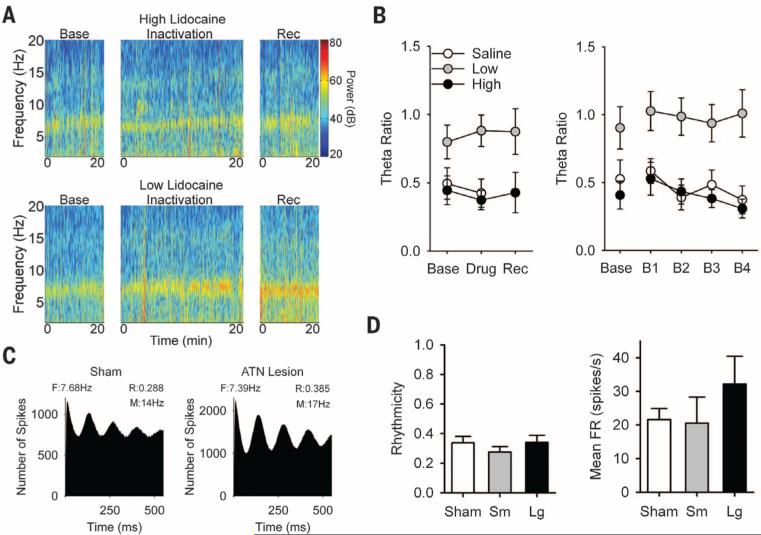
Theta rhythm oscillations (6 to 10 Hz) in the MEC play a critical role in grid cell generation (8, 9). Experiment 1 assessed theta rhythmicity in the local field potential by computing a theta ratio (theta power/delta power) (8, 18). There was no significant effect of lidocaine on theta ratio at low doses across sessions (low baseline: 0.799 ± 0.123; low inactivation: 0.881 ± 0.114; t(17) = 0.860, n.s.) (Fig. 4, A and B, saline illustrated) or blocks (low baseline: 0.903 ± 0.156; F(2.424,41.201) = 0.194, n.s.; low block 1: 1.027 ± 0.144; low block 2: 0.987 ± 0.137; low block 3: 0.937 ± 0.138; low block 4: 1.010 ± 0.175). There was no significant effect of lidocaine on theta ratio at high doses across sessions (high baseline: 0.445 ± 0.105; high inactivation: 0.373 ± 0.071; t(6) = 1.453, n.s.) or blocks (high baseline: 0.408 ± 0.103; F(1.446,8.677) = 1.666, n.s.; high block 1: 0.529 ± 0.121; high block 2: 0.434 ± 0.093; high block 3: 0.382 ± 0.067; high block 4: 0.308 ± 0.069). Experiment 2 assessed theta rhythmicity in interneurons (firing rate > 10Hz) by computing the depth of modulation within spike timing autocorrelograms. There was no significant effect of ATN lesion on interneuron rhythmicity (sham: 0.336 ± 0.044; small lesion: 0.275 ± 0.036, n.s.; large lesion: 0.339 ± 0.048, n.s.) (Fig. 4, C and D, left). There was no effect of lesion on interneuron mean firing rate (sham: 21.59 ± 3.26; small lesion: 20.51 ± 7.82, n.s.; large lesion: 32.17 ± 8.30, n.s.) (Fig. 4D, right).
Fig. 4. Effects of ATN manipulation on theta rhythmicity.
(A) Local field potential displaying theta rhythmicity from high (top) and low (bottom) doses of lidocaine. (B) Data for the measure of theta ratio. (C) Autocorrelation of spike timing from inter-neurons of sham (left) and large ATN lesion (right) animals. F, Frequency (Hz); R, rhythmicity; M, mean firing rate. (D) Data for rhythmicity (left) and mean firing rate (right) measures. Inactivation or lesion of ATN did not disrupt theta rhythmicity in parahippocampal cortices.
The present study supports three conclusions. First, manipulation of ATN significantly reduced the spatial periodicity of grid cells. High concentrations of lidocaine abolished gridlike firing patterns, and large lesions significantly reduced the number of grid cells. Second, manipulation of ATN significantly influenced the HD signal. Inactivation reduced direction-specific firing properties, and lesions significantly reduced the number of HD cells and their characteristics. Third, ATN manipulation spared theta modulation. These effects cannot be attributed to nearby damage from the injections or lesions because the ATN is more than 10 mm away from the grid cell areas recorded. Our findings are consistent with the hypothesis that HD cell inputs from the ATN are involved in parahippocampal grid cell generation; these data are also consistent with the hypothesis that cosine directionally tuned theta cells in the ATN are necessary for grid cell generation (19). In addition to HD and theta inputs, hippocampal projections from CA1 are necessary for grid cell expression in the MEC (17). HD cells in anterodorsal thalamic nucleus (ADN) (20) or MEC (17) remained unaffected by CA1 disruption, and many grid cells developed directional tuning even when no HD preference was identified before inactivation. This observation suggests that CA1 input likely does not contribute directional information to grid cells but instead conveys some other type of information. Behavioral studies provide support for the importance of these signals and brain regions in navigation. Lesions of the ATN produce significant deficits on spatial tasks dependent on either environmental (21) or self-movement cues (22). Similarly, lesions of the grid cell region of MEC produce significant spatial deficits (23, 24); however, self-movement cues appear to be selectively impaired in distance processing (25). In contrast, hippocampal lesions produce significant impairments in both distance and direction processing (25–27). These results suggest that the functional role of grid cell activity may be related to providing a distance metric whose computations are dependent on direction inputs rather than supporting path integration, as some models posit.
Supplementary Material
ACKNOWLEDGMENTS
The authors thank J. Marcroft, S. Valerio, and J. Barry for technical support. This research was supported through the National Institutes of Health grant NS053907 (J.S.T.), a Postgraduate Scholarship–Doctoral program (PGS-D) from the Natural Sciences and Engineering Research Council of Canada (B.J.C.), and an American Psychological Association Dissertation Research Award (B.J.C.). Data will be made available upon request.
Footnotes
SUPPLEMENTARY MATERIALS
www.sciencemag.org/content/347/6224/870/suppl/DC1
Materials and Methods
Figs. S1 to S12
Table S1
References (28–37)
REFERENCES AND NOTES
- 1.Moser EI, Kropff E, Moser M-B. Annu. Rev. Neurosci. 2008;31:69–89. doi: 10.1146/annurev.neuro.31.061307.090723. [DOI] [PubMed] [Google Scholar]
- 2.Taube JS. Annu. Rev. Neurosci. 2007;30:181–207. doi: 10.1146/annurev.neuro.29.051605.112854. [DOI] [PubMed] [Google Scholar]
- 3.Boccara CN, et al. Nat. Neurosci. 2010;13:987–994. doi: 10.1038/nn.2602. [DOI] [PubMed] [Google Scholar]
- 4.Hafting T, Fyhn M, Molden S, Moser M-B, Moser EI. Nature. 2005;436:801–806. doi: 10.1038/nature03721. [DOI] [PubMed] [Google Scholar]
- 5.Burgess N, Barry C, O'Keefe J. Hippocampus. 2007;17:801–812. doi: 10.1002/hipo.20327. [DOI] [PMC free article] [PubMed] [Google Scholar]
- 6.Hasselmo ME, Giocomo LM, Zilli EA. Hippocampus. 2007;17:1252–1271. doi: 10.1002/hipo.20374. [DOI] [PMC free article] [PubMed] [Google Scholar]
- 7.McNaughton BL, Battaglia FP, Jensen O, Moser EI, Moser M-B. Nat. Rev. Neurosci. 2006;7:663–678. doi: 10.1038/nrn1932. [DOI] [PubMed] [Google Scholar]
- 8.Brandon MP, et al. Science. 2011;332:595–599. doi: 10.1126/science.1201652. [DOI] [PMC free article] [PubMed] [Google Scholar]
- 9.Koenig J, Linder AN, Leutgeb JK, Leutgeb S. Science. 2011;332:592–595. doi: 10.1126/science.1201685. [DOI] [PubMed] [Google Scholar]
- 10.Raudies F, Brandon MP, William Chapman G, Hasselmo ME. Brain Res. 2014 doi: 10.1016/j.brainres.2014.10.053. [DOI] [PMC free article] [PubMed] [Google Scholar]
- 11.Bassett JP, Tullman ML, Taube JS. J. Neurosci. 2007;27:7564–7577. doi: 10.1523/JNEUROSCI.0268-07.2007. [DOI] [PMC free article] [PubMed] [Google Scholar]
- 12.Goodridge JP, Taube JS. J. Neurosci. 1997;17:9315–9330. doi: 10.1523/JNEUROSCI.17-23-09315.1997. [DOI] [PMC free article] [PubMed] [Google Scholar]
- 13.Taube JS. J. Neurosci. 1995;15:70–86. doi: 10.1523/JNEUROSCI.15-01-00070.1995. [DOI] [PMC free article] [PubMed] [Google Scholar]
- 14.Tsanov M, et al. J. Neurosci. 2011;31:9489–9502. doi: 10.1523/JNEUROSCI.0353-11.2011. [DOI] [PMC free article] [PubMed] [Google Scholar]
- 15. Materials and methods are available as supporting materials on Science Online.
- 16.Burgalossi A, et al. Neuron. 2011;70:773–786. doi: 10.1016/j.neuron.2011.04.003. [DOI] [PubMed] [Google Scholar]
- 17.Bonnevie T, et al. Nat. Neurosci. 2013;16:309–317. doi: 10.1038/nn.3311. [DOI] [PubMed] [Google Scholar]
- 18.Terrazas A, et al. J. Neurosci. 2005;25:8085–8096. doi: 10.1523/JNEUROSCI.0693-05.2005. [DOI] [PMC free article] [PubMed] [Google Scholar]
- 19.Welday AC, Shlifer IG, Bloom ML, Zhang K, Blair HT. J. Neurosci. 2011;31:16157–16176. doi: 10.1523/JNEUROSCI.0712-11.2011. [DOI] [PMC free article] [PubMed] [Google Scholar]
- 20.Golob EJ, Taube JS. Proc. Natl. Acad. Sci. U.S.A. 1997;94:7645–7650. doi: 10.1073/pnas.94.14.7645. [DOI] [PMC free article] [PubMed] [Google Scholar]
- 21.Warburton EC, Aggleton JP. Behav. Brain Res. 1999;98:27–38. doi: 10.1016/s0166-4328(98)00047-3. [DOI] [PubMed] [Google Scholar]
- 22.Frohardt RJ, Bassett JP, Taube JS. Behav. Neurosci. 2006;120:135–149. doi: 10.1037/0735-7044.120.1.135. [DOI] [PubMed] [Google Scholar]
- 23.Parron C, Poucet B, Save E. Behav. Brain Res. 2004;154:345–352. doi: 10.1016/j.bbr.2004.03.006. [DOI] [PubMed] [Google Scholar]
- 24.Parron C, Save E. Exp. Brain Res. 2004;159:349–359. doi: 10.1007/s00221-004-1960-8. [DOI] [PubMed] [Google Scholar]
- 25.Winter SS, Köppen JR, Ebert TBN, Wallace DG. Hippocampus. 2013;23:139–152. doi: 10.1002/hipo.22075. [DOI] [PubMed] [Google Scholar]
- 26.Golob EJ, Taube JS. J. Neurosci. 1999;19:7198–7211. doi: 10.1523/JNEUROSCI.19-16-07198.1999. [DOI] [PMC free article] [PubMed] [Google Scholar]
- 27.Maaswinkel H, Whishaw IQ. Behav. Brain Res. 1999;99:143–152. doi: 10.1016/s0166-4328(98)00100-4. [DOI] [PubMed] [Google Scholar]
Associated Data
This section collects any data citations, data availability statements, or supplementary materials included in this article.


