

Abstract
Objective
Previous studies have suggested that glycogen expression in vaginal epithelium decreases at menopause, resulting in reduced levels of lactobacilli. However, free glycogen in genital fluids and its relationship to Lactobacillus levels has not been compared in pre- and post-menopausal women.
Methods
82 cervico-vaginal lavage samples were collected at different phases of the menstrual cycle from 11 pre-menopausal (4 HIV-uninfected and 7 HIV-infected) and 12 post-menopausal (7 HIV-uninfected and 5 HIV-infected) women over a 1–3 month period. Free glycogen was quantified in genital fluid. Lactobacillus levels were quantified by real time PCR. Estrogen and progesterone levels in blood were determined by ELISA.
Results
Free glycogen was detected in both pre- and post-menopausal women. Across all samples, those from post-menopausal women had significantly lower levels of free glycogen than those from pre-menopausal women (median 0.002 vs. 0.065 µg/µl, respectively; p = 0.03). Lactobacillus levels correlated positively with free glycogen in both pre- (Spearman r=0.68, p <0.0001) and post-menopausal women (r=0.60, p <0.002). Samples from pre-menopausal women had higher Lactobacillus levels and a lower vaginal pH (median log=8.1; median pH= 4) than those from post-menopausal women (median log=7.1; median pH=4.6) although these differences were not significant. HIV status had no significant effect on these relationships.
Conclusion
Free glycogen was detected in both pre- and post-menopausal women and correlated with Lactobacillus in both groups. These results point to the complexity of the relationship between menopause and vaginal microbiota and indicate that more careful studies of the role played by glycogen are warranted.
Keywords: menopause, estrogen, vaginal pH, Lactobacillus, glycogen
Introduction
The lower genital tract of many women of reproductive age is colonized predominately by Lactobacillus species. Lactobacillus inhibits the development of bacterial vaginosis (BV) and significantly lowers the risk of acquiring several sexually transmitted infections including HIV, HSV-2, Neisseria gonorrhoeae and Chlamydia trachomatis1, 2. In HIV-infected women, those with higher genital levels of lactobacilli shed less virus in their vaginal fluids and are less likely to transmit HIV to their partner3, 4. Colonization with lactobacilli is also associated with a lower risk of pelvic inflammatory disease and pregnancy-related complications, including pre-term labor1, 2. In post-menopausal women, a decrease in Lactobacillus relative abundance is associated with signs of vulvovaginal atrophy5 and increased risk of urinary tract and sexually transmitted infections6, 7. Lactobacillus therefore plays an important beneficial role in health of both pre- and post-menopausal women.
It has long been recognized that vaginal Lactobacillus levels, estrogen and vaginal glycogen vary during different stages of life8–10. Around the onset of puberty, the female lower genital tract typically becomes colonized with Lactobacillus species and the vaginal pH decreases. These changes are concurrent with an increase in circulating estrogen, and are accompanied by a rise in glycogen deposits in vaginal epithelial cells8. At menopause, epithelial glycogen in the vagina is reportedly reduced11 and the relative abundance of Lactobacillus is decreased5. These observations have led to the hypothesis that at menopause, a reduction in estrogen leads to reduced glycogen deposition in the vaginal epithelium and this in turn negatively impacts vaginal Lactobacillus levels.
However, several studies did not find a clear relationship between menopause, estrogen, glycogen and Lactobacillus. For example, significant glycogen staining was seen in epithelial cells in vaginal smears made from post-menopausal women and ovariectomized women12, 13. Also, intraepithelial glycogen content has been reported to be independent of hormonal changes14. Moreover, Lactobacillus species are shown to dominate the vaginal microbiota in post-menopausal women-albeit to a lesser extent than what is found in pre-menopausal women5.
Recent studies suggest that the amount of free glycogen in genital fluid may be more closely associated with Lactobacillus levels in the genital tract than other measures such as epithelial glycogen15–17. Free glycogen is defined as soluble glycogen in genital fluid that is not cell-associated. However, most studies of vaginal glycogen have not measured the concentration of free glycogen in genital fluids and it has not been established how menopause would affect free glycogen levels. Therefore, in this exploratory study, we investigated the hypothesis that women in menopause would have lower levels of free glycogen and Lactobacillus in their genital fluid than pre-menopausal women. Because some species of Lactobacillus (i.e. L. crispatus and L. jensenii) are thought to be more protective than others (i.e. L. iners)18–21, we also compared the levels of these three species in pre- and post-menopausal women.
Methods
Ethics Statement
The Institutional Review Boards of Rush University Medical Center and the Cook County Health and Hospitals System approved the study and written informed consent was obtained from all participants.
Patients and Sample Acquisition
Vaginal fluid samples were collected from participants in a longitudinal study designed to investigate the effects of sex hormones on β-catenin signaling and HIV infection (manuscript in preparation). Samples were collected from 11 pre-menopausal (4 HIV− and 7 HIV+) and 12 post-menopausal (7 HIV− and 5 HIV+) participants. Samples were collected at the Ruth M. Rothstein CORE Center of the Cook County Health and Hospitals System in Chicago. Pre-menopausal women had a self-reported regular menstrual cycle between 25–30 days for six months prior to study entry. Post-menopausal women were defined as having >12 months of amenorrhea. HIV infection was confirmed by ELISA and Western Blot. The HIV-infected women had stopped antiretroviral therapy (ART) for at least 6 months prior to enrollment in this study. All women had not taken birth control pills for at least two months prior to study entry, and were asked to abstain from vaginal intercourse, vaginal spermicides, douches, or other vaginal topical agents for 48 hours prior to sample collection. The presence of Trichomonas vaginalis was determined by wet mount. Bacterial vaginosis (BV) was determined by the Amsel criteria22; samples were collected from women with active BV, or other sexually transmitted infections diagnosed at a visit. Women were then treated and asked to return during the next menstrual cycle. Those with irregular menstrual cycles and those on hormone-based birth control were deemed ineligible.
Cervico-vaginal lavage (CVL) samples were obtained by irrigation of the cervix with 10 ml of nonbacteriostatic sterile saline, followed by aspiration from the posterior fornix. Pre-menopausal women were asked to come to the clinic 2–5 days after the start of menses and on the following days to represent distinct stages of the menstrual cycle: day 7– 13 (follicular phase), day 14–20 (early luteal phase), and at >21 days (late luteal phase). Pre-menopausal women were followed for approximately two menstrual cycles. Post-menopausal women were sampled at two visits, approximately one month apart. At each visit, blood was drawn to measure serum levels of progesterone and estradiol (Quest Diagnostics, Madison, NJ). All samples collected from an individual were assayed together as a batch. Estrogen cutoffs were selected based on dividing all samples (pre- and post-menopausal) into tertiles. The pH of vaginal secretions was determined prior to cervico-vaginal lavage (CVL) collection, by adding genital fluid to indicator strips with a pH range of 4–7 (ColorpHast indicator strips, MCB Reagents, Gibbstown, NJ).
PCR Quantification of Bacteria
Bacteria in CVL samples were pelleted by centrifugation at 13200 rpm for 25 minutes. The cell-free supernatant was used to quantify free glycogen (see below). DNA was isolated from the pellet using FastDNA SPIN kit per manufacturer’s instructions (MP Biomedicals, Solon, OH). Final elution volume was 100 µl. DNA concentration was determined by NanoDrop 2000 spectrophotometer.
Bacteria specific quantitative PCR (qPCR) assays were performed on isolated CVL genomic DNA. Each 20 µl qPCR reaction contained 1× iTaq Universal Probes Supermix 172–5134 (Bio-Rad Hercules, CA), 1× PrimeTime Standard qPCR Assay (IDT Coralville, IA) primers/probes mixture, and 1–25 ng template DNA. PCR conditions included a pre-melt at 95°C for 3 minutes, then 50 cycles of 95°C for 30 seconds (melt), 55–65°C for 30–60 seconds (annealing), and 65–72°C for 30–60 seconds (extension). Primers and probes for the bacteria were described previously23, 24. Known quantities of 16S rRNA plasmid targets were used as standards23, 24. Real time PCR was carried out on an Applied Biosystems 7900HT Fast Real-Time PCR System. The final quantity of Lactobacillus was calculated by adding together the number of 16S rRNA copies per 1 ml of CVL of L. crispatus, L. iners and L. jensenii.
Glycogen measurement
Free glycogen in cell-free genital fluid was measured fluorometrically (Glycogen Assay Kit, BioVision, Milpitas, CA). Briefly, 10 µl of genital fluid or saline (serving as blank) was added to test wells in a 96-well plate. The volume was adjusted to 50 µl with hydrolysis buffer, with or without the kit hydrolysis enzyme. Glucose background (samples without hydrolysis enzyme) was subtracted to determine glycogen concentration. The Relative Fluorescence Units (RFU) were measured using a BioTek Synergy HT plate reader (BioTek Instruments, Inc, Winooski, VT).
Statistical Analysis
Descriptive statistical analyses were performed using the Instat statistical software package (GraphPad Software). Nonparametric methods were used for comparisons and to assess correlations, as indicated in the figure legends. A p-value of ≤0.05 indicated statistical significance.
Models accounting for repeated measures were considered. Due to small sample size and the fact there were only two measurements available for post-menopausal women, more sophisticated repeated measures statistical models were unable to be fit. Instead, the models considered were run on a subset of the study sample. Specifically, the focus of the modeling portion of the analysis was premenopausal women with one complete menstrual cycle. The subset of the sample includes 7 HIV-infected premenopausal women and 4 HIV-uninfected premenopausal women, each with three repeated measurements (taken at the follicular, luteal, and late-luteal phases of one cycle) for the variables of interest.
Numerical summaries [medians and Interquartile range (IQR)] of the key variables of interest were explored by both HIV status and cycle phase. The statistical significance of the effect of HIV status and phase on each variable separately was tested using the repeated measures ANOVA procedure. Separate mixed effects models were fit for the subset of the samples (described above) to explore the relationships of Lactobacillus with estrogen, progesterone, glycogen, and pH. Each model was also adjusted for HIV status and the phase of the menstrual cycle. Repeated measures were accounted for by using an unstructured covariance matrix. AIC, BIC, and likelihood ratio tests were carried out to assess model fit and the appropriate structure of the variance-covariance matrix. The unstructured covariance matrix provided a statistically superior fit compared to all other structures for these data. Mixed model diagnostics included an assessment of the predicted profiles for each participant. The chosen models provided an adequate statistical fit to the data. All statistical analyses were fit using the PROC MEANS, PROC GLM, and PROC MIXED procedures in SAS V.9 (Cary, NC).
Results
Glycogen levels in genital fluids of pre- and post-menopausal women
A total of 82 CVL samples were collected from 23 women. Participants’ characteristics are summarized in Table 1. Ninety-one percent of women were African American; 4% of the samples were positive for T. vaginalis at the time of collection, 2% were positive for Candida albicans, and 11% were positive for bacterial vaginosis (BV) (Amsel criteria). None of the HIV-infected patients were taking antiretroviral therapy (ART) at the time of sampling.
Table 1.
Subject’s Characteristics
| Characteristics | ||
|---|---|---|
| Number of subjects | 23 | |
| Race | ||
| African American | 21 | |
| white | 1 | |
| other | 1 | |
| Median age range at initial visit (years) | ||
| pre-menopause (range) | 40.0 (34–48) | |
| post-menopause (range) | 55.5 (43–61) | |
| Total number of visits analyzed | 82 | |
| Number of HIV− subjects | ||
| pre-menopause | 4 | |
| post-menopause | 7 | |
| Number of HIV+ subjects | ||
| pre-menopause | 7 | |
| post-menopause | 5 | |
| Average number of years since diagnosis (range) | 11.8 (3–26) | |
| Average viral load (range) | 7×10⁴ (796 – 2×10⁵) | |
| Average CD4 count (range) | 494 (10–930) | |
| Anti Retroviral Therapy | 0 | |
| Visits with T. vaginalis | 3 | |
| Visits with Candida | 2 | |
| Visits with BV (Amsel) | 9 | |
| Visits with antibiotic use | 5 | |
| Visits with substance abuse | 9 | |
| Vaginal sex (in the 48 hrs prior to visit) | 0 | |
| Douche (in the 48 hrs prior to visit) | 0 | |
The amount of free glycogen in the 82 vaginal fluid samples was measured and showed a wide distribution, ranging from 0 to 0.487 µg/µl (coefficient of variance = 130.7%; Fig 1A). Samples from post-menopausal women had significantly lower levels of free glycogen than those from pre-menopausal women (median 0.002 vs. 0.065 µg/µl, respectively; p = 0.03).
Figure 1. Glycogen levels in genital fluids of pre- and post-menopausal women.
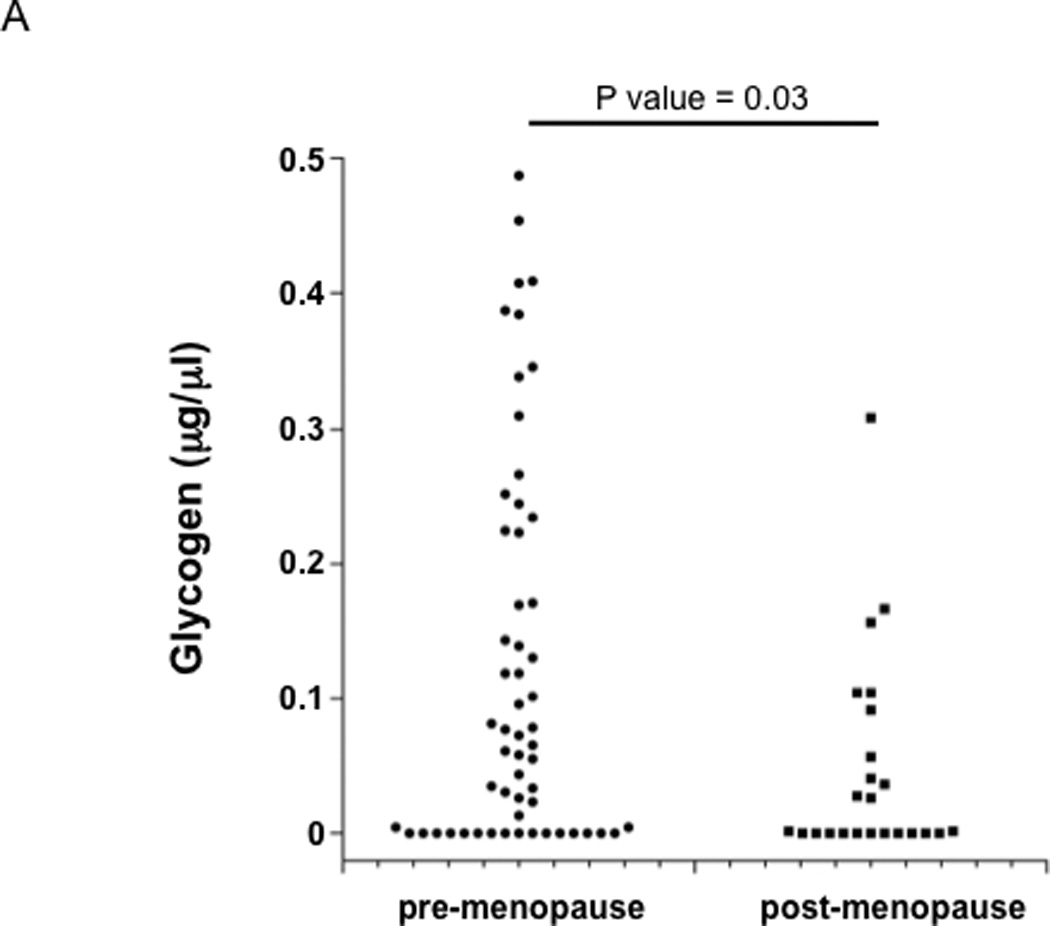
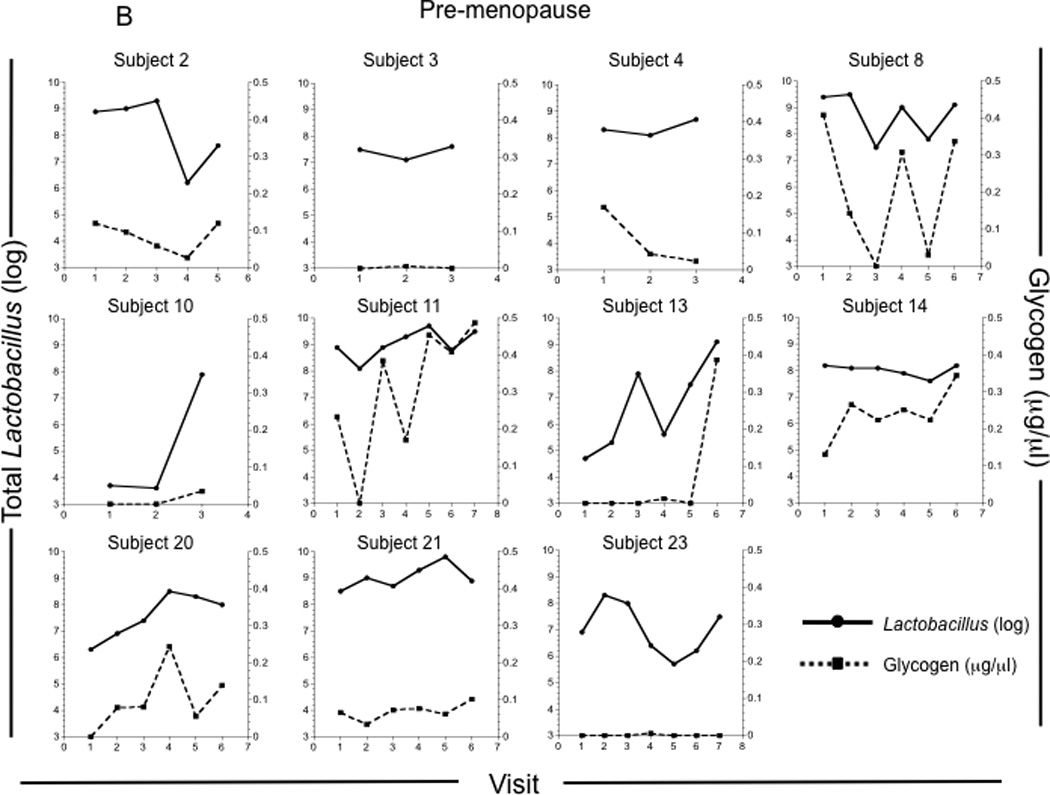
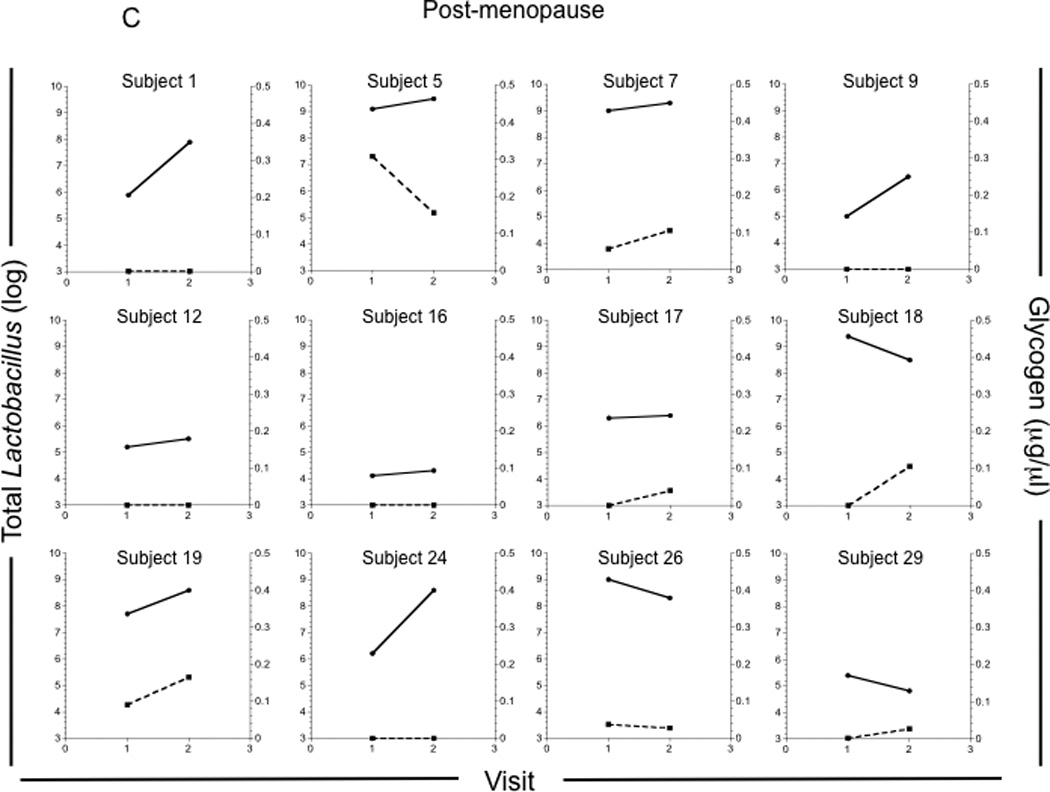
Glycogen levels were measured in vaginal fluids collected by lavage from 4 pre-menopausal and 7 post-menopausal HIV−, and 7 pre-menopausal and 5 post-menopausal HIV+ participants approximately weekly over a 1–3 month period. (A) Glycogen concentrations in all vaginal fluid samples collected from pre-menopausal (n = 57) and post-menopausal (n = 24) women. Glycogen concentrations and Lactobacillus (log) versus study visit for each pre-menopausal (B) and post-menopausal (C) woman.
When examined at the individual level, some pre-menopausal women had consistently low levels of free glycogen (Figure 1B: individuals 3 and 23, for example), while others exhibited higher levels of free glycogen (Figure 1B: individual 14). When all time points were analyzed, individual 23 had significantly lower glycogen than did 11 and 14 (p <0.01). Interestingly, free glycogen levels in most of the pre-menopausal women fluctuated considerably over the study period (Fig 1B).
Five of the post-menopausal women had consistently low levels of free glycogen (participants 2, 9, 12, 16, and 24; Figure 1C), while three had substantial levels of glycogen when compared to the pre-menopausal women (participants 5, 7 and 19; Fig 1C). There was no significant association between age and glycogen levels in either pre-or post-menopausal women (data not shown).
Lactobacillus levels correlate positively with free glycogen in pre- and post-menopausal women
Since lactobacilli in the lower genital tract have been postulated to utilize glycogen as an energy source8, 25, we examined the relationship between total Lactobacillus levels and free glycogen in vaginal fluids. Lactobacillus and glycogen correlated strongly in both pre-menopausal (Spearman r = 0.68, p<0.0001; Fig 2) and post-menopausal women (Spearman r = 0.60, p<0.002). Of the three vaginal Lactobacillus species measured (L. iners, L. crispatus, and L. jensenii), there was a positive correlation between L. iners and glycogen levels when all samples were analyzed (Supplementary Figure 1), and in either pre- (Spearman r = 0.6, p<0.0001) or post-menopausal samples (r = 0.7, p<0.0001). Likewise, L. jensenii levels were significantly associated with free glycogen when all samples were analyzed (Supplementary Figure 1), and in either pre- (r = 0.4, p<0.0006) or post-menopausal samples (r = 0.65, p<0.0006). However, there was not a significant association between L. crispatus and glycogen in either group (Supplementary Figure 1, and data not shown).
Figure 2. Lactobacillus levels correlate positively with free glycogen in pre- and post-menopausal women.
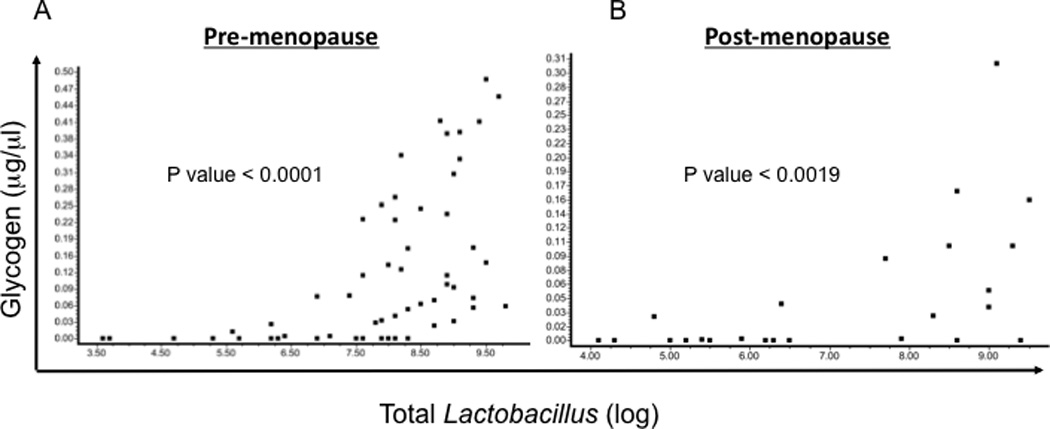
Free glycogen and total Lactobacillus levels in pre-menopause (A) and post-menopause (B) samples. The correlation between free glycogen and total Lactobacillus was determined by the Spearman method.
We also compared the levels of L. iners, L. crispatus, and L. jensenii in samples from pre- with post-menopausal women. There was a trend toward higher L. iners levels in pre-menopausal samples (p=0.11, Table 2). L. crispatus and L. jensenii levels were not significantly different (Table 2).
Table 2.
Comparison of estrogen, progesterone, Lactobacillus, and glycogen in samples from pre- and post-menopausal women
| pre-menopause (n = 58) |
post-menopause (n = 24) |
P | |
|---|---|---|---|
| Estrogen (pg/ml) | |||
| median | 122 | 24.5 | < 0.0001 |
| mean | 129 | 32.4 | |
| Progesterone (ng/ml) | |||
| median | 0.5 | 0 | 0.002 |
| mean | 4.4 | 0.47 | |
| Lactobacillus (median log) | 8.1 | 7.1 | 0.17 |
| L. iners (median log) | 8.0 | 6.5 | 0.11 |
| L. crispatus (median log) | 3.9 | 3.8 | 0.9 |
| L. jensenii (median log) | 3.8 | 4.5 | 0.4 |
| pH (median) | 4.0 | 4.6 | 0.09 |
| glycogen (median; µg/µl) | 0.065 | 0.002 | 0.03 |
There was a trend toward lower vaginal pH in samples from pre-menopausal (median 4.0) as compared with post-menopausal women (median 4.6; p=0.09, Table 2). As expected, estrogen levels were significantly higher in pre- vs. post-menopausal women (median 122 pg/ml vs. 24.5 pg/ml; coefficient of variance = 70.6%; p < 0.0001). Likewise, progesterone levels were significantly higher in pre-menopausal women (median 0.5 ng/ml vs. 0 ng/ml; coefficient of variance = 289%; p= 0.002, Table 2).
Overall, Lactobacillus levels in pre- and post-menopausal HIV+ samples did not differ significantly (not shown). Of the Lactobacillus species examined, no significant differences were observed between in pre- and post-menopausal HIV+ samples (not shown). In unadjusted repeated measures ANOVA, HIV status was not significantly associated with pH, glycogen, or Lactobacillus levels.
Our attempts to assess the relationship between glycogen and Lactobacillus in pre- and post-menopausal women, while taking into account repeated measures, were unsuccessful due to the fact that there were only two measurements available for each of the post-menopausal women. We therefore, in fitting our mixed effects models, restricted our analyses to pre-menopausal women and found there was a statistically significant positive relationship between glycogen and Lactobacillus after adjusting for HIV status and phase of menstrual cycle (β = 6.89, p = 0.02). Likewise, there was a statistically significant negative relationship between pH and Lactobacillus after adjusting for HIV status and phase of menstrual cycle (β = −2.85, p < 0.001).
Relationship of estrogen to glycogen and Lactobacillus
Estrogen has been postulated to influence glycogen expression by vaginal epithelial cells11, although its effect on free glycogen has not been determined. We therefore investigated the relationship between estrogen and glycogen by dividing the pre-menopausal samples into 3 groups; high (≥134 pg/ml), intermediate (67–133 pg/ml), and low estrogen (<67 pg/ml, Table 3). Glycogen was not significantly different in the three groups (median=0.053 vs. 0.063 vs. 0.14 µg/µl, respectively; p= 0.9). There were also no significant differences in either vaginal pH, total Lactobacillus or the different species of Lactobacillus levels in the three groups. Similarly, no significant differences were observed in the levels of glycogen or Lactobacillus when all samples (regardless of menopause status) were compared based on estrogen levels (Kruskal-Wallis Test, p >0.05; Supplementary Table 1).
Table 3.
Comparison of progesterone, Lactobacillus, pH, and glycogen by estrogen level in pre-menopausal women
| high estrogen (≥ 134 pg/ml) n = 26 |
Intermediate estrogen (133≥ estrogen ≥ 67 pg/ml) n = 25 |
low estrogen (< 67 pg/ml) n = 7 |
P | |
|---|---|---|---|---|
| Progesterone (ng/ml) | ||||
| median | 1.65 | 1.40 | 0.00 | 0.1 |
| mean | 5.8 | 3.8 | 0 | |
| Lactobacillus (median log) | 8.00 | 8.20 | 8.30 | 0.4 |
| L. iners (median log) | 7.95 | 7.70 | 8.30 | 0.6 |
| L. crispatus (median log) | 3.70 | 4.10 | 4.00 | 0.8 |
| L. jensenii (median log) | 3.60 | 4.00 | 3.80 | 0.6 |
| pH (median) | 4.40 | 4.00 | 4.40 | 0.4 |
| glycogen (median; µg/µl) | 0.053 | 0.063 | 0.14 | 0.9 |
We also assessed the effects of the different phases of the menstrual cycle on glycogen and Lactobacillus levels in pre-menopausal women, taking into account the repeated measures (see above). Our analyses showed that glycogen and total Lactobacillus levels did not significantly vary at different stages of the menstrual cycle (not shown).
Discussion
In this study, we quantified the levels of free glycogen and Lactobacillus in vaginal fluids obtained from pre- and post-menopausal women. While glycogen in epithelium or in epithelial cells has been measured in previous studies, to our knowledge, the concentration of free glycogen in genital fluid samples has not been quantified and compared to the levels of Lactobacillus in either pre- or post-menopausal women. We posit that the amount of free glycogen is a biologically important measurement since it represents the amount of glycogen that is available for utilization by Lactobacillus in the vaginal lumen.
A major finding of this study is that there was a strong positive correlation between free glycogen and Lactobacillus levels in samples from both pre- and post-menopausal women (Figure 2). This is an important finding as it provides additional evidence for the proposed role of glycogen in supporting in vivo growth of genital Lactobacillus. This finding also provides support for the proposition that measurement of free glycogen is a biologically meaningful parameter. However, further studies are needed to more definitively establish any relationship between glycogen levels and Lactobacillus colonization in the female genital tract.
The finding of a strong correlation between glycogen and Lactobacillus in the post-menopausal women was somewhat surprising since estrogen was relatively low in the post-menopausal women and glycogen expression by vaginal epithelial cells are thought to be influenced by changes in estrogen levels11. Thus, our studies indicate that some post-menopausal women can have substantial amounts of glycogen and Lactobacillus despite low estrogen. A recent study found that Lactobacillus dominated the vaginal microbiota in most of the studied post-menopausal women, although to a lesser extent than what was found in pre-menopausal women5. Another study showed that glycogen could still be detected in vaginal smears obtained from post-menopausal women13. It is possible that other hormones such as estrone (the predominant form of estrogen in post-menopausal women26) could affect free glycogen levels.
The lack of a significant association between estrogen and glycogen in the pre-menopausal women was unexpected and could be due to the relatively small sample size in this study. These results could also be explained by the timing of sample collection such that a rapid rise (or fall) in estrogen levels27 could have been missed. It is also possible that glycogen release into the lumen may be delayed, by as many as several days, after a change in circulating estrogen and/or increases in intraepithelial glycogen levels. However, Gregoire et al. also found that the stage of the menstrual cycle in pre-menopausal women had no significant relationship to glycogen levels in hydrolyzed vaginal biopsies14.
Interestingly, we found that free glycogen levels changed substantially over relatively short periods of time in both pre- and post-menopausal women. Large changes were seen in some pre-menopausal women even when visits were only one week apart. Given the strong correlation between glycogen and Lactobacillus, periods of low glycogen availability in vaginal lumen might render a woman vulnerable to vaginal infections and other risks associated with low Lactobacillus levels. A recent study by Gajer et al.28 assessed the genital microbiota in healthy women several times per week and found that the genital microbiota changed substantially in many of the women over the course of a few days. For example, participant 24 in that study had a microbiota consisting of >70% L. crispatus at week 4. By the middle of that week, the microbiota was <10% L. crispatus, but by the end of that week, had returned to >60% L. crispatus. Similar rapid changes were seen in this participant at weeks eight and 12 in the 15-week study period. Such rapid changes in microbiota were seen in most of the women in that study. While glycogen levels were not assessed in that study, it is possible that sudden changes in free glycogen could contribute to the marked variation observed in microbiota. However, it is also possible that changes in the relative abundance of other microbes (e.g. Gardnerella), however transient, could be responsible for changes in relative abundance of the Lactobacillus species.
It will be important to study factors that are associated with an increase in free glycogen concentrations. In a recent study17, we observed that having a recent sexual partner (vs. no partner) was negatively associated with free glycogen, while body mass index was positively associated. Further studies are needed to determine whether glycogen is indeed increased in vaginal epithelium or whether it is instead released into the vaginal lumen at a higher rate. Thus, a critical question is whether glycogen levels in vaginal fluid are associated with changes in glycogen deposits in the vaginal epithelium.
Conclusion
Taken together, our data show that glycogen levels are significantly associated with Lactobacillus levels in both pre- and post-menopausal women. This finding suggests that persistently low levels of free glycogen in both pre- and post-menopausal women might increase the risk of adverse effects associated with low Lactobacillus levels. Furthermore, these studies point to the need for further investigations to understand the biological factors that affect levels of free glycogen and further suggest that designing interventions that increase and maintain high free glycogen could positively impact women’s health.
Supplementary Material
Acknowledgement
The authors would like to thank Dr. Lena Al-Harthi for helpful discussions.
Financial support: This work was supported by National Institutes of Health (NIH) grants P01 AI08297 and P30 AI 082151.
Footnotes
Financial disclosure: The authors have no conflict of interest to declare
- Supplementary Figure 1
- Supplementary Table 1
References
- 1.Ma B, Forney LJ, Ravel J. Vaginal microbiome: rethinking health and disease. Annu Rev Microbiol. 2012;66:371–389. doi: 10.1146/annurev-micro-092611-150157. [DOI] [PMC free article] [PubMed] [Google Scholar]
- 2.Marrazzo JM. Interpreting the epidemiology and natural history of bacterial vaginosis: are we still confused? Anaerobe. 2011;17(4):186–190. doi: 10.1016/j.anaerobe.2011.03.016. [DOI] [PMC free article] [PubMed] [Google Scholar]
- 3.Sha BE, Zariffard MR, Wang QJ, et al. Female genital-tract HIV load correlates inversely with Lactobacillus species but positively with bacterial vaginosis and Mycoplasma hominis. J Infect Dis. 2005;191(1):25–32. doi: 10.1086/426394. [DOI] [PubMed] [Google Scholar]
- 4.Cu-Uvin S, Hogan JW, Caliendo AM, Harwell J, Mayer KH, Carpenter CC. Association between bacterial vaginosis and expression of human immunodeficiency virus type 1 RNA in the female genital tract. Clin Infect Dis. 2001;33(6):894–896. doi: 10.1086/322613. [DOI] [PubMed] [Google Scholar]
- 5.Brotman RM, Shardell MD, Gajer P, et al. Association between the vaginal microbiota, menopause status, and signs of vulvovaginal atrophy. Menopause. 2014;21(5):450–458. doi: 10.1097/GME.0b013e3182a4690b. [DOI] [PMC free article] [PubMed] [Google Scholar]
- 6.Raz R, Stamm WE. A controlled trial of intravaginal estriol in postmenopausal women with recurrent urinary tract infections. N Engl J Med. 1993;329(11):753–756. doi: 10.1056/NEJM199309093291102. [DOI] [PubMed] [Google Scholar]
- 7.Drew O, Sherrard J. Sexually transmitted infections in the older woman. Menopause Int. 2008;14(3):134–135. doi: 10.1258/mi.2008.008020. [DOI] [PubMed] [Google Scholar]
- 8.Cruickshank RSA. The biology of the vagina in the human subject. II: The bacterial flora and secretion of the vagina in relation to glycogen in the vaginal epithelium. J Obstet Gynecol Br Emp. 1934;41:208–226. [Google Scholar]
- 9.Cruickshank R. The conversion of the glycogen of the vagina into lactic acid. The Journal of Pathology and Bacteriology. 1934;39(1):213–219. [Google Scholar]
- 10.Thoma ME, Gray RH, Kiwanuka N, et al. Longitudinal changes in vaginal microbiota composition assessed by gram stain among never sexually active pre- and postmenarcheal adolescents in Rakai, Uganda. J Pediatr Adolesc Gynecol. 2011;24(1):42–47. doi: 10.1016/j.jpag.2010.07.002. [DOI] [PMC free article] [PubMed] [Google Scholar]
- 11.Farage M, Maibach H. Lifetime changes in the vulva and vagina. Arch Gynecol Obstet. 2006;273(4):195–202. doi: 10.1007/s00404-005-0079-x. [DOI] [PubMed] [Google Scholar]
- 12.Ayre WB. The glycogen-estrogen relationship in the vaginal tract. J Clin Endocrinol Metab. 1950;11(1):103–110. doi: 10.1210/jcem-11-1-103. [DOI] [PubMed] [Google Scholar]
- 13.Willson J, Goforth ML. Effects of an excess of ingested carbohydrate upon the glycogen content of vaginal epithelium. J Clin Endocrinol Metab. 1942;2(4):223–225. [Google Scholar]
- 14.Gregoire AT, Kandil O, Ledger WJ. The glycogen content of human vaginal epithelial tissue. Fertil Steril. 1971;22(1):64–68. doi: 10.1016/s0015-0282(16)37989-4. [DOI] [PubMed] [Google Scholar]
- 15.Mirmonsef P, Gilbert D, Veazey RS, Wang J, Kendrick SR, Spear GT. A Comparison of Lower Genital Tract Glycogen and Lactic Acid Levels in Women and Macaques: Implications for HIV and SIV Susceptibility. AIDS Res Hum Retroviruses. 2011 doi: 10.1089/aid.2011.0071. [DOI] [PMC free article] [PubMed] [Google Scholar]
- 16.Mirmonsef P, Spear GT. The Barrier to HIV Transmission Provided by Genital Tract Lactobacillus Colonization. Am J Reprod Immunol. 2014 doi: 10.1111/aji.12232. [DOI] [PubMed] [Google Scholar]
- 17.Mirmonsef P, Hotton AL, Gilbert D, et al. Free Glycogen in Vaginal Fluids Is Associated with Lactobacillus Colonization and Low Vaginal pH. PLoS One. 2014;9(7):e102467. doi: 10.1371/journal.pone.0102467. [DOI] [PMC free article] [PubMed] [Google Scholar]
- 18.Antonio MA, Hawes SE, Hillier SL. The identification of vaginal Lactobacillus species and the demographic and microbiologic characteristics of women colonized by these species. J Infect Dis. 1999;180(6):1950–1956. doi: 10.1086/315109. [DOI] [PubMed] [Google Scholar]
- 19.Eschenbach DA, Davick PR, Williams BL, et al. Prevalence of hydrogen peroxide-producing Lactobacillus species in normal women and women with bacterial vaginosis. J Clin Microbiol. 1989;27(2):251–256. doi: 10.1128/jcm.27.2.251-256.1989. [DOI] [PMC free article] [PubMed] [Google Scholar]
- 20.Hillier SL, Nugent RP, Eschenbach DA, et al. Association between bacterial vaginosis and preterm delivery of a low-birth-weight infant. The Vaginal Infections and Prematurity Study Group [see comments] N Engl J Med. 1995;333(26):1737–1742. doi: 10.1056/NEJM199512283332604. [DOI] [PubMed] [Google Scholar]
- 21.Hillier SL, Krohn MA, Klebanoff SJ, Eschenbach DA. The relationship of hydrogen peroxide-producing lactobacilli to bacterial vaginosis and genital microflora in pregnant women. Obstet Gynecol. 1992;79(3):369–373. doi: 10.1097/00006250-199203000-00008. [DOI] [PubMed] [Google Scholar]
- 22.Amsel R, Totten PA, Spiegel CA, Chen KC, Eschenbach D, Holmes KK. Nonspecific vaginitis. Diagnostic criteria and microbial and epidemiologic associations. Am J Med. 1983;74(1):14–22. doi: 10.1016/0002-9343(83)91112-9. [DOI] [PubMed] [Google Scholar]
- 23.Fredricks DN, Fiedler TL, Thomas KK, Mitchell CM, Marrazzo JM. Changes in vaginal bacterial concentrations with intravaginal metronidazole therapy for bacterial vaginosis as assessed by quantitative PCR. J Clin Microbiol. 2009;47(3):721–726. doi: 10.1128/JCM.01384-08. [DOI] [PMC free article] [PubMed] [Google Scholar]
- 24.Srinivasan S, Liu C, Mitchell CM, et al. Temporal variability of human vaginal bacteria and relationship with bacterial vaginosis. PLoS One. 2010;5(4):e10197. doi: 10.1371/journal.pone.0010197. [DOI] [PMC free article] [PubMed] [Google Scholar]
- 25.Danielsson D, Teigen PK, Moi H. The genital econiche: focus on microbiota and bacterial vaginosis. Ann N Y Acad Sci. 2011;1230:48–58. doi: 10.1111/j.1749-6632.2011.06041.x. [DOI] [PubMed] [Google Scholar]
- 26.Coelingh Bennink HJ. Are all estrogens the same? Maturitas. 2004;47(4):269–275. doi: 10.1016/j.maturitas.2003.11.009. [DOI] [PubMed] [Google Scholar]
- 27.Owen JA., Jr Physiology of the menstrual cycle. Am J Clin Nutr. 1975;28(4):333–338. doi: 10.1093/ajcn/28.4.333. [DOI] [PubMed] [Google Scholar]
- 28.Gajer P, Brotman RM, Bai G, et al. Temporal dynamics of the human vaginal microbiota. Sci Transl Med. 2012;4(132):132ra52. doi: 10.1126/scitranslmed.3003605. [DOI] [PMC free article] [PubMed] [Google Scholar]
Associated Data
This section collects any data citations, data availability statements, or supplementary materials included in this article.