

Abstract
The role of plasma pharmacokinetics (PK) for assessing bioequivalence at the target site, the lung, for orally inhaled drugs remains unclear. A validated semi-mechanistic model, considering the presence of mucociliary clearance in central lung regions, was expanded for quantifying the sensitivity of PK studies in detecting differences in the pulmonary performance (total lung deposition, central-to-peripheral lung deposition ratio, and pulmonary dissolution characteristics) between test (T) and reference (R) inhaled fluticasone propionate (FP) products. PK bioequivalence trials for inhaled FP were simulated based on this PK model for a varying number of subjects and T products. The statistical power to conclude bioequivalence when T and R products are identical was demonstrated to be 90% for approximately 50 subjects. Furthermore, the simulations demonstrated that PK metrics (area under the concentration time curve (AUC) and Cmax) are capable of detecting differences between T and R formulations of inhaled FP products when the products differ by more than 20%, 30%, and 25% for total lung deposition, central-to-peripheral lung deposition ratio, and pulmonary dissolution characteristics, respectively. These results were derived using a rather conservative risk assessment approach with an error rate of <10%. The simulations thus indicated that PK studies might be a viable alternative to clinical studies comparing pulmonary efficacy biomarkers for slowly dissolving inhaled drugs. PK trials for pulmonary efficacy equivalence testing should be complemented by in vitro studies to avoid false positive bioequivalence assessments that are theoretically possible for some specific scenarios. Moreover, a user-friendly web application for simulating such PK equivalence trials with inhaled FP is provided.
Electronic supplementary material
The online version of this article (doi:10.1208/s12248-015-9768-y) contains supplementary material, which is available to authorized users.
Key words: bioequivalence, inhaled corticosteroids, pharmacokinetics, pharmacometrics, trial simulation
INTRODUCTION
Inhaled corticosteroids remain to play a central role in the management of asthma and chronic obstructive pulmonary disease (COPD) (1,2). The availability of safe, efficacious, and affordable generic inhaled corticosteroids is crucial for reducing the increasing financial burden for the health care systems (3). Demonstration of bioequivalence is a key element for registration of generic drugs. For orally administered systematically acting drug, bioequivalence is usually demonstrated by comparing the plasma concentration time profile (plasma pharmacokinetics (PK)) of the generic (test; T) with that of the brand name (reference; R) product (4). It usually suffices to demonstrate that the 90% confidence interval for the T/R ratios for the area under the concentration time curve (AUC) and the maximum plasma concentration (Cmax) are contained within the bioequivalence acceptance limits of 80%–125% (4,5). For inhaled corticosteroids and other orally inhaled locally acting drug products, however, where plasma concentrations are measured downstream of the lung (site of action) a different approach has been suggested by regulatory agencies for assessing bioequivalence (6–12).
Draft guidelines containing recommendations for demonstrating bioequivalence of inhaled corticosteroids fluticasone propionate (FP) and other orally inhaled drug products (OIDPs) have been published by the US Food and Drug Administration (FDA) and the European Medicines Agency (EMA), respectively (6,7). Noteworthy, the FDA and EMA guidelines are quite opposite to each other in their approaches to establishing bioequivalence. In particular, the role of plasma PK for demonstrating bioequivalence of inhaled corticosteroids remains unclear. The EMA guideline allows establishing bioequivalence solely on plasma PK and thereby even gives the possibility to overrule a potential negative outcome in an in vitro equivalence assessment. On the other hand, the FDA guideline suggests that plasma PK is suitable for establishing an equivalent systemic safety profile while not for establishing an equivalent pulmonary efficacy profile. The FDA’s rationale for requesting clinical studies is that they believe that current scientific knowledge is not sufficient to provide evidence that in vitro and pharmacokinetic studies are able to ensure an equivalent pulmonary efficacy profile. While this approach at first makes sense, problems arise because of the existing lack of sensitive pulmonary efficacy biomarkers (lack of dose response relationship) for some inhaled drugs, especially for inhaled corticosteroids.
We had hypothesized that the array of methods employed for assessing bioequivalence of locally acting OIDPs must be able to answer the following three questions (8) irrespective of the compound (e.g., fast or slowly dissolving) and the form of administration (e.g., dry powder inhaler or metered dose inhaler).
Are T and R products equivalent in
How much drug is deposited in/available to the lung? (total lung deposition)
How long the drug stays in the lung? (lung residence time)
Where in the lung is the drug deposited? (Central-to-peripheral lung deposition ratio)
In the first question, drug that is available to the lung refers to all drug molecules that are deposited in the lung and reach the systemic circulation via the lung (excluding drug molecules that undergo pulmonary metabolism or (mucociliary) clearance). In the second question, pulmonary residence time comprises all pulmonary processes that could occur after deposition in the lung including dissolution and absorption.
Assuming that drug enters the systemic circulation only from the lung (drugs exhibiting oral bioavailability can be blocked by co-administration of charcoal), PK studies are expected to be able to answer question one and two with much higher resolution than clinical studies (8). We hypothesized that, for lipophilic slow-dissolving drugs, PK studies should also be able to detect differences in the central-to-peripheral lung deposition ratio, considering that more centrally deposited drug will be cleared from the drug more efficiently through mucociliary clearance than more peripherally deposited drug where mucociliary clearance is reduced. Thus, a T product that delivers the same dose to the lung as the R product but deposits more of the drug peripherally, more drug will be absorbed into the systemic circulation and, consequently, the total systemic exposure (AUC) of the T should be larger than that of the R product. Vice versa, the same holds true for a T product that deposits the same dose more centrally.
Hence, it was the objective of this project, building on a previous established and validated semi-mechanistic PK model for simulating the performance of inhaled FP formulations (13), to systematically evaluate the sensitivity of the plasma PK metrics (AUC and Cmax) to detect differences in the pulmonary fate of inhaled FP when T and R products differed from each other in a single or multiple pulmonary performance-related parameters (total lung deposition, pulmonary dissolution characteristics, and central-to-peripheral lung deposition ratio), while considering variability between and within patients. FP was selected as a model drug since it is a slowly dissolving inhaled corticosteroid and a validated model for PK trial simulation was readily available (13). Moreover, a user-friendly web application was developed that enables the users to simulate PK bioequivalence trials for inhaled FP for different number of subjects, pulmonary performance parameters, and variability terms (http://coplin6.cop.ufl.edu:3838/ifp/). Additionally, a second version of the web application where users can simulate bioequivalence trials for any inhaled drugs by selecting their own parameters is available. (http://coplin6.cop.ufl.edu:3838/inhaled/).
METHODS
A Monte Carlo simulation approach was applied to systematically investigate the impact of differences in the pulmonary performance of T and R inhalers on the plasma concentration time profiles (evaluated as AUC and Cmax). Bioequivalence PK trials in which T FP inhalers were compared with the FP Diskus inhaler (R product) were simulated in a single-dose crossover design for a varying number of subjects (assumed to be healthy volunteers). Within the simulations, the T FP inhalers differed from the R FP inhaler in their total lung deposition, their central-to-peripheral lung deposition ratio, and/or their pulmonary dissolution characteristics. For each scenario (characterized by the total lung deposition, the central-to-peripheral lung deposition ratio, and the pulmonary dissolution characteristics of the T inhaler as well as the number of subjects enrolled in the trial), 200 independent PK trials were simulated and the percent of trials that resulted in successful demonstration of bioequivalence were recorded. Details about the underlying PK model, the PK trial simulation, the statistical analysis, and the bioequivalence criteria are given below.
Pharmacokinetic Model
Monte Carlo simulation of PK bioequivalence trials after FP inhalation was based on a previously published model that was specifically designed for simulating PK trials after administration of inhaled corticosteroids (13). The model incorporates physiological and anatomical features of the lung (e.g., distinction of central and peripheral regions, mucociliary clearance of undissolved particles from central lung regions, and different absorption characteristics for central and peripheral lung regions) and accounts for variability between and within subjects (Fig. 1). Central lung regions are distinguished from peripheral lung regions by the presence of a mucociliary escalator. Absorption of dissolved drug from peripheral lung regions is assumed to be twice as fast as from central lung regions. Pulmonary dissolution of deposited FP particles is assumed to be the same in central and in peripheral lung regions. The model, the selection of the model parameters, and its performance were previously discussed and validated by comparing predicted with clinically observed plasma concentration for four inhaled corticosteroids including FP (13). Furthermore, the key aspects of the model structure are again critically debated in the “Discussion” section.
Fig. 1.
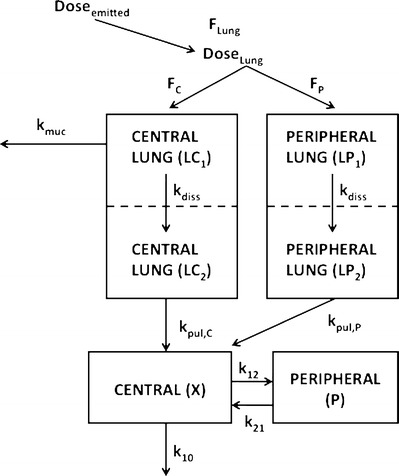
Compartment model characterizing the fate of inhaled FP, F Lung fraction of the emitted dose that is deposited in the lung; F C fraction of the lung dose that is deposited in central regions of the lung (LC1); F P fraction of the lung dose that is deposited in peripheral regions of the lung (LP1); LC2 and LP2 Compartments representing central and peripheral lung regions, respectively, where the drug is dissolved; k muc mucociliary clearance; k diss dissolution of drug particles; k pul,C drug absorption from central lung regions into the systemic circulation (central body compartment); k pul,P drug absorption from peripheral lung regions into the systemic circulation; k 12, k 21 drug distribution between central and peripheral body compartments; k 10 drug elimination from the systemic circulation: all rate constants (k) were assumed to be first-order processes. Further details about the model are published elsewhere (13)
For the purpose of simulating bioequivalence trials, the published model was extended to allow simulating crossover designs and between-occasion variability (BOV). Between-occasion variability was included as the following (exemplarily shown for model parameters that are log-normally distributed)
where Xij represents the value of model parameter X for subject i at occasion j, θx represents the typical value of parameter X, ηi represents a normally distributed random variable with mean equal to zero and standard deviation equal to ωx, and ρj represents a normally distributed random variable with mean equal to zero and standard deviation equal to ξx. ωx and ξx represent variability between subjects and occasions, respectively. Moreover, a logit transformation was applied to model parameters that are naturally bound between 0 and 1 (fraction of the emitted dose that is deposited in the lung (FLung) and fraction of the lung dose deposited in central lung regions (FC)). Further details of the structural and random effects model can be found in the original publication (13).
Pharmacokinetic Trial Simulation
PK trial simulations were performed in R version 3.0.2 (14). Three series of trial simulations were performed to allow systematic investigation of the sensitivity of AUC and Cmax to detect differences in the pulmonary fate between T and R inhalers. First, identical T and R inhalers were compared to determine the sample size (number of subjects enrolled) that is needed to achieve a statistical power of 90% for concluding bioequivalence when T and R are the same. In a second series, scenarios where T and R inhalers that differed from each other in only one of the three parameters characterizing their pulmonary performance (FLung, FC, and pulmonary dissolution rate (kdiss)) were simulated. It should be noted that FC is easily transformed into central-to-peripheral lung deposition ratio by taking FC/(1 − FC). In a third series, scenarios where T and R inhalers that differed from each other in all three pulmonary performance parameters were simulated. In this step, not only the sensitivity of AUC and Cmax to detect differences in the pulmonary performance between T and R inhalers was determined but also cases identified where two very different products could lead to similar plasma profiles.
Series 1: Two Identical Products
Scenarios where both T and R FP inhalers represented the FP Diskus inhaler were simulated in a crossover design for 10, 20, 30, 40, 50, 60, and 70 subjects. These scenarios, which can be interpreted as testing different lots of the R product against each other, were used to determine the sample size that is needed to achieve a statistical power of 90% to conclude bioequivalence when T and R are identical. Table I lists the model parameters including associated variability terms that characterize the PK of the FP Diskus inhaler. Between-subject variability (BSV) and residual variability terms (RV) were taken from the previously published validated model for FP (13). Between-occasion variability (BOV) terms were based on educated guesses and preliminary simulations where the variability in AUC and Cmax (coefficient of variation ∼50%) that is typically observed in clinical trials (15–18) was matched (see “Discussion”). It should be noted that the outcome of the bioequivalence trials is independent of the selection of the BSV terms as the trials are simulated in a crossover design. In addition, the web application that is available as supplemental material to this article allows simulating PK bioequivalence trials for FP with user-defined RV and BOV terms. Plasma concentrations were predicted for 0.25, 0.5, 0.75, 1, 1.5, 2, 3, 4, 5, 6, 8, 10, 12, 24, 36, and 48 h after drug administration that closely mimics a standard sampling schedule for single dose PK trials of inhaled drugs.
Table I.
Model Parameters for the R Product Representing the FP Diskus Inhaler
| Parameter | Typical value | Between-subject variability (CV) (%) | Between-occasion variability (CV%) |
|---|---|---|---|
| F Lung | 0.16 | 30 | 30 |
| F C | 0.5 | 30 | 30 |
| k diss (h−1) | 0.189 | 30 | – |
| k muc (h−1) | 0.938 | 30 | 30 |
| k pul,C (h−1) | 10 | 30 | – |
| k pul,P (h−1) | 20 | 30 | – |
| CL (L/h) | 73 | 30 | – |
| V C (L) | 31 | 30 | – |
| k 12 (h−1) | 1.78 | 30 | – |
| k 21 (h−1) | 0.09 | 30 | – |
Typical value parameters are based on (13). Residual variability was 20%. CV is coefficient of variation. Between-subject and between-occasion variability (BOV) parameters are based on educated guesses and were selected to match variability in AUC and C max (coefficient of variation ∼50%) that was observed in literature (15–18). To give the simulations a more realistic framework, BOV terms were considered for F Lung, F C, and k muc as they represent pulmonary parameters that may be expected to vary between occasions that are one week apart (typical timeframe for bioequivalence study including a washout period). For instance, device handling and performance of inhalation procedure may affect F Lung and F C. It should be remarked that the outcome of a two-way crossover study cannot distinguish between occasion from residual variability. Thus, all other parameters were not assumed to vary between occasions for model simplicity. The application that is available as supplemental material to this article allows simulating FP PK crossover trials with user-defined variability parameters (residual and between-occasion variability).
Series 2: Two Different Inhalers—Single-Parameter Differences
Scenarios where T and R FP inhalers differed from each other in one of the three parameters characterizing their pulmonary performance were simulated in a crossover design for 50, 100, and 200 subjects. A sample size of 50 was selected as simulation series one had indicated it as adequate for achieving a statistical power of 90% to conclude bioequivalence when T and R are identical. Sample sizes of 100 and 200 subjects were selected to investigate the sensitivity of AUC and Cmax for increased sample sizes. In all scenarios, the model parameters for the R product were selected to represent the FP Diskus inhaler. The model parameters (typical parameters) characterizing the pulmonary performance (FLung, FC, and kdiss) were 0.16, 0.5, and 0.189 h−1, respectively. All other model parameters including their associated variability terms are given in Table I. The T products differed across all the scenarios in their model parameters characterizing pulmonary performance while all other parameters were identical to those of the R product. Twenty different values (−50% to 50% difference in 5% steps compared to respective values of the reference product) were used for each of three parameters to create 60 different T inhalers. The exact parameter values for the 60 T products are given in Table II and the Supplemental Material. Since each of the 60 T products was compared with the R product for a sample size of 50, 100, and 200 subjects, a total of 180 scenarios where evaluated in this simulation series. BSV, RV, BOV terms and sampling times were identical to those in the first step.
Table II.
Results of Scenarios Where T and R Products Differed from Each Other in One of the Three Pulmonary Performance Parameters (F Lung, F C, k diss)
| Parameter T product | Parameter value | Difference T/R (%) | AUC T/R PE | C max T/R PE | BE 50 (%) | BE 100 (%) | BE 200 (%) |
|---|---|---|---|---|---|---|---|
| F Lung | 0.128 | −20 | 0.803 | 0.802 | 5.5 | 4.5 | 3.5 |
| 0.136 | −15 | 0.851 | 0.852 | 21.5 | 35.5 | 58.5 | |
| 0.144 | −10 | 0.9 | 0.9 | 62.5 | 91 | 99 | |
| 0.152 | −5 | 0.95 | 0.949 | 87 | 98.5 | 100 | |
| 0.168 | 5 | 1.05 | 1.05 | 88.5 | 100 | 100 | |
| 0.176 | 10 | 1.1 | 1.1 | 63.5 | 88 | 99.5 | |
| 0.184 | 15 | 1.15 | 1.15 | 32 | 54 | 83 | |
| 0.192 | 20 | 1.2 | 1.19 | 11 | 17.5 | 38 | |
| 0.2 | 25 | 1.25 | 1.25 | 3 | 4.5 | 2.5 | |
| 0.208 | 30 | 1.3 | 1.3 | 1 | 0.5 | 0 | |
| F C | 0.3 | −40 | 1.28 | 1.1 | 2.5 | 0.5 | 0.5 |
| 0.325 | −35 | 1.25 | 1.09 | 6 | 6 | 6 | |
| 0.35 | −30 | 1.21 | 1.08 | 18 | 23 | 31 | |
| 0.375 | −25 | 1.17 | 1.06 | 31 | 44 | 75.5 | |
| 0.4 | −20 | 1.14 | 1.05 | 50.5 | 75.5 | 94.5 | |
| 0.425 | −15 | 1.1 | 1.04 | 73 | 95.5 | 99.5 | |
| 0.45 | −10 | 1.07 | 1.02 | 86 | 99.5 | 100 | |
| 0.475 | −5 | 1.03 | 1.01 | 92.5 | 100 | 100 | |
| 0.5 | 0 | 1 | 0.999 | 93.5 | 100 | 100 | |
| 0.525 | 5 | 0.965 | 0.988 | 95 | 100 | 100 | |
| 0.55 | 10 | 0.933 | 0.98 | 82.5 | 99.5 | 100 | |
| 0.575 | 15 | 0.9 | 0.97 | 65 | 91.5 | 99 | |
| 0.6 | 20 | 0.86 | 0.952 | 40 | 54.5 | 79.5 | |
| 0.625 | 25 | 0.828 | 0.944 | 15.5 | 21 | 31 | |
| 0.65 | 30 | 0.793 | 0.932 | 1.5 | 2 | 2.5 | |
| k diss (1/h) | 0.142 | −25 | 0.958 | 0.767 | 0 | 1 | 0 |
| 0.151 | −20 | 0.969 | 0.817 | 14.5 | 14.5 | 17.5 | |
| 0.161 | −15 | 0.976 | 0.864 | 34 | 59.5 | 83 | |
| 0.17 | −10 | 0.984 | 0.908 | 71 | 95.5 | 100 | |
| 0.18 | −5 | 0.993 | 0.953 | 92 | 99.5 | 100 | |
| 0.189 | 0 | 1 | 0.999 | 93.5 | 100 | 100 | |
| 0.198 | 5 | 1.01 | 1.04 | 93 | 100 | 100 | |
| 0.208 | 10 | 1.02 | 1.09 | 73.5 | 92.5 | 100 | |
| 0.217 | 15 | 1.02 | 1.14 | 49 | 72.5 | 92 | |
| 0.227 | 20 | 1.02 | 1.17 | 27 | 43 | 70.5 | |
| 0.236 | 25 | 1.03 | 1.22 | 12.5 | 18 | 19.5 | |
| 0.246 | 30 | 1.04 | 1.26 | 1 | 1.5 | 2 | |
| 0.255 | 35 | 1.04 | 1.31 | 1 | 0 | 0 |
PE point estimate (average across the 200 trials). BE x percent of 200 bioequivalence trials conducted with x subjects (50, 100 or 200) that resulted in pass. Scenarios where none of the 200 bioequivalence trials results in pass are not included.
Series 3: Two Different Inhalers—Multiple Parameter Differences
Scenarios where T and R FP inhalers differed from each other in all three parameters characterizing their pulmonary performance were simulated in a crossover design for 50, 100, and 200 subjects. In all scenarios, the model parameters for the R product were the same as in simulation series two. The T products differed across all the scenarios in their model parameters characterizing pulmonary performance (FLung, FC, and kdiss) while all other parameters were identical to those of the R product. Seven different values (−60% to 60% difference in 20% steps compared to respective values of reference product) for FLung, FC, and kdiss were selected to create 343 different T products. Since each of the 343 T products was compared with the R product for a sample size of 50, 100, and 200 subjects, a total of 1029 scenarios where evaluated in this simulation series. BSV, RV, BOV terms and sampling times were identical to those in first and second part.
Statistical Analysis
For each scenario, 200 independent PK trials were simulated and 90% confidence intervals for the T/R ratios for AUC1 and Cmax were calculated applying an ANOVA model accounting for treatment, period, sequence, and subject within sequence effects (5). When both 90% confidence intervals for the T/R ratios for AUC and Cmax fell into the acceptance range of 80%–125%, a successful bioequivalence trial was concluded (“pass”). Otherwise, a failed bioequivalence trial was concluded (“fail”). As a primary outcome, the percent of the 200 independent trials that resulted in a pass was recorded for each scenario that was evaluated. In addition, the pass/fail assessment was performed separately for Cmax and AUC for testing the sensitivity of both metrics to detect differences in the pulmonary performance of T and R products. Further reported outcomes comprise the average (across the 200 independent trials) point estimate and lower and upper bounds of the 90% confidence intervals for the T/R ratio for AUC and Cmax for all tested scenarios.
Development of Web Applications
The interactive web applications that allow the users to simulate PK bioequivalence trials using their own parameters were developed based on the R extension package “Shiny” (19). The Shiny package offers a simple way of turning R scripts into user-friendly web applications without requiring any web development skills. Shiny base web applications require two R scripts. The “ui” and the “server” files define the user interface and the underlying computations, respectively. More details including a tutorial are available at http://shiny.rstudio.com/.
RESULTS
A comprehensive numerical summary of the results for all scenarios that were evaluated is provided in the electronically available supplemental material (Results_All_Simulations.xlsx). These include percent of PK trials that resulted in a pass based on both AUC and Cmax, percent of PK trials that resulted in a pass based on AUC0–48, percent of PK trials that resulted in a pass based on Cmax, average point estimate, and lower and upper bounds of the 90% confidence intervals for the T/R ratio for AUC0–48 and Cmax.
Series 1: Two Identical Products
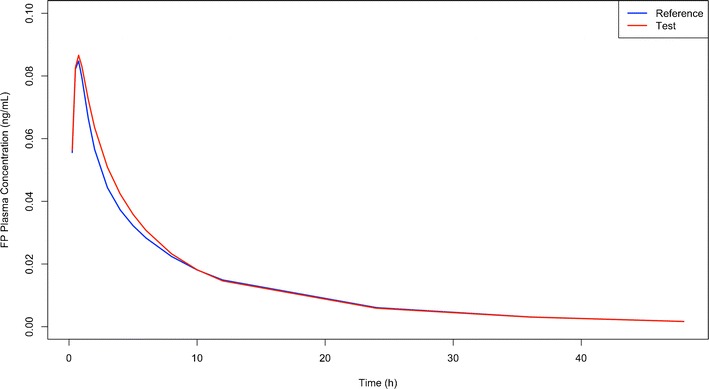
When T and R FP inhalers represented the FP Diskus inhaler (i.e., testing different lots of the R product against each other), the percent of 200 PK trials that resulted in a pass (i.e., the power of concluding bioequivalence when the inhalers are indeed identical) were 7.0%, 38.5%, 70.5%, 91.0%, 92.0%, 99.5%, and 99.5% for 10, 20, 30, 40, 50, 60, and 70 subjects, respectively. Typical PK profiles for T and R formulations in 50 volunteers are shown in Fig. 2. The average half-width of the confidence intervals for AUC and Cmax were ±22.7%, 15.6%, 12.5%, 10.8%, 9.59%, 8.69%, and 8.17% for 10, 20, 30, 40, 50, 60, and 70 subjects, respectively.
Fig. 2.
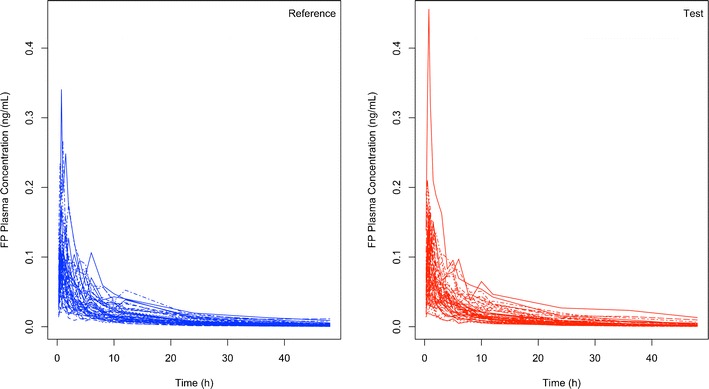
Example of simulated FP plasma concentration time profiles (n = 50 subjects) when T (red; right panel) and R (blue; left panel) products are identical thus representing the case when testing different batches of the reference product against each other
Series 2: Two Different Inhalers—Single Parameter Differences
The results (percent of trials resulting in a pass for 50, 100, and 200 subjects and point estimates for the T/R ratio for AUC and Cmax) of the scenarios where T and R products differed from each other in one of the three pulmonary performance parameters are summarized in Table II and visually presented in Fig. 3.
Fig. 3.
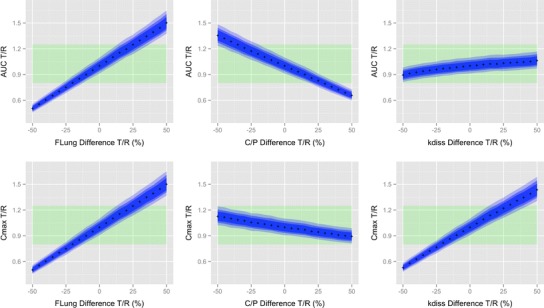
Sensitivity of AUC and C max to detect differences between T and R inhaler that differed from each other in one of the three pulmonary performance parameters (F Lung, C/P (F C/(1 − F C)) and k diss). Top three panels AUC. Bottom three panels C max. The x-axes show the difference between the T and R product in the respective parameters. The crosses represent the point estimates for the AUC or C max T/R ratio based on the simulations with 200 subjects. The blue shaded areas represent 90% confidence intervals for AUC or C max T/R ratio (dark blue 200 subjects, intermediate blue 100 subjects, light blue 50 subjects). Point estimates and confidence intervals were averaged over the 200 independent trials that were simulated for each scenario. Green shaded area represents the 80%–125% acceptance region for bioequivalence testing
Series 3: Two Different Inhalers—Multiple Parameter Differences
Figure 4 provides a three-dimensional visualization of the sensitivity of AUC and Cmax combined to detect differences in the pulmonary fate when T and R products differ from each other in multiple parameters. Table III lists all scenarios where bioequivalence was concluded in more than 90% of 200 PK trials when the sample size was 200 subjects despite T and R products being different in at least two of the three pulmonary performance parameters. In those 17 scenarios, T and R inhalers produced very similar plasma concentration time profiles in spite of them differing in all three pulmonary performance parameters. Figure 5 visualizes the plasma concentration time profiles of one of those 17 scenarios exemplarily. Those 17 scenarios are also visible in Fig. 4 whenever a peak (i.e., an increased percentage of trials indicating bioequivalence) is observed when T and R are different. An explanation for this ostensible insensitivity and possible workaround is provided in the “Discussion” section.
Fig. 4.
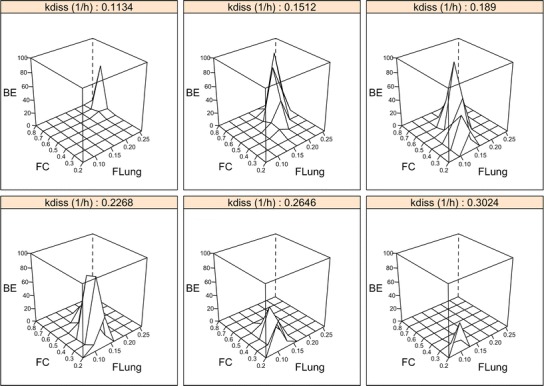
Sensitivity of AUC and C max (combined). Results of the simulated PK bioequivalence trials for 50 subjects; BE percent of 200 independent PK trials that resulted in a pass; F Lung fraction of the emitted dose that is deposited in the lung; F C fraction of the lung dose that is deposited in central lung regions. k diss dissolution rate constant. An explanation for the (double-) peaks (i.e., increased percentage of trials indicating bioequivalence) when T and R are different from each other is provided in the “Discussion” section
Table III.
Scenarios Where T and R Products Differed in More than One Parameter (k diss, F Lung, F C) and Bioequivalence was Concluded in at Least 90% of 200 PK Trials with 200 Subjects. F Lung, F C, and k diss Refer to the T Product
| F Lung | F C | k diss (1/h) | F Lung T/R (%) | F C T/R (%) | k diss T/R (%) | AUC T/R PE | C max T/R PE | BE 50 (%) | BE 100 (%) | BE 200 (%) |
|---|---|---|---|---|---|---|---|---|---|---|
| 0.096 | 0.2 | 0.265 | −40 | −60 | 40 | 0.871 | 0.927 | 41 | 65 | 91 |
| 0.096 | 0.2 | 0.302 | −40 | −60 | 60 | 0.878 | 1.04 | 43 | 78.5 | 94 |
| 0.128 | 0.2 | 0.189 | −20 | −60 | 0 | 1.14 | 0.927 | 29.5 | 68.5 | 94.5 |
| 0.128 | 0.2 | 0.227 | −20 | −60 | 20 | 1.15 | 1.08 | 43.5 | 63.5 | 90.5 |
| 0.128 | 0.3 | 0.189 | −20 | −40 | 0 | 1.02 | 0.88 | 44 | 76 | 93.5 |
| 0.128 | 0.3 | 0.227 | −20 | −40 | 20 | 1.04 | 1.03 | 90.5 | 100 | 100 |
| 0.128 | 0.4 | 0.227 | −20 | −20 | 20 | 0.928 | 0.984 | 85 | 98.5 | 100 |
| 0.128 | 0.4 | 0.265 | −20 | −20 | 40 | 0.944 | 1.13 | 41.5 | 74.5 | 96 |
| 0.16 | 0.6 | 0.227 | 0 | 20 | 20 | 0.89 | 1.13 | 20 | 67.5 | 93.5 |
| 0.192 | 0.6 | 0.151 | 20 | 20 | −20 | 0.988 | 0.931 | 78.5 | 96.5 | 100 |
| 0.192 | 0.6 | 0.189 | 20 | 20 | 0 | 1.03 | 1.15 | 45 | 70.5 | 91 |
| 0.224 | 0.7 | 0.151 | 40 | 40 | −20 | 0.953 | 1.04 | 88.5 | 99 | 100 |
| 0.256 | 0.7 | 0.113 | 60 | 40 | −40 | 1.01 | 0.902 | 64.5 | 89.5 | 100 |
PE point estimate (average across the 200 trials). BE x percent of 200 bioequivalence trials conducted with x subjects that resulted in pass
Fig. 5.
Plasma concentration time profiles (average) for a test product with the pulmonary performance parameters F Lung = 0.128, F C = 0.3, and k diss = 0.2268 and a reference product that represents the FP diskus inhaler with F Lung = 0.16, F C = 0.5, and k diss = 0.189
DISCUSSION
We hypothesized that PK bioequivalence studies are more sensitive and robust than clinical studies for assessing pulmonary bioequivalence of lipophilic, slowly dissolving OIDPs. For these products, plasma PK metrics (AUC and Cmax) should be able to detect differences between T and R formulations in factors relevant for pulmonary equivalence for the following reasons. As outlined in the introduction, three factors should theoretically affect the pulmonary equivalence of OIDPs: the deposited dose, the time the drug resides in the lung, and the regional (central vs. peripheral lung regions) deposition. When slowly dissolving drugs are preferentially deposited in central parts of the lung, more drug particles will be removed through mucociliary clearance and less drug will be absorbed from the lung than from formulations that deposited more peripherally. This sensitivity to detect differences in central vs. peripheral deposition does not occur for fast dissolving drugs that are absorbed or enter pulmonary cells before they can be removed by mucociliary clearance. Thus, the conclusions drawn from the presented simulations will be only applicable to slowly dissolving drugs whose oral bioavailability is negligible or can be prevented by co-administration of charcoal. FP is such a drug candidate and was selected for the simulations, as in addition, a validated model for simulating PK trials after inhalation was available (13).
A Monte Carlo simulation-based, semi-mechanistic approach was employed to systematically assess the sensitivity of the plasma PK metrics AUC and Cmax to determine the pulmonary bioequivalence of FP for a hypothetical T and R (FP diskus) product. This modeling approach, rather than a deterministic model (20), was used as only approaches considering variability between and within subjects for a given number of volunteers can predict the outcome of such bioequivalence studies, including the effects of the sample size.
The simulations incorporated a model (Fig. 1) previously developed for simulating the outcome of PK studies for four inhaled corticosteroids including FP in healthy volunteers (13). Typical values and BSV and RV parameters were taken from the previously published model as the model was validated by comparing model predicted to clinically observed plasma concentrations (13). BOV terms were added to the model to allow simulating PK bioequivalence studies, which are usually conducted in a crossover design. Since BOV estimates for parameters representing pulmonary deposition (FLung and FC) are not available in literature, educated guesses were used and optimized by comparing results (AUC and Cmax) from preliminary simulations to observed data (15–18). Moreover, the model predicted width of the confidence intervals for T/R ratios for AUC and Cmax (approximately ±10% for a sample size of 40–60 subjects; see “Results” section) agree very well with those from published PK bioequivalence trials for inhaled drugs (21–23).
The simulations for different T and R formulations were performed for sample sizes of 50, 100, and 200 subjects. The sample size of 50 was selected since preliminary power calculations based on published PK studies had shown that approximately 40–50 subjects (in a crossover design and assuming the variability displayed in Table I) are required for demonstrating equivalence with a statistical power of 90% when T and R products are indeed the same and the R product represents FP diskus inhaler. This basically represents the case where different batches of the R product are tested against each other. The increased sample sizes of 100 and 200 subjects were selected to provide an analysis of the sensitivity of AUC and Cmax when the power for concluding equivalence (in the case of equivalent products) or the probability of falsely concluding equivalence (when the products are not equivalent) are increased. As the power was only slightly increased with 100 or 200 subjects, one can conclude that 50 subjects seem to be sufficient for testing bioequivalence under these conditions.
First, the simulations were used to quantify the effect of an increasing number of subjects on the statistical power to conclude bioequivalence when two identical formulations (R vs. R; see “Results”) were compared against each other. These simulations indicated that FP diskus bioequivalence studies using 40–60 subjects would suffice to conclude bioequivalence with a statistical power of 90%. These predictions are quite in agreement with published literature (21,23). When T and R products differed in their lung deposition (extent of bioavailability, (Table II and Fig. 3) in a group of 50 volunteers by more than 20% (e.g., 25% in our simulations), the probability of incorrectly concluding equivalence was smaller than 10%. Interestingly, a sample size of 50 subjects was predicted to result in a statistical power of 90% to conclude bioequivalence when T and R products are indeed the same. If the pulmonary dissolution rate, as a measure of the rate with which the drug is available differed by more than 25% (e.g., 30% in our simulations), the probability of falsely concluding equivalence was smaller than 10%. (Table II), suggesting that PK is somewhat less sensitive to detect a difference in dissolution rate than dose differences. The ability of PK to detect differences in the extent and rate with which the drug is available at the site of action, the lung, is relatively easy to comprehend for OIDPs with negligible oral bioavailability or under conditions where oral bioavailability can be suppressed (e.g., through charcoal co-administration). All the drug molecules entering the systemic circulation (assuming zero oral bioavailability) have to diffuse through the lung tissue (the site of action). Hence, systemic plasma AUC and Cmax of T and R will only be equivalent if the drug exposure within the lung (amount of pulmonary available/dissolved drug) and the rate with which it was made pulmonary available are equivalent. The fact that the actual concentrations might be different in lung and blood is of no relevance, as potential differences in the amount of drug available to the lung affect in a linear fashion the plasma AUC. Thus, plasma PK can detect differences in the extent and rate the at which dissolved drug is available at the site of action. Cut-off values, provided as a sensitivity measure, defined in this publication for single factor differences in deposited dose and absorption rate would be identical to oral formulations with similar variability.
Table II and Fig. 3 also indicate that PK metrics are sensitive to differences in the central-to-peripheral lung deposition ratio if the difference in this ratio is larger than 30% (e.g., 35% in our simulations). For such differences. the probability of falsely concluding equivalence was less than 10%. This supports the hypothesis that for slowly dissolving drugs PK can probe for regional differences in deposition. The use of an error rate of at most 10% for assessing the risk of concluding bioequivalence when the T and R formulations are not identical is very conservative. The very low probabilities of falsely concluding equivalence (<10%) for these differences between two products in trials with at least 50 subjects should be considered an acceptable risk when conclusions on the feasibility of PK for determining regional differences are intended to be made.
The current simulations demonstrated that, for FP, AUC is sensitive to detect differences in the total lung deposition and the central-to-peripheral lung deposition ratio while Cmax is sensitive to detect differences in total lung deposition and the pulmonary dissolution rate constant (i.e., pulmonary residence time for slowly dissolving drugs) (Fig. 3). While AUC and Cmax are sensitive to detect differences in the pulmonary dissolution rate constant and the central-to-peripheral lung deposition ratio, respectively, the predicted sensitivity is somewhat smaller than that for the deposited dose (Fig. 3), but certainly much more sensitive than for clinical studies (24–26). While the observed sensitivity of AUC and Cmax to differences in the total lung deposition for FP can be generalized to all inhaled drugs with negligible oral bioavailability, the sensitivity of AUC and Cmax to differences in the central-to-peripheral lung deposition ratio and the pulmonary dissolution rate constant, respectively, need to be considered more carefully. The sensitivity of AUC to differences in the central-to-peripheral lung deposition ratio depends on the relative magnitude of the mucociliary clearance to the pulmonary dissolution rate constant. Only if a shift in pulmonary lung deposition toward more central or more peripheral deposition results in a different amount of particles being removed from the lung before they dissolved (under the assumption of low oral bioavailability), the systemic exposure and thus the AUC can reflect those differences. Therefore, plasma exposure is very likely to be insensitive to difference in central-to-peripheral lung deposition ratio for faster dissolving orally inhaled drugs. The role plasma PK can play in detecting differences in the pulmonary performance for those products remains poorly understood. Answering this question requires closing the existing knowledge gap on the processes that occur between the pulmonary deposition of particles and drug being available in the systemic circulation (27).
The current simulations also evaluated systematically the sensitivity of plasma PK to detect differences between two FP products that differed from each other in more than one pulmonary performance parameters. The simulations demonstrated that two products with very different pulmonary characteristics could have very similar plasma concentration time profiles resulting in a false positive equivalence assessment based on plasma PK (Figs. 4 and 5 and Table III). All these scenarios share the common feature that the T products deliver either a larger total amount of drug to lungs with a more central lung deposition or a smaller total amount of drug to lungs with a more peripheral lung deposition. Consequently, the differences in total lung deposition are counteracted by a different amount of drug being susceptible to mucociliary removal in central lung regions. A certain difference in pulmonary dissolution rate constant is additionally necessary to produce profiles with similar AUC and Cmax despite the products being different (Fig. 4). It might be asked how rarely such scenarios (factors differing by the same degree in the correct direction) will occur in vivo and whether in such rarely occurring scenarios of false positive bioequivalence assessment in vitro studies, such as cascade impactor studies will detect such differences. In particular, when comparing the option of a combined PK/in vitro assessment with an assessment based on or including pulmonary efficacy biomarkers, and its flat dose-response relationship for inhaled corticosteroids, a combined PK/in vitro assessment becomes more attractive. In vitro tests comprising emitted dose, fine particle mass, cascade impactor data, and dissolution testing may be able to complement PK equivalence testing and help to prevent false positive bioequivalence conclusions for very different products, although such a scenario certainly will be very rare. Complementing PK equivalence studies with in vitro assessments seems to be a reasonable position in between the very opposite approaches of the EMA and FDA (see “Introduction” section). Thus, it may represent a viable option for globally aligning existing approaches for establishing pulmonary equivalence of slowly dissolving locally acting OIDPs.
The results of the simulations naturally depend on the quality and the assumptions of the underlying model that is applied. Central and peripheral lung regions comprise airway generations from the trachea to the terminal bronchioles (conducting zone) and from the respiratory bronchioles to the alveolar sacs (transitional and respiratory zone), respectively. Pulmonary absorption from peripheral lung regions was assumed to be twice as fast as from central lung regions. Pulmonary dissolution of deposited FP particles was assumed to be same in the central and peripheral lung regions. It should be remarked that the way pulmonary dissolution and absorption processes were included in the model was not driven by model simplicity. It is rather driven by the poor understanding of pulmonary dissolution and absorption processes. The model includes only processes that could be verified experimentally (e.g., one pulmonary dissolution rate constant for FP) or were available from literature (13). Literature and experimental evidence for some theoretically conceivable processes as different dissolution processes for central and peripheral lung regions or more than two pulmonary absorption processes has not yet been established. The model could of course be extended and the simulations be updated when more evidence is available in the future. The current model, including those assumptions, was validated and could adequately predict the plasma profiles of FP and other inhaled drugs. Nonetheless, it is and will always be, like any model, only a simplification of true pulmonary behavior. Alternatives to a simulation-based approach would be conducting ethically and financially challenging clinical trials in healthy subjects and/or patients systematically testing formulation that differ from each in their pulmonary characteristics and their impact on plasma PK. Moreover, (clinical) trial simulation has become a widely acknowledged and used method for testing hypothesis without conducting actual clinical trials (28,29).
Overall, the sensitivity of the PK metrics in evaluating bioequivalence between T and R OIDPs is much higher than observed for the currently recommended clinical studies that are generally not sensitive to varying doses of FP and as consequence will also be unable to show sensitivity toward rate of availability nor regional deposition differences (24–26).
A user-friendly web application where PK bioequivalence trials for inhaled FP with different variability terms, pulmonary performance-related parameters of the T product, and the number of subjects enrolled in the trial can be simulated is available (http://coplin6.cop.ufl.edu:3838/ifp/). Hence, the users can simulate PK bioequivalence for inhaled FP using their own parameters and numbers of subjects and thus use the web application for optimizing the design of prospective studies. The automatically generated output of the web application, which is based on the Shiny R extension package (19), includes point estimates and 90% confidence intervals for the T/R ratios of AUC and Cmax and the percent of simulated trials that resulted in pass for AUC and/or Cmax. A screenshot of the graphical user interface of the web application is shown in Fig. 6.
Fig. 6.
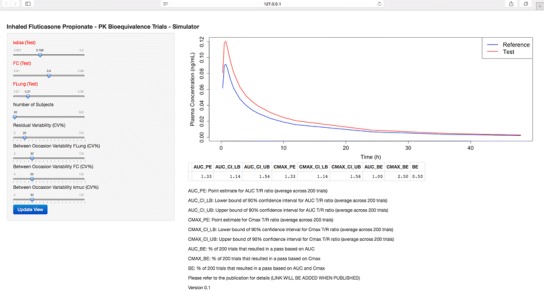
Screenshot of graphical user interface of the web application that allows simulating PK bioequivalence trials for inhaled FP. The user can vary the pulmonary performance-related parameters of the T product, the number of subjects included in the trial, and residual variability, and the between-occasion variability for F Lung, F C, and k muc (Table I)
A second web application where all model parameters can be modified and the oral absorption compartment is switched on, gives the users theoretically the flexibility to simulate PK bioequivalence for any inhaled drug (http://coplin6.cop.ufl.edu:3838/inhaled/). For instance, the web application might be used to probe if potential differences in the in vitro behavior (e.g., dissolution rate differences, pulmonary dose, or cascade impactor profiles) between T and R product affect the bioequivalence if sufficient data on in vitro and in vivo correlation are available for the user to allow predicting the effect of such in vitro differences on PK. An in vitro and in vivo relationship between cascade impactor data and pulmonary deposited dose has been recently reported (30). In general, more efforts need to be invested into establishing of in vitro/in vivo correlations before physiological PK models will be reliable predictors of the outcome of bioequivalence studies. The web application could also be used for investigating the relationship between kdiss values (e.g., slowly vs. fast dissolving drugs) and the sensitivity of plasma PK to detect differences in the central-to-peripheral lung deposition ratio. However, it should be remarked that kdiss is a substance- and formulation-specific parameter. Thus, other model parameters would need to be adapted accordingly to generate reliable results.
CONCLUSIONS
A Monte Carlo simulation-based approach demonstrated that plasma PK metrics (AUC and Cmax) are capable of detecting differences in the pulmonary performance of inhaled FP products with a good sensitivity of at least 25%, 35%, and 30% for the total lung deposition, central-to-peripheral lung deposition ratio, and pulmonary dissolution characteristics, respectively. For slowly dissolving inhaled corticosteroids, equivalence testing of pulmonary efficacy based on plasma PK should thus be considered as a viable alternative to clinical studies comparing pulmonary efficacy biomarkers, which have not been demonstrated to be similarly sensitive to potential pulmonary performance differences. It was additionally demonstrated that two FP products with very different pulmonary performance could have very similar plasma profiles. Hence, PK trials for pulmonary efficacy equivalence testing should be complemented by in vitro studies to avoid false positive bioequivalence assessments. Moreover, a user-friendly web application for simulating PK equivalence trials with inhaled FP was developed.
Electronic supplementary material
(XLSX 195 kb)
ACKNOWLEDGEMENTS
The authors would like to thank Uta Schilling and Tobias Miesler for their very valuable contributions to this project.
Footnotes
AUC0–48 was calculated by applying the trapezoidal rule. It was confirmed that AUC0–48 covered at least 80% of AUC0-inf
Goyal N, Hochhaus G. Demonstrating Bioequivalence Using Pharmacokinetics: Theoretical Considerations Across Drug Classes. Respiratory Drug Delivery. 2010;1:261–72.
References
- 1.Global Initiative for Chronic Obstructive Lung Disease. Global strategy for the diagnosis, management, and prevention of chronic obstructive pulmonary disease. http://www.goldcopd.org/uploads/users/files/GOLD_Report_2014_Jun11.pdf. Accessed 27 Aug 2014
- 2.Global Initiative for Asthma. Global strategy for asthma management and prevention. http://www.ginasthma.org/local/uploads/files/GINA_Report_2014_Aug12.pdf. Accessed 27 Aug 2014
- 3.DiMasi JA, Hansen RW, Grabowski HG. The price of innovation: new estimates of drug development costs. J Health Econ. 2003;22:151–185. doi: 10.1016/S0167-6296(02)00126-1. [DOI] [PubMed] [Google Scholar]
- 4.U.S. Department of Health and Human Services - Food and Drug Administration - Center for Drug Evaluation and Research. Guidance for industry—bioavailability and bioequivalence studies for orally administered products - general considerations. http://www.fda.gov/downloads/Drugs/…/Guidances/ucm070124.pdf. Accessed 27 Aug 2014
- 5.U.S. Department of Health and Human Services, Food and Drug Administration, Center for Drug Evaluation and Research (CDER). Statistical approaches to establishing bioequivalence. http://www.fda.gov/downloads/Drugs/GuidanceComplianceRegulatoryInformation/Guidances/UCM070244.pdf. Accessed 08 Jun 2014
- 6.Food and Drug Administration. Draft guidance on fluticasone propionate; salmeterol xinafoate. http://www.fda.gov/downloads/Drugs/GuidanceComplianceRegulatoryInformation/Guidances/UCM367643.pdf. Accessed 27 Aug 2014
- 7.European Medicines Agency. Guideline on the requirements for clinical documentation for orally inhaled products (OIP) including the requirements for demonstration of therapeutic equivalence between two inhaled products for use in the treatment of asthma and chronic obstructive pulmonary disease (COPD) in adults and for use in the treatment of asthma in children and adolescents. http://www.ema.europa.eu/docs/en_GB/document_library/Scientific_guideline/2009/09/WC500003504.pdf. Accessed 08 Jun 2014
- 8.Adams WP, Ahrens RC, Chen ML, Christopher D, Chowdhury BA, Conner DP, et al. Demonstrating bioequivalence of locally acting orally inhaled drug products (OIPs): workshop summary report. J Aerosol Med Pulm Drug Deliv. 2010;23:1–29. doi: 10.1089/jamp.2009.0803. [DOI] [PubMed] [Google Scholar]
- 9.Apiou-Sbirlea G, Newman S, Fleming J, Siekmeier R, Ehrmann S, Scheuch G, et al. Bioequivalence of inhaled drugs: fundamentals, challenges and perspectives. Ther Deliv. 2013;4:343–367. doi: 10.4155/tde.12.161. [DOI] [PubMed] [Google Scholar]
- 10.Evans C, Cipolla D, Chesworth T, Agurell E, Ahrens R, Conner D, et al. Equivalence considerations for orally inhaled products for local action-ISAM/IPAC-RS European Workshop report. J Aerosol Med Pulm Drug Deliv. 2012;25:117–139. doi: 10.1089/jamp.2011.0968. [DOI] [PubMed] [Google Scholar]
- 11.Lee SL, Adams WP, Li BV, Conner DP, Chowdhury BA, Yu LX. In vitro considerations to support bioequivalence of locally acting drugs in dry powder inhalers for lung diseases. AAPS J. 2009;11:414–423. doi: 10.1208/s12248-009-9121-4. [DOI] [PMC free article] [PubMed] [Google Scholar]
- 12.O’Connor D, Adams WP, Chen ML, Daley-Yates P, Davis J, Derendorf H, et al. Role of pharmacokinetics in establishing bioequivalence for orally inhaled drug products: workshop summary report. J Aerosol Med Pulm Drug Deliv. 2011;24:119–135. doi: 10.1089/jamp.2011.0878. [DOI] [PubMed] [Google Scholar]
- 13.Weber B, Hochhaus G. A pharmacokinetic simulation tool for inhaled corticosteroids. AAPS J. 2013;15:159–171. doi: 10.1208/s12248-012-9420-z. [DOI] [PMC free article] [PubMed] [Google Scholar]
- 14.R Development Core Team. R: A language and environment for statistical computing. http://www.r-project.org/. Accessed 08 Jun 2014
- 15.Mollmann H, Wagner M, Krishnaswami S, Dimova H, Tang Y, Falcoz C, et al. Single-dose and steady-state pharmacokinetic and pharmacodynamic evaluation of therapeutically clinically equivalent doses of inhaled fluticasone propionate and budesonide, given as Diskus or Turbohaler dry-powder inhalers to healthy subjects. J Clin Pharmacol. 2001;41:1329–1338. doi: 10.1177/00912700122012913. [DOI] [PubMed] [Google Scholar]
- 16.Mortimer KJ, Tattersfield AE, Tang Y, Wu K, Lewis S, Hochhaus G, et al. Plasma concentrations of fluticasone propionate and budesonide following inhalation: effect of induced bronchoconstriction. Br J Clin Pharmacol. 2007;64:439–444. doi: 10.1111/j.1365-2125.2007.02856.x. [DOI] [PMC free article] [PubMed] [Google Scholar]
- 17.Dalby C, Polanowski T, Larsson T, Borgstrom L, Edsbacker S, Harrison TW. The bioavailability and airway clearance of the steroid component of budesonide/formoterol and salmeterol/fluticasone after inhaled administration in patients with COPD and healthy subjects: a randomized controlled trial. Respir Res. 2009;10:104. doi: 10.1186/1465-9921-10-104. [DOI] [PMC free article] [PubMed] [Google Scholar]
- 18.Harrison TW, Tattersfield AE. Plasma concentrations of fluticasone propionate and budesonide following inhalation from dry powder inhalers by healthy and asthmatic subjects. Thorax. 2003;58:258–260. doi: 10.1136/thorax.58.3.258. [DOI] [PMC free article] [PubMed] [Google Scholar]
- 19.Chang W. Web application framework for R. http://cran.r-project.org/web/packages/shiny/shiny.pdf. Accessed 15 Nov 2014
- 20.Sakagami M. Fluticasone pharmacokinetics: meta-analysis and models. Resp Drug Deliv. 2014;1:143–154. [Google Scholar]
- 21.Lakemedelsverket Medical Products Agency. Public assessment report scientific discussion salmeterol/fluticasone hexal (salmeterol xinafoate, fluticasone propionate). https://docetp.mpa.se/LMF/Salmeterol-Fluticasone%20Hexal%20inhalation%20powder,%20pre-dispensed%20ENG%20PAR.pdf. Accessed 24 Jan 2015
- 22.Horhota S, Verkleij C, Cornelissen P, Bour L, Sharma A, Trunk M. IPAC-RS/UF Orlando Inhalation Conference. Case study: pharmacokinetics and pharmacodynamics of tiotropium and salmeterol following parallel administration in COPD patients using different dry powder inhalation systems. https://custom.cvent.com/7BA2EE65E8B64AEBB1E77F19E7FD30BC/files/event/8a749091c2c741228907ca5c70b619eb/f53ea6bc433a4dbeb1ec47895ba719ef.pdf. Accessed 15 Nov 2014
- 23.Soulele K, Macheras P, Karalis V. A population pharmacokinetic analysis using data from dry powder inhalers: the case of fluticasone/salmeterol. 2014 AAPS Annual Meeting; San Diego, CA
- 24.Pearlman DS, Noonan MJ, Tashkin DP, Goldstein MF, Hamedani AG, Kellerman DJ, et al. Comparative efficacy and safety of twice daily fluticasone propionate powder versus placebo in the treatment of moderate asthma. Ann Allergy Asthma Immunol. 1997;78:356–362. doi: 10.1016/S1081-1206(10)63196-1. [DOI] [PubMed] [Google Scholar]
- 25.Daley-Yates PT, Parkins DA, Thomas MJ, Gillett B, House KW, Ortega HG. Pharmacokinetic, pharmacodynamic, efficacy, and safety data from two randomized, double-blind studies in patients with asthma and an in vitro study comparing two dry-powder inhalers delivering a combination of salmeterol 50 microg and fluticasone propionate 250 microg: implications for establishing bioequivalence of inhaled products. Clin Ther. 2009;31:370–385. doi: 10.1016/j.clinthera.2009.02.007. [DOI] [PubMed] [Google Scholar]
- 26.Saluja B, Li BV, Lee SL. Bioequivalence for orally inhaled and nasal drug products. In: Yu L, Li B, editors. AAPS Advances in the Pharmaceutical Sciences Series - FDA Bioequivalence Standards: Springer; 2014. p. 369–95.
- 27.Ruge CA, Kirch J, Lehr C-M. Pulmonary drug delivery: from generating aerosols to overcoming biological barriers—therapeutic possibilities and technological challenges. Lancet Resp Med. 2013;1:402–413. doi: 10.1016/S2213-2600(13)70072-9. [DOI] [PubMed] [Google Scholar]
- 28.Holford N, Ma SC, Ploeger BA. Clinical trial simulation: a review. Clin Pharmacol Ther. 2010;88:166–182. doi: 10.1038/clpt.2010.114. [DOI] [PubMed] [Google Scholar]
- 29.Holford NH, Kimko HC, Monteleone JP, Peck CC. Simulation of clinical trials. Annu Rev Pharmacol Toxicol. 2000;40:209–234. doi: 10.1146/annurev.pharmtox.40.1.209. [DOI] [PubMed] [Google Scholar]
- 30.Olsson B, Borgstrom L, Lundback H, Svensson M. Validation of a general in vitro approach for prediction of total lung deposition in healthy adults for pharmaceutical inhalation products. J Aerosol Med Pulm Drug Deliv. 2013;26:355–369. doi: 10.1089/jamp.2012.0986. [DOI] [PubMed] [Google Scholar]
Associated Data
This section collects any data citations, data availability statements, or supplementary materials included in this article.
Supplementary Materials
(XLSX 195 kb)