

Abstract
RG7652 is a fully humanized monoclonal antibody targeting human PCSK9, a regulator of serum low density lipoprotein cholesterol (LDLc) levels. RG7652 prevents degradation of the hepatic LDLc receptors by blocking PCSK9 binding and thereby resulting in efficient LDLc uptake by hepatocytes. The pharmacokinetics of RG7652 have been evaluated in healthy subjects after single and multiple subcutaneous doses. Pharmacokinetic (PK) and pharmacodynamic (PD) models were developed to explain the antibody PK and LDLc time course data. The PK and PD models based on data from healthy subjects were used to simulate the effects of RG7652 on LDLc levels for a range of potential dose regimens in patients with coronary heart disease. A one-compartment PK model combined with an indirect PD response model was able to adequately describe the PK and LDLc data. Simulations of 400 mg every 4 weeks or 800 mg every 8 weeks regimens show significant LDLc reduction and suggest that dosing RG7652 once every month or once every 2 months is predicted to be optimal for the treatment of hypercholesterolemia. The PK and PD model successfully described the PK and LDLc data from healthy subjects in a Phase 1 study, and the model-based simulations provided useful insights and quantitative understanding for the selection of Phase 2 study doses in patients with coronary heart disease. The approach used in the case study demonstrates the utility of modeling and simulation in designing dose-ranging studies.
Electronic supplementary material
The online version of this article (doi:10.1208/s12248-015-9750-8) contains supplementary material, which is available to authorized users.
KEY WORDS: antibody, LDLc, modeling and simulation, PCSK9, PK/PD
INTRODUCTION
Low-density lipoprotein cholesterol (LDLc) is a major driver of cardiovascular risk in coronary heart disease (CHD) patients (1–3). LDLc lowering reduces cardiovascular events in CHD patients and is effective in primary prevention of CHD (4,5). Recently, the American College of Cardiology-American Heart Association (ACC-AHA) Task Force on Practice Guidelines recommended intensive statin therapy to reduce LDLc levels by ≥50% for individuals with a 10-year risk of atherosclerotic cardiovascular disease of ≥7.5% and LDLc level of >70 mg/dL and for Type 1 or 2 diabetes patients with LDLc level of ≥70 mg/dL (6). Clinical trial results reported since the publication of National Cholesterol Education Program Adult Treatment Panel III (ATP III) guidelines (7) support LDLc reduction to levels below the normal range, even in patients with low baseline CHD risk (8). No serious adverse effects of very low LDLc levels have been reported in these trials and, to our knowledge, there is no generally accepted minimal safe concentration of LDLc. Although the available data are limited, patients with loss-of-function mutations in PCSK9 (proprotein convertase subtilisin/kexin type 9) were found to have very low LDLc levels (<15 mg/dL) throughout their life time without any apparent abnormalities (9,10).
Statins are currently the most effective lipid-lowering agents among approved therapies (3,11). However, a recent survey (2006–07) found that only 25–30% of CHD patients with ≥2 risk factors attained the LDLc goal of ≤70 mg/dL despite using lipid-lowering therapies (12–14). The reasons for the low % of patients achieving target likely include an underutilization of intensive cholesterol therapy by physicians, poor compliance by patients, patients who do not reach goal despite intensive therapy, and patients who do not tolerate intensive therapy. A substantial number of patients do not tolerate statins (e.g., 2–11% of patients suffer adverse muscle effects with statins) (8,15). Alternative therapies such as the cholesterol absorption inhibitor ezetimibe are less effective than statins at reducing LDLc; there remains a substantial unmet medical need for LDLc-lowering therapeutics (16).
PCSK9 is a soluble protein that binds and regulates LDL receptor (LDLR) activity and thus serum LDL cholesterol levels (17,18). LDLRs bound to PCSK9 are routed for degradation in lysosomes. In the absence of PCSK9 binding, LDLRs are recycled back to the cell membrane where they act to remove LDLc from circulation (18). Gain-of-function mutations in PCSK9 have been reported to cause autosomal dominant hypercholesterolemia and premature CHD while loss-of-function mutations result in lower serum LDLc levels and lower risk for coronary events (19,20). RG7652 is a fully human, monoclonal IgG1 antibody against human PCSK9 that prevents PCSK9 binding to hepatic LDLR and thereby reduces LDLc levels. Robust and dose-dependent LDLc-lowering effects of RG7652 were observed in a first-in human Phase 1 study. RG7652 was well tolerated, and no significant safety concerns were observed in the Phase 1 study (21).
Pharmacokinetic/pharmacodynamic (PK/PD) modeling and simulation is a well-established approach that has proven to be useful in facilitating drug development (22,23). The RG7652 Phase 1 program in healthy volunteers with elevated cholesterol involved six single dose regimens, two weekly regimens, and two weekly regimens with atorvastatin pre-treatment. Although LDL cholesterol is a reliable biomarker, extrapolating to Phase 2 was challenging because it required consideration of dose regimens ranging from Q4W to Q12W, translating to refractory statin patients, and consideration of both average cholesterol reduction at the end of dosing interval and nadir. We report here the PK/PD analysis of Phase 1 PK and serum LDLc data and model-based simulations used to guide Phase 2 dose selections for RG7652. The key objective for Phase 2 development of RG7652 was to identify doses and dosing regimens that provide significant LDLc reduction while minimizing the frequency of subcutaneous injections.
METHODS
Phase I Study in Healthy Subjects
Full details of the Phase 1 clinical study design have been published (21). Briefly, this was a randomized, placebo-controlled, single and multiple ascending dose study in healthy volunteer subjects with elevated levels of LDLc (130–220 mg/dL). A total of 80 subjects were enrolled into 10 dose cohorts and randomized to receive RG7652 or placebo, administered subcutaneously (SC), with 6 subjects receiving active RG7652 and 2 subjects receiving placebo in each cohort. Six single dose cohorts received 10, 40, 150, 300, 600, or 800 mg of RG7652. Four multiple dose cohorts received either 40 or 150 mg RG7652 once weekly for 4 weeks, either with or without concomitant statin treatment. In the statin-treated cohorts, atorvastatin 40 mg daily was initiated at least 3 weeks before and continued for 5 weeks after first dose of RG7652 administration. Serum RG7652 samples were collected at predetermined time points for measuring drug and LDLc concentrations using validated assays.
Bioanalytical Assays
PK Assay
RG7652 concentrations were measured using a validated target-binding enzyme-linked immunosorbent assay (ELISA). Briefly, streptavidin-coated microplates (StreptaWell, High-bind, 96 well; Roche Applied Science) were coated with biotin labeled recombinant human PCSK9 (biotin-rhuPCSK9) at 1 μg/mL and used to capture RG7652 in diluted serum samples, standards, and controls, which were added to the plate for incubation. Subsequently, a murine monoclonal anti-CDR (complementarity determining region) clone 1.2A4.2 against RG7652 (Mab 2A4) was added and incubated, followed by anti-mouse IgG2b-horseradish peroxidase (HRP) for detection. A peroxidase substrate (tetramethyl benzidine) was added for color development, and the reaction was stopped by adding 1 M phosphoric acid. The plates were read at 450 nm for detection absorbance using either 620 or 630 nm for reference absorbance.
LDLc Assay
Serum LDLc concentrations were determined using the Roche LDL Cholesterol Plus (2nd Generation) kit (Roche Diagnostics, Indianapolis, IN). This method, also known as the “direct method”, takes advantage of the selective micellary solubilization of LDLc by a nonionic detergent. In addition to the direct method, LDLc was also determined indirectly from total cholesterol, HDL cholesterol, and triglyceride levels using the Friedewald equation. LDLc measured using direct method was used in the modeling.
Population PK and PD Models
RG7652 serum concentration data from all subjects on active treatment were modeled using a one-compartment PK model with first-order absorption and combined linear and saturable elimination from the central compartment. A saturable elimination pathway was included because visual inspection of the dose-normalized concentration-time profiles showed that RG7652 exposure increased more than proportionally relative to dose at low-dose levels. The PK model was described with the following set of differential equations,
| 1 |
| 2 |
Asc is the RG7652 amount in the subcutaneous absorption compartment, and A is the amount in the central compartment. Ka is the absorption rate constant from the absorption compartment to the central compartment, V is the apparent volume of the central compartment, CL is the linear clearance from the central compartment, Vmax is the maximum elimination rate via the saturable elimination pathway, and Km is the antibody concentration at half-maximum elimination rate via the saturable pathway.
Based on the mechanism of action of RG7652 (18), an indirect response PD model (24) was used to characterize the relationship between RG7652 serum concentrations and serum LDLc levels. RG7652 antagonizes binding of PCSK9 to hepatic LDLRs, thereby preventing LDLR degradation in endosomes and increasing LDLR recycling. This results in increased LDLc uptake by hepatocytes and a subsequent decrease in circulating LDLc. Since RG7652 affects LDLc levels by increasing cellular uptake, RG7652 was assumed to increase the LDLc degradation rate (Kdeg) parameter using an Emax function. The PD model was described using the following differential equation,
| 3 |
where Ksyn is the zero-order synthesis rate constant for the response variable, serum LDLc, and Kdeg is the first-order LDLc degradation rate constant. Conc denotes the serum RG7652 concentration. Emax is the maximum effect of drug on Kdeg, and EC50 is the serum RG7652 concentration required to produce half-maximum drug effect. Placebo response was modeled as a time-specific additive LDL offset.
Between-subject variability (BSV) in the PK and PD parameters was assumed to follow a log-normal distribution,
| 4 |
TVP is the typical population value of a parameter, Pi is the individual parameter value, and ηi represents the individual deviation. Additive, proportional, and combined additive and proportional residual error models were evaluated.
A sequential modeling approach was used for fitting the models to the Phase 1 PK and LDLc data. Individual post hoc PK parameters derived from the first PK modeling step were used in the second step to calculate the RG7652 concentrations and model the drug effect on serum LDLc levels. Covariates such as body weight, age, gender, baseline LDLc, serum albumin, creatinine clearance, and statin treatment were tested on both the PK and PD parameters. Covariates were tested one by one in the base model (univariate analysis) and the covariates that were significant at p < 0.05 (objective function value difference of 3.84, for one degrees of freedom, i.e., one parameter difference between covariate and base models) were selected for inclusion in a full model. After this full model was estimated, the backward deletion was performed. The covariates were removed one at a time in a stepwise manner using likelihood ratio test (at p < 0.001 objective function value difference of 10.8 for one degree of freedom), until all remaining covariates were significant. Changes in the objective function value, the Akaike information criterion (AIC), the precision of the parameter estimates, visual inspection of standard goodness-of-fit plots, and reduction in between-subject and residual variability were used for model selection.
Continuous covariates were modeled using the power function as shown below.
| 5 |
where Effecti is the multiplicative factor for covariate i, Covj is the covariate value for individual j, Covref is the median covariate value, and θeff is the exponent of power function.
Categorical covariates were included in the model as shown below.
If the categorical covariate is equal to 0, then Effecti = 1.
If the categorical covariate is equal to 1, then , where θeff is the covariate effect parameter.
The nonlinear mixed effects modeling approach was used for both PK and PD models. Modeling was performed using NONMEM software version 7.0 level 1 (ICON development solutions, Ellicott City, MD) installed on a Linux cluster. The first-order conditional estimation method with η-ε interaction was used during the model building process. Graphical representations and simulations for visual predictive checks were performed using the software R version 2.13.1.
Simulations for Phase 2 Dose Selection
Serum LDLc time profiles were simulated using the final PK and PD models with 2 alternate covariate assumptions, to support Phase 2 dose selection. A total of 100 Phase 2 trials were simulated using the uncertainty distribution in parameter estimates. One hundred patients were simulated in each trial using the between-subject random effects in both PK and PD parameters. Simulated individual concentrations using the PK model were used for the LDLc simulations in a PD model. The covariates, age, and body weight were simulated from assumed log-normal distributions. Baseline LDLc data was simulated from an assumed beta distribution with a minimum, maximum, and mean LDLc of 100, 200, and 115 mg/dL, respectively. Serum LDLc values were simulated for a range of doses, 150 to 1000 mg, given SC in three different regimens: every 4 weeks (Q4W), every 8 weeks (Q8W), and every 12 weeks (Q12W). The drug effect was simulated over 24 weeks for all regimens with weekly LDLc samples. It was assumed that the LDLc reduction in CHD patients is similar to that in healthy subjects and the PK/PD relationship based on the short term Phase 1 study could be extrapolated to longer term studies (i.e., time-invariance of PK/PD relationship). All the simulations and graphical analysis were performed using software R 2.13.1 installed on a Windows 7 computer.
RESULTS
Population PK Model
The population PK model was developed using a total of 687 evaluable serum concentrations from 60 subjects that received RG7652 in the Phase 1 study. Healthy subjects’ ages ranged from 19 to 64 years (median, 46.5 years), and body weight ranged from 52.6 to 114.5 kg (median, 82.6 kg). Mean PK profiles from single dose and multiple dose cohorts are shown in Fig. 1 (upper left and lower left panels, respectively). The RG7652 serum concentrations were best described by a one-compartment PK model with linear and nonlinear/saturable elimination (Fig. 2), based on AIC values and goodness-of-fit plots. Covariate analysis identified an age effect on the absorption rate constant (Ka) and a body weight effect on both clearance (CL) and the volume of distribution (V). Ka decreased with age while CL and V increased with body weight. No other patient factors were identified as statistically significant in this analysis. The model-derived RG7652 elimination half-life calculated using linear CL and apparent volume parameter estimates was 13.6 days. Goodness-of-fit plots for the PK model are shown in Supplemental Figure 1 (upper panels), and the final PK parameters are shown in Table I.
Fig. 1.
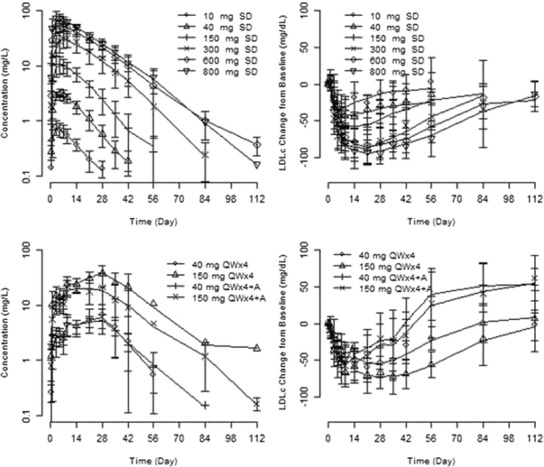
Mean (+/− standard deviation) serum RG7652 concentration versus time (left panels) and LDLc (direct method) change from baseline versus time (right panels) after single dose (top panels) and multiple doses (bottom panels) of RG7652 in the Phase 1 study. The points and the error bars represent the mean and standard deviation (RG7652 serum concentration) or standard error (LDLc change from baseline). The lines represent the mean of model predicted concentrations. SD single dose, QWx4 once weekly for 4 weeks, QWx4 + A once weekly for 4 weeks on atorvastatin treatment
Fig. 2.
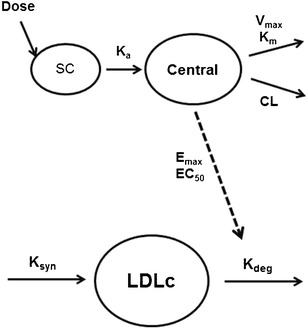
Schematic representation of the PK and PD models used to describe serum RG7652 pharmacokinetic and pharmacodynamic (LDLc) data. SC subcutaneous space
Table I.
Parameter Estimates for the RG7652 Population PK Model
| Parameter | Estimate (%RSE) | BSV (%RSE) |
|---|---|---|
| K a (1/day) | 0.348 (7.47) | 0.257 (16.2) |
| CL/F (L/day) | 0.426 (7.68) | 0.143 (20.2) |
| V/F (L) | 8.38 (2.9) | 0.0311 (24.1) |
| V max (mg/day) | 1.91 (23.0) | NE |
| K m (ug/mL) | 4.29 (23.3) | NE |
| Age ~ Ka | −0.886 (26.1) | – |
| BW ~ CL/F | 0.813 (43.1) | – |
| BW ~ V1 | 0.288 (49.7) | – |
| Proportional error (%) | 17.8 (9.75) |
Typical value of Ka = 0.348 × (AGE/47)−0.886. Typical value of CL = 0.426 × (BW/80)0.813. Typical value of V1 = 8.38 × (BW/80)0.288
NE not estimated, RSE relative standard error, BSV between-subject variance, BW body weight
Population PD Model
The individual post hoc parameters from the final PK model were used to predict the individual RG7652 concentrations to drive the drug effect on LDLc time profiles using an indirect response model. A schematic diagram of the PK and PD models is shown in Fig. 2. The population PD model was developed using 1070 serum LDLc concentrations from 80 subjects in the study. Mean serum LDLc time profiles from single dose and multiple dose cohorts are shown in Fig. 1 (upper right and lower right panels, respectively). Baseline (pre-dose) LDLc values ranged from 58 to 242 mg/dL (median, 145 mg/dL), and screening LDLc values (collected 3–4 weeks prior to first dose) ranged from 125 to 220 mg/dL (median, 163 mg/dL). Male and female subjects were approximately equal in number (42 vs. 38). Baseline LDLc in the atorvastatin-treated cohorts was about 45% lower than the baseline LDLc in cohorts without concomitant atorvastatin treatment. As a result, the screening LDLc values collected prior to atorvastatin dosing were used as the initial condition for the indirect response model. Only the baseline LDLc was identified as a covariate on the Emax parameter, with higher Emax at lower baseline values. Since the baseline LDLc was lower in the statin-treated cohorts, the baseline effect on Emax could have been confounded by concomitant statin therapy (Fig. 3). It was not possible to determine whether statin treatment had other effects on Emax, independent of lowering baseline LDLc, so the data were analyzed using the “statin model” which assumes statin pre-treatment directly affects the Emax parameter, in addition to the model which assumes only baseline LDLc level affects the Emax parameter. It was difficult to determine which was a “better” model between the two parameterizations; objective function values for both models were very similar, at 7135 and 7127, respectively. Since both models described the observed data well and as it was difficult to verify the effect of statin pre-treatment on Emax parameter, results from the statin model are presented in online supplemental material. The model fit to data was assessed using goodness-of-fit plots and visual predictive checks. Goodness-of-fit plots for the PD model and the statin model are shown in Supplemental Figure 1(lower and middle panels, respectively). The final parameters from the PD model are shown in Table II. PD parameters for the statin model are presented in Supplemental Table 1.
Fig. 3.
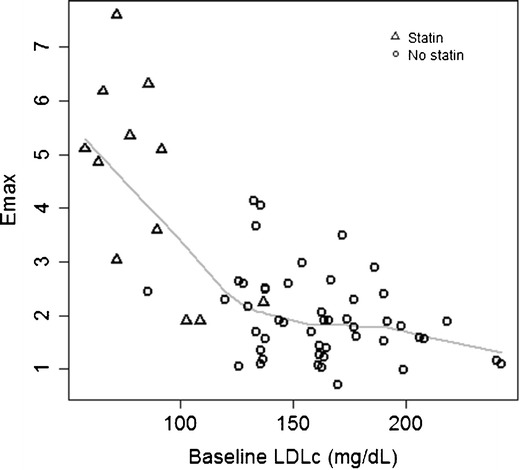
Effect of baseline LDLc on E max parameter in the population PD model. Circles and triangles represent individual Phase 1 subjects in the nonstatin and statin cohorts, respectively. Solid gray line indicates loess smoother
Table II.
Parameter Estimates for the RG7652 Population PD Model
| Parameter (units) | Estimate (%RSE) |
|---|---|
| K deg (1/day) | 0.0476 (23.1) |
| E max | 1.95 (15.7) |
| EC50 (ug/mL) | 13.8 (25.0) |
| Statin on screening LDLc | −0.648a (10.1) |
| Baseline ~ E max | −1.49b (16.4) |
| ω 2_K deg | 0.162 (59.3) |
| ω 2_E max | 0.159 (23.0) |
| ω 2_Baseline | 0.0209 (27.9) |
| Proportional residual error (%) | 13.1 (11.8) |
| Objective function | 7127.331 |
%RSE percent standard error of estimate, ω 2 _K deg between-subject variability on Kdeg parameter, ω 2 _E max between-subject variability on Emax parameter, ω 2 _Baseline between-subject variability on baseline parameter
aStatin effect on screening LDLc (SLDL): SLDL*exp−0.648*(1 or 0)
bBaseline LDLc effect on E max: 1.95*(baseline LDLc/median LDLc)−1.49
Simulations for Phase 2 Dose Selection
LDLc simulations for Phase 2 dose selection were performed using the final model. Figure 4 shows the mean LDLc change from baseline versus dose and the percent of subjects with LDLc below 15 mg/dL. Trial mean LDLc profiles with 90% prediction intervals are presented in Fig. 5. Table III lists the following metrics that were derived from the simulated LDLc values: nadir LDLc, % subjects achieving nadir LDLc below 15 mg/dL, mean LDLc at the end of the dosing interval, % subjects with LDLc below 70 mg/dL at the end of the dosing interval, and mean LDLc % change from baseline at the end of interval. The model simulations demonstrated prolonged LDLc-lowering effects of RG7652, supporting dosing intervals of Q4W and Q8W. Several dosing regimens are currently being tested in a Phase 2 study of RG7652. Similar results from the statin model are presented in online supplemental material (Supplemental Table 2 and Supplemental Figures 2 and 3). In general, overall trends in the simulated LDLc profiles were similar for between both models except the magnitude of LDLc lowering at nadir predicted by the statin model is higher. Higher magnitude of LDLc lowering in the statin model is due to the effect of statin treatment effect on Emax parameter.
Fig. 4.
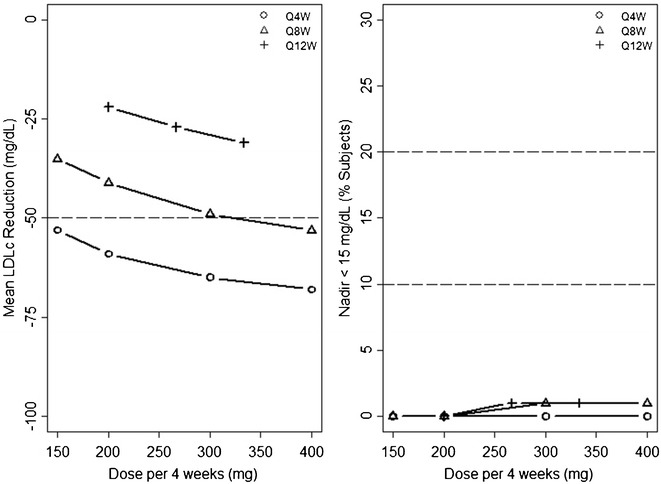
Predicted mean LDLc change from baseline at 24 weeks versus milligrams of RG7652 dose per 4 weeks (left panel) and predicted % subjects with nadir LDLc < 15 mg/dL (right panel) at three regimens
Fig. 5.
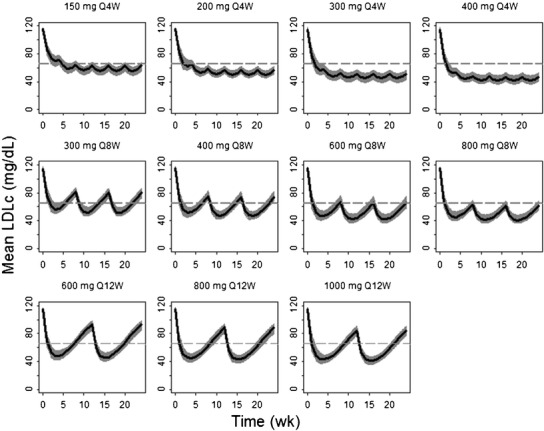
Predicted serum LDLc profiles for simulated Phase 2 trials using the population PD model. The solid black line indicates the mean of 100 simulated trials and the gray band indicates the 90% prediction intervals. The dotted gray line indicates 50 mg/dL reduction in LDLc from baseline. Upper: predicted profiles for Q4W regimens. Middle: predicted profiles for the Q8W regimens. Lower: predicted profiles for Q12W regimens
Table III.
Predicted Serum LDLc Data Based on Phase 2 Trial Simulations Using the Population PD Model. The Values Indicate the Mean of 100 Simulated Trials*, and the Parentheses Include 90% Prediction Intervals
| Dose | Regimen | Nadir LDLc (mg/dL) | % Subjects (nadir < 15 mg/dL) | Mean EOI LDLc (mg/dL) | % Subjects (EOI LDLc < 70 mg/dL) | LDLc reduction @ EOI (mg/dL) |
|---|---|---|---|---|---|---|
| 150 | Q4W | 55 [49, 60] | 0 [0, 0] | 62 [55, 67] | 70 [59, 82] | −53 [−59, −47] |
| 200 | Q4W | 50 [45, 55] | 0 [0, 1] | 56 [51, 62] | 80 [72, 90] | −59 [−63, −53] |
| 300 | Q4W | 45 [39, 51] | 0 [0, 2] | 50 [43, 57] | 89 [80, 97] | −65 [−71, −59] |
| 400 | Q4W | 42 [36, 49] | 0 [0, 2] | 47 [41, 53] | 92 [86, 97] | −68 [−74, −62] |
| 300 | Q8W | 51 [46, 59] | 0 [0, 1] | 80 [72, 87] | 30 [17, 45] | −35 [−42, −29] |
| 400 | Q8W | 47 [41, 53] | 0 [0, 1] | 74 [69, 82] | 43 [26, 57] | −41 [−46, −34] |
| 600 | Q8W | 42 [36, 49] | 1 [0, 3] | 66 [58, 75] | 60 [41, 75] | −49 [−57, −42] |
| 800 | Q8W | 41 [36, 48] | 1 [0, 3] | 62 [55, 68] | 69 [53, 83] | −53 [−60, −47] |
| 600 | Q12W | 45 [39, 52] | 0 [0, 2] | 93 [85, 98] | 10 [3, 22] | −22 [−29, −17] |
| 800 | Q12W | 42 [37, 49] | 1 [0, 2] | 88 [80, 94] | 17 [8, 30] | −27 [−35, −21] |
| 1000 | Q12W | 41 [35, 46] | 1 [0, 3] | 84 [77, 91] | 24 [13, 39] | −31 [−39, −24] |
One hundred simulated trials included parameter uncertainty
EOI end of the interval (24 weeks), Q4W once every 4-week regimen, Q8W once every 8-week regimen, Q12W once every 12-week regimen
DISCUSSION
This report provides a semi-mechanistic model describing the relationship between PK and LDLc for an anti-PCSK9 monoclonal antibody in humans. The model was structured to link RG7652 concentrations and serum LDLc profiles based on the principle of parsimony and the RG7652 mechanism of action, and the final model appropriately described the observed PK and LDLc data. A one-compartment PK model with a saturable CL component was found to be sufficient to describe the PK data from both the single and multiple ascending dose cohorts. The model-derived elimination half-life, 13.6 days, is shorter than a typical IgG1 antibody; suggesting a saturable elimination pathway plays an important role in drug clearance at the doses studied. This clearance pathway is assumed to represent a target-mediated pathway of elimination. A similar nonlinearity has been observed with RN316, another anti-PCSK9 monoclonal antibody, supporting the hypothesis that this is due to the influence of target (i.e., PCSK9) on the PK of the drug (25). Further, the turnover of PCSK9 has been reported to be much faster (half-life of 4–8 h) (26) as compared with the elimination of IgG; it is possible that high target amounts and rapid turnover can affect antibody disposition significantly.
For patients in the statin cohorts, atorvastatin (40 mg daily) was started after screening and before the baseline LDLc samples and initiation of RG7652 dosing. As expected, the baseline LDLc was lower (~45%) in the statin-treated cohorts compared to the nonstatin cohorts. Atorvastatin treatment was continued for 5 weeks after the initial RG7652 administration (and 2 weeks after the final RG7652 dose), and upon cessation of statin treatment on day 35, the LDLc concentrations rebounded beyond their baseline LDLc values (Fig. 1, lower right panel), approaching the screening levels. The rebound phenomenon was not observed in nonstatin cohorts. In order to account for the differences in baseline LDLc and rebound in LDLc levels between these two groups, screening LDLc values (measured 3–4 weeks prior to RG7652 and/or immediately prior to statin administration) were used as the initial conditions for the indirect response model. Since no LDLc measurements were available between screening LDLc and RG7652 pre-dose baseline LDLc, a statin effect parameter was used to account for the lower pre-dose baseline LDLc in the statin treated group (Table II). This statin parameter also accounted for rebound after the cessation of statin treatment. Covariate analysis identified baseline LDLc to have a significant effect on the Emax parameter. However, the lower baseline LDLc in the statin-treated cohorts may confound the baseline LDLc and the Emax relationship. Since the Phase 1 study had very few subjects with high baseline LDLc in the statin cohorts or subjects with low baseline LDLc values in the nonstatin cohorts, we could not discern whether statin had an effect on Emax independent of its effect on the baseline LDLc. Thus, we chose to develop a model with statin treatment affecting the Emax, in addition to one ascribing an effect of baseline LDLc on Emax. The statin model was also used for simulations, since an additive effect between statins and anti-PCSK9 may be possible, based on the RG7652 mechanism of action. Statins are known to increase the expression of PCSK9 in the liver (27,28), potentially attenuating the LDLc-lowering effect of statin monotherapy and resulting in an additive effect between statins and anti-PCSK9. No other covariates were found to significantly influence the PD model parameters.
The key assumption of our modeling and simulation approach was that the response to RG7652 in CHD patients would be similar to that observed in healthy subjects. Although there were no available data in CHD patients receiving anti-PCSK9 monoclonal antibodies at the time we designed the study, subsequently Phase 2 data for two similar investigational drugs, REGN727 and AMG145, have been published. These data support the assumption that the effect of PCSK9 inhibition is similar in CHD patients and hypercholesterolemic subjects (29,30). The final PK and PD models were used to simulate a range of doses at three different dosing intervals, Q4W, Q8W, and Q12W. The dosing interval appears to have greater influence on LDLc-lowering effects than the dose, within the ranges of dose levels and intervals tested. As seen in Fig. 4, doubling the dose from 400 to 800 mg for a Q8W regimen increased the LDLc-lowering effect only by ~12 mg/dL (measured at the end of the dosing interval), whereas doubling the total dose by changing the dosing interval from Q8W to Q4W for a 400 mg dose increased the LDLc-lowering effect by ~27 mg/dL. Similar trends have been observed for other simulated regimens. This interval effect is expected based on the elimination half-life of RG7652; less frequent regimens result in less drug accumulation, hence less marked effects on PCSK9 and thus lower LDLc reduction. The simulations suggest that regimens with intervals greater than 12 weeks may not result in robust LDLc reduction over the entire dosing interval, as increasing the dosing interval increases fluctuation in the LDLc-lowering effect. Simulations from the statin model are presented in online supplemental material. In general, the statin model predicted greater LDLc lowering and greater number of subjects achieving LDLc levels less than 15 mg/dL due to statin effect parameter on Emax.
The value of the PK/PD model at this stage of the drug’s development was in reducing the number of doses/dosing regimens to be studied in Phase 2, by informing the development team of the anticipated treatment effect for a wide range of doses/dosing regimens and highlighting those that were expected to meet the team’s desired outcome profile. The following criteria were used to select Phase 2 doses: (a) the selected dose would be expected to produce a reduction in LDLc of at least 50 mg/dL at the end of the dosing interval, (b) the LDLc levels at nadir are predicted not to fall below 15 mg/dL limit for at least 80% of subjects, and (c) at least one sub-efficacious dose should be selected to improve the estimation of RG7652 dose response in CHD patients. The criterion to limit the number of patients with nadir levels below 15 mg/dL was included because of limited knowledge about the benefits and safety of LDLc reduction in this range. Published results from recent statin trials have not identified any patterns of adverse effects in patients achieving the lowest LDLc levels, and these patients appear to have the lowest rates of CHD events; however, relatively few patients in these trials had LDLc levels <15 mg/dL. The value of 15 mg/dL was also selected in part since individuals with PCSK9 loss-of-function genetic mutations in both alleles (compound heterozygotes) had LDLc values around 15 mg/dL with no apparent abnormalities (9,31).
Doses greater than and including 400 mg in Q4W and Q8W regimens met the first two selection criteria. None of the simulated Q12W dosing regimens met the first criteria. Based on the selection criteria, the following doses were recommended for inclusion in the Phase 2 study; 400 mg (Q4W), 400 mg (Q8W), and 800 mg (Q8W). Two doses (200 mg Q8W and 800 mg Q12W) were also included in the Phase 2 study in order to provide robust data to further characterize the PK/PD relationships. Assuming that the PK/PD in CHD patients is similar to healthy subjects, these 5 dose levels provide an opportunity to efficiently explore the dose-response relationship for RG7652. The proposed Phase 2 study (NCT01609140) has completed dosing, and its results will be reported following completion of the study.
The application of modeling and simulation has previously been shown to improve efficiency of drug development (23,32,33). Simulations based on the models incorporate prior knowledge, account for sources of variability, and allow testing various scenarios. Having identified a suitable PK and PD models to describe the Phase 1 data, we used the parameter estimates of the models to create simulations, which were used to guide Phase 2 dose selection. In summary, the PK and PD models successfully described the PK and LDLc data from healthy subjects in a Phase 1 study. The model-based simulations provided useful insights and quantitative understanding for the selection of Phase 2 study doses in CHD patients. This study and the approach further demonstrate the utility of modeling and simulation in designing dose-ranging studies.
Electronic Supplementary Material
Below is the link to the electronic supplementary material.
Goodness-of-fit plots for the models. Upper: Population predicted versus observed and individual predicted versus observed RG7652 concentrations in the PK model. Middle: Population predicted versus observed and individual predicted versus observed LDLc concentrations in the statin model. Lower: Population predicted versus observed and individual predicted versus observed LDLc concentrations in the baseline PD model. (JPEG 170 kb)
Predicted mean LDLc change from baseline at 24 weeks versus milligrams of RG7652 dose per four weeks (left panel) and predicted % subjects with nadir LDLc < 15 mg/dL (right panel) at three regimens for the statin model. (JPEG 128 kb)
Predicted serum LDLc profiles for simulated Phase 2 trials using the statin model. The solid black line indicates the mean of 100 simulated trials and the gray band indicates the 90% prediction intervals. The dotted gray line indicates 50 mg/dL reduction in LDLc from baseline. Upper: Predicted profiles for Q4W regimens. Middle: Predicted profiles for the Q8W regimens. Lower: Predicted profiles for Q12W regimens. (JPEG 201 kb)
Parameter estimates for the RG7652 population PD model (the statin model) (DOCX 16 kb)
Predicted serum LDLc data based on Phase 2 trial simulations using the statin model. The values indicate the mean of 100 simulated trials* and the parentheses include 90% prediction intervals. (DOCX 17 kb)
ACKNOWLEDGMENTS
The authors would like to acknowledge Genentech’s protocol execution team for their assistance in this study.
Conflict of Interest
N.R.B., M.L., J.Y.J., A.B..., K.P., W.G.T., and J.D.D. were employees of Genentech at the time this research was performed and owned stock in Roche. R.W. is a paid consultant to Genentech.
Author Contributions
N.R.B., R.W., and J.D.D. wrote the manuscript. W.G.T., A.B..., and M.L. designed the research. N.R.B., M.L., J.Y.J., R.W., A.B..., K.P., W.G.T., and J.D.D. analyzed the data.
References
- 1.Conti CR. Evolution of NCEP guidelines: ATP1-ATPIII risk estimation for coronary heart disease in 2002 National Cholesterol Education Program. Clin Cardiol. 2002;25(3):89–90. doi: 10.1002/clc.4960250302. [DOI] [PMC free article] [PubMed] [Google Scholar]
- 2.Third report of the National Cholesterol Education Program (NCEP) expert panel on detection, evaluation, and treatment of high blood cholesterol in adults (adult treatment panel III) final report. Circulation. 2002;106(25):3143-421. [PubMed]
- 3.Sniderman A, Thanassoulis G, Couture P, Williams K, Alam A, Furberg CD. Is lower and lower better and better? A re-evaluation of the evidence from the Cholesterol Treatment Trialists’ Collaboration meta-analysis for low-density lipoprotein lowering. J Clin Lipidol. 2012;6(4):303–9. doi: 10.1016/j.jacl.2012.05.004. [DOI] [PubMed] [Google Scholar]
- 4.Pearson TA. Primary and secondary prevention of coronary artery disease: trials of lipid lowering with statins. Am J Cardiol. 1998;82(10A):28S–30. doi: 10.1016/S0002-9149(98)90428-3. [DOI] [PubMed] [Google Scholar]
- 5.Udell JA, Ray JG. Primary and secondary prevention of heart failure with statins. Expert Rev Cardiovasc Ther. 2006;4(6):917–26. doi: 10.1586/14779072.4.6.917. [DOI] [PubMed] [Google Scholar]
- 6.Keaney JF, Jr., Curfman GD, Jarcho JA. A pragmatic view of the new cholesterol treatment guidelines. The New England journal of medicine. 2013. [DOI] [PubMed]
- 7.Grundy SM, Cleeman JI, Merz CN, Brewer HB, Jr, Clark LT, Hunninghake DB, et al. Implications of recent clinical trials for the National Cholesterol Education Program Adult Treatment Panel III guidelines. Circulation. 2004;110(2):227–39. doi: 10.1161/01.CIR.0000133317.49796.0E. [DOI] [PubMed] [Google Scholar]
- 8.Weart CW, Hogan RJ. Event reduction: revisiting why we treat with statins and harnessing current evidence towards optimal therapy. Expert Opin Pharmacother. 2011;12(1):99–117. doi: 10.1517/14656566.2010.516747. [DOI] [PubMed] [Google Scholar]
- 9.Zhao Z, Tuakli-Wosornu Y, Lagace TA, Kinch L, Grishin NV, Horton JD, et al. Molecular characterization of loss-of-function mutations in PCSK9 and identification of a compound heterozygote. Am J Hum Genet. 2006;79(3):514–23. doi: 10.1086/507488. [DOI] [PMC free article] [PubMed] [Google Scholar]
- 10.Hooper AJ, Marais AD, Tanyanyiwa DM, Burnett JR. The C679X mutation in PCSK9 is present and lowers blood cholesterol in a Southern African population. Atherosclerosis. 2007;193(2):445–8. doi: 10.1016/j.atherosclerosis.2006.08.039. [DOI] [PubMed] [Google Scholar]
- 11.Baigent C, Keech A, Kearney PM, Blackwell L, Buck G, Pollicino C, et al. Efficacy and safety of cholesterol-lowering treatment: prospective meta-analysis of data from 90,056 participants in 14 randomised trials of statins. Lancet. 2005;366(9493):1267–78. doi: 10.1016/S0140-6736(05)67394-1. [DOI] [PubMed] [Google Scholar]
- 12.Patel TN, Shishehbor MH, Bhatt DL. A review of high-dose statin therapy: targeting cholesterol and inflammation in atherosclerosis. Eur Heart J. 2007;28(6):664–72. doi: 10.1093/eurheartj/ehl445. [DOI] [PubMed] [Google Scholar]
- 13.Jones PH, Nair R, Thakker KM. Prevalence of dyslipidemia and lipid goal attainment in statin-treated subjects from 3 data sources: a retrospective analysis. J Am Heart Assoc. 2012;1(6):e001800. doi: 10.1161/JAHA.112.001800. [DOI] [PMC free article] [PubMed] [Google Scholar]
- 14.Perk J, De Backer G, Gohlke H, Graham I, Reiner Z, Verschuren M, et al. European Guidelines on cardiovascular disease prevention in clinical practice (version 2012). The Fifth Joint Task Force of the European Society of Cardiology and Other Societies on Cardiovascular Disease Prevention in Clinical Practice (constituted by representatives of nine societies and by invited experts) Eur Heart J. 2012;33(13):1635–701. doi: 10.1093/eurheartj/ehs092. [DOI] [PubMed] [Google Scholar]
- 15.Reiner Z, Catapano AL, De Backer G, Graham I, Taskinen MR, Wiklund O, et al. ESC/EAS Guidelines for the management of dyslipidaemias: the Task Force for the management of dyslipidaemias of the European Society of Cardiology (ESC) and the European Atherosclerosis Society (EAS) Eur Heart J. 2011;32(14):1769–818. doi: 10.1093/eurheartj/ehr158. [DOI] [PubMed] [Google Scholar]
- 16.Knopp RH, Dujovne CA, Le Beaut A, Lipka LJ, Suresh R, Veltri EP. Evaluation of the efficacy, safety, and tolerability of ezetimibe in primary hypercholesterolaemia: a pooled analysis from two controlled phase III clinical studies. Int J Clin Pract. 2003;57(5):363–8. [PubMed] [Google Scholar]
- 17.Benjannet S, Saavedra YG, Hamelin J, Asselin MC, Essalmani R, Pasquato A, et al. Effects of the prosegment and pH on the activity of PCSK9: evidence for additional processing events. J Biol Chem. 2010;285(52):40965–78. doi: 10.1074/jbc.M110.154815. [DOI] [PMC free article] [PubMed] [Google Scholar]
- 18.Peterson AS, Fong LG, Young SG. PCSK9 function and physiology. J Lipid Res. 2008;49(6):1152–6. doi: 10.1194/jlr.E800008-JLR200. [DOI] [PMC free article] [PubMed] [Google Scholar]
- 19.Cohen JC, Boerwinkle E, Mosley TH, Jr, Hobbs HH. Sequence variations in PCSK9, low LDL, and protection against coronary heart disease. N Engl J Med. 2006;354(12):1264–72. doi: 10.1056/NEJMoa054013. [DOI] [PubMed] [Google Scholar]
- 20.Horton JD, Cohen JC, Hobbs HH. PCSK9: a convertase that coordinates LDL catabolism. J Lipid Res. 2009;50(Suppl):S172–7. doi: 10.1194/jlr.R800091-JLR200. [DOI] [PMC free article] [PubMed] [Google Scholar]
- 21.Whittemore Tingley, Diana Luca, Maya Leabman, Nageshwar Budha, Robert Kahn, Amos Baruch, et al. A phase 1, randomized, placebo-controlled study of RG7652, a fully human monoclonal antibody against proprotein convertase subtilisin/kexin type 9. (draft manuscript). 2013.
- 22.Sheiner LB. Learning versus confirming in clinical drug development. Clin Pharmacol Ther. 1997;61(3):275–91. doi: 10.1016/S0009-9236(97)90160-0. [DOI] [PubMed] [Google Scholar]
- 23.Sheiner LB, Steimer JL. Pharmacokinetic/pharmacodynamic modeling in drug development. Annu Rev Pharmacol Toxicol. 2000;40:67–95. doi: 10.1146/annurev.pharmtox.40.1.67. [DOI] [PubMed] [Google Scholar]
- 24.Sharma A, Jusko WJ. Characterization of four basic models of indirect pharmacodynamic responses. J Pharmacokinet Biopharm. 1996;24(6):611–35. doi: 10.1007/BF02353483. [DOI] [PubMed] [Google Scholar]
- 25.Udata C, Garzone P, Gumbiner B, Joh T, Forgues P, Levisetti M, et al. A mechanism-based pharmacokinetic-pharmacodynamic model for Rn316 (Pf-04950615), a humanized mab against proprotein convertase subtilisin/kexin type 9 (Pcsk9), and its application in early clinical development. Clin Pharmacol Ther (St Louis, MO, U S) 2013;93:S51–2. doi: 10.1038/clpt.2012.255. [DOI] [Google Scholar]
- 26.Lee AY, Yates NA, Ichetovkin M, Deyanova E, Southwick K, Fisher TS, et al. Measurement of fractional synthetic rates of multiple protein analytes by triple quadrupole mass spectrometry. Clin Chem. 2012;58(3):619–27. doi: 10.1373/clinchem.2011.172429. [DOI] [PubMed] [Google Scholar]
- 27.Careskey HE, Davis RA, Alborn WE, Troutt JS, Cao G, Konrad RJ. Atorvastatin increases human serum levels of proprotein convertase subtilisin/kexin type 9. J Lipid Res. 2008;49(2):394–8. doi: 10.1194/jlr.M700437-JLR200. [DOI] [PubMed] [Google Scholar]
- 28.Dubuc G, Chamberland A, Wassef H, Davignon J, Seidah NG, Bernier L, et al. Statins upregulate PCSK9, the gene encoding the proprotein convertase neural apoptosis-regulated convertase-1 implicated in familial hypercholesterolemia. Arterioscler, Thromb, Vasc Biol. 2004;24(8):1454–9. doi: 10.1161/01.ATV.0000134621.14315.43. [DOI] [PubMed] [Google Scholar]
- 29.Giugliano RP, Desai NR, Kohli P, Rogers WJ, Somaratne R, Huang F, et al. Efficacy, safety, and tolerability of a monoclonal antibody to proprotein convertase subtilisin/kexin type 9 in combination with a statin in patients with hypercholesterolaemia (LAPLACE-TIMI 57): a randomised, placebo-controlled, dose-ranging, phase 2 study. Lancet. 2012;380(9858):2007–17. doi: 10.1016/S0140-6736(12)61770-X. [DOI] [PMC free article] [PubMed] [Google Scholar]
- 30.McKenney JM, Koren MJ, Kereiakes DJ, Hanotin C, Ferrand AC, Stein EA. Safety and efficacy of a monoclonal antibody to proprotein convertase subtilisin/kexin type 9 serine protease, SAR236553/REGN727, in patients with primary hypercholesterolemia receiving ongoing stable atorvastatin therapy. J Am Coll Cardiol. 2012;59(25):2344–53. doi: 10.1016/j.jacc.2012.03.007. [DOI] [PubMed] [Google Scholar]
- 31.Cohen J, Pertsemlidis A, Kotowski IK, Graham R, Garcia CK, Hobbs HH. Low LDL cholesterol in individuals of African descent resulting from frequent nonsense mutations in PCSK9. Nat Genet. 2005;37(2):161–5. doi: 10.1038/ng1509. [DOI] [PubMed] [Google Scholar]
- 32.Zhang L, Pfister M, Meibohm B. Concepts and challenges in quantitative pharmacology and model-based drug development. AAPS J. 2008;10(4):552–9. doi: 10.1208/s12248-008-9062-3. [DOI] [PMC free article] [PubMed] [Google Scholar]
- 33.Chien JY, Friedrich S, Heathman MA, de Alwis DP, Sinha V. Pharmacokinetics/pharmacodynamics and the stages of drug development: role of modeling and simulation. AAPS J. 2005;7(3):E544–59. doi: 10.1208/aapsj070355. [DOI] [PMC free article] [PubMed] [Google Scholar]
Associated Data
This section collects any data citations, data availability statements, or supplementary materials included in this article.
Supplementary Materials
Goodness-of-fit plots for the models. Upper: Population predicted versus observed and individual predicted versus observed RG7652 concentrations in the PK model. Middle: Population predicted versus observed and individual predicted versus observed LDLc concentrations in the statin model. Lower: Population predicted versus observed and individual predicted versus observed LDLc concentrations in the baseline PD model. (JPEG 170 kb)
Predicted mean LDLc change from baseline at 24 weeks versus milligrams of RG7652 dose per four weeks (left panel) and predicted % subjects with nadir LDLc < 15 mg/dL (right panel) at three regimens for the statin model. (JPEG 128 kb)
Predicted serum LDLc profiles for simulated Phase 2 trials using the statin model. The solid black line indicates the mean of 100 simulated trials and the gray band indicates the 90% prediction intervals. The dotted gray line indicates 50 mg/dL reduction in LDLc from baseline. Upper: Predicted profiles for Q4W regimens. Middle: Predicted profiles for the Q8W regimens. Lower: Predicted profiles for Q12W regimens. (JPEG 201 kb)
Parameter estimates for the RG7652 population PD model (the statin model) (DOCX 16 kb)
Predicted serum LDLc data based on Phase 2 trial simulations using the statin model. The values indicate the mean of 100 simulated trials* and the parentheses include 90% prediction intervals. (DOCX 17 kb)