Abstract
Various health communities have expressed concerns regarding whether average bioequivalence (BE) limits (80.00–125.00%) for the 90% confidence interval of the test-to-reference geometric mean ratio are sufficient to ensure therapeutic equivalence between a generic narrow therapeutic index (NTI) drug and its reference listed drug (RLD). Simulations were conducted to investigate the impact of different BE approaches for NTI drugs on study power, including (1) direct tightening of average BE limits and (2) a scaled average BE approach where BE limits are tightened based on the RLD’s within-subject variability. Addition of a variability comparison (using a one-tailed F test) increased the difficulty for generic NTIs more variable than their corresponding RLDs to demonstrate bioequivalence. Based on these results, the authors evaluate the fully replicated, 2-sequence, 2-treatment, 4-period crossover study design for NTI drugs where the test product demonstrates BE based on a scaled average bioequivalence criterion and a within-subject variability comparison criterion.
KEY WORDS: generic drugs, narrow therapeutic index (NTI) drugs, reference-scaled average bioequivalence, within-subject variability
INTRODUCTION
In the USA, a generic drug is approved based on its pharmaceutical equivalence and bioequivalence (BE) to the reference listed drug (RLD). BE studies are generally conducted by comparing the in vivo rate and extent of drug absorption of a test and a RLD product in a 2-sequence, 2-treatment, 2-period crossover study in healthy subjects, where the test drug refers to the generic drug under investigation (or under development). A test product is considered to be bioequivalent to a reference product if the 90% confidence interval (CI) of the geometric mean ratio (GMR) of AUC (area under the concentration vs. time curve) and Cmax (maximum concentration) between the test and reference fall within the limits of 80.00–125.00%. This approach is based on the assumption that a 20% difference between the test and reference products is not clinically significant. A crossover BE study outcome can be affected by study sample size and the within-subject variability (WSV) (1,2). WSV refers to variability in a response (e.g., plasma drug concentration) within the same subject, when the subject is administered two doses of the same drug on two different occasions (3). This variability may be intrinsic to the drug substance and/or the formulation, but may also include analytical variability, drug product quality variability, physiological or pathological variability of the subject, and unexplained random variation. WSV is usually measured by within-subject variance (σWR2) or within-subject standard deviation (σWR). Given the same sample size and mean test/reference ratio, drugs with smaller WSV would, in most cases, more easily pass the conventional average BE limits of 80.00–125.00%.
For narrow therapeutic index (NTI) drugs—where small differences in dose or blood concentration may lead to serious therapeutic failures and/or adverse drug reactions (4)—a 20% difference in blood concentration or drug exposure may be unacceptable. Although the US Food and Drug Administration (FDA) does not currently provide a list of NTI drugs, digoxin, lithium carbonate, phenytoin, tacrolimus, theophylline, and warfarin are usually considered NTI drugs by many experts (5,6). At the April 2010 Advisory Committee for Pharmaceutical Science and Clinical Pharmacology (ACPSCP) meeting on NTI drugs, the committee voted 11-2 that the average BE limits of 80.00–125.00% are not sufficient for critical dose or NTI drugs (7). They commented that “the requirements for confidence intervals should perhaps be narrower (90–111%) and should include 100% (or 1.0)” and “Replicate studies are important”. Currently, Health Canada has tightened the average BE limits of AUC for critical dose drugs to 90.0–112.0% (5), while the European Medicines Agency (EMA) also has expressed that in specific cases of products with NTIs, the acceptance interval for AUC should be tightened to average BE limits of 90.00–111.11% (8). Where Cmax is of particular importance for safety, efficacy, or drug level monitoring, the 90.00–111.11% acceptance interval should also be applied for this parameter (8).
This paper’s authors considered the ACPSCP’s recommendation (April 2010 and July 2011) and evaluated various approaches to demonstrate BE of NTI drugs. These approaches included (1) direct tightening of average BE limits (as Health Canada and EMA recommended) and (2) a scaled average BE approach where BE limits are tightened based on the RLD’s WSV. In addition, if an NTI test product’s WSV is greater than the reference product’s WSV, the larger variation in blood concentration may increase the likelihood of therapeutic failures and/or adverse reactions. As such, the authors also evaluated methods and study designs to determine if the generic product has equal or less WSV than its reference product to ensure interchangeability within a subject. This approach has been discussed at a high level in recent publications (9–11), as well as in revised BE guidance for warfarin sodium tablets (4) and tacrolimus capsules (12).
In this article, we will present modeling and simulation work conducted to support the above approach. This study’s specific objective was to evaluate different bioequivalence approaches for NTI drugs by conducting power estimation under various conditions with different regulatory constraint values and variability comparison criterion.
METHODS
Theory
In a fully replicated, 2-sequence, 2-treatment, 4-period, crossover BE study (sequence 1: TRTR, and sequence 2: RTRT) without missing observations, all subjects provide two observations on T and R, respectively. The number of subjects in each sequence is n1 and n2 for sequences 1 and 2, respectively. An observation, in this context, is a natural log-transformed pharmacokinetic (PK) parameter, ln(AUCt), ln(AUCinf), or ln(Cmax), where AUCt is the area under the concentration vs. time curve from time zero to time t, the last time point with a measurable concentration, and AUCinf is the area under the concentration vs. time curve from time zero to time infinity.
The following quantities are defined to be used in further equations:
Tijk = kth observation (k = 1 or 2) on T for subject j within sequence i
Rijk = kth observation (k = 1 or 2) on R for subject j within sequence i
| 1 |
| 2 |
Iij is the difference between the mean of a subject’s (specifically subject j within sequence i) two observations on T and the mean of the subject’s two observations on R, while Dij is the difference between a subject’s two observations on R. The Iij’s and the Dij’s are statistically independent under an assumption of normality for the distribution of subject-specific means. The Iij’s and Dij’s are uncorrelated in any event.
Under the assumed model described in the guidance for industry, “Statistical Approaches to Establishing Bioequivalence” (13), the variance of the Iij’s is
| 3 |
and the variance of the Dij’s is , where and are within-subject variances of T and R, respectively, and is the subject-by-formulation variance component.
Define
| 4 |
| 5 |
and
| 6 |
where , , and is the estimated within-subject variance of R. s2WT, the estimated within-subject variance of T, can be calculated in the same way using the difference between a subject’s two observations on T.Under normality assumptions, we have the following distributional results:
| 7 |
| 8 |
| 9 |
| 10 |
All three quantities are statistically independent.
For the reference-scaled bioequivalence testing, the null and alternative hypotheses are described by Eqs. (11) and (12), respectively:
| 11 |
| 12 |
where μT and μR are the averages of the natural log-transformed PK measure (such as AUC and Cmax) for the test and reference products, respectively; σWR is the within-subject standard deviation for the reference product; and θ is the scaled average BE limit (θ > 0).
The relationship between GMR and (μT − μR) can be expressed by
| 13 |
The alternative hypothesis can be re-written as
| 14 |
Furthermore,
| 15 |
where Δ is the upper BE limit for test/reference ratio of geometric means, and σW0 is a regulatory constant.
The strategy for testing this hypothesis is to obtain a 1 − α (i.e., 95%) upper confidence bound for the quantity (μT − μR)2 − θ × σ2WR and to reject H0 in favor of H1 if this confidence bound is less than or equal to zero. The method of obtaining the upper confidence bound is Howe’s approximation I (14).
WSV comparison of the test and reference products is carried out by a one-side F test. The null hypothesis for this test is
| 16 |
And the alternative hypothesis is
| 17 |
where σWT is the within-subject standard deviation for the test product and δ is the regulatory limit to declare the WSV of the test product not greater than that of the reference product. The (1 − α) 100% CI for σWT/σWR is given by
| 18 |
Here, α = 0.1, and are the values of the F distribution with v1 (numerator) and v2 (denominator) degrees of freedom that has a probability of α/2 and 1 − α/2 to its right, respectively.
Simulations
Fully replicated, 2-sequence, 2-treatment, 4-period, crossover BE studies were simulated using R (The R Project for Statistical Computing). Since NTI drugs generally have small to moderate WSV and replicate study designs are recommended to demonstrate BE, n = 24 is considered a reasonable and practical sample size to estimate the study power. Generally, the number of subjects required to demonstrate BE can be reduced by up to about 50% in a fully replicated study design compared to a conventional two-way crossover study design. The simulations discussed in this paper are based on n = 24 except when indicated otherwise.
To evaluate the power of each testing condition, 1 million studies were simulated and the percentage of passing studies was calculated for different criteria described in detail in the following sections. For each simulation, μT − μR is sampled from normal distribution with mean of ln(GMR) and variance of (Eq. 7). s2WR and s2WT are sampled from chi-squared distribution with (n − 2) degrees of freedom described in Eqs. 9 and 10, respectively. SI2 was calculated from s2WR, s2WT, and s2D, s2I = s2D + 0.5 × (s2WR + s2WT). The values of GMR, σWR and σWT/σWR are predefined fixed values. The 95% upper confidence boundary for (μT − μR)2 − θ × σ2WR is calculated by Howe’s approximation I (14). The 90% CI for σWT/σWR is calculated by Eq. 18. No subject-by-formulation interaction variation is assumed (i.e., σ2D = 0). The tested values for each parameter are summarized in Table I.
Table I.
Values of Parameters that Are Tested in the Simulations
| Variables | Tested values |
|---|---|
| Number of subjects, n | 24 |
| GMR | 0.8–1.25 with a step of 0.01 |
| σ WR | 0.05, 0.10, 0.15, 0.25 |
| σ WT/ σ WR | 0.5–4 with a step of 0.02 |
| σ W0 | 0.10, 0.25 |
| Δ | 1.11 (1/0.9), 1.25 |
| δ | 1.25, 1.5, 2.0, 2.5 |
| Point estimate constraint | 80–125%, 90–111.11%, 95–105.263% |
GMR geometric mean ratio
Investigation on the Variability of Within-subject Variability
In the furosemide AUC data set provided by Professor Leslie Benet, all 10 subjects received furosemide with and without orange juice. Since it was concluded that no effect of orange juice was observed on the PK of furosemide, each subject was considered to have received the same three treatments. Simulations were conducted to assess (1) variability of s2WR, (2) passing rate using the upper limit of the 90% CI for σWT/σWR ≤ 2.5 criterion, and (3) comparison of the observed distribution of s2WT/s2WR and theoretical F distribution.
To assess the variability of WSV, the following steps were conducted: (1) randomly select two data points from the three data points from each subject as references 1 and 2 in a four-way crossover study, (2) fix the sequence as [1-2-1-2-1-2-1-2-1-2], and (3) calculate sWR. The distribution of sWR is plotted based on 5000 times of the above simulations.
To assess the passing rate using the upper limit of the 90% CI for σWT/σWR ≤ 2.5, the following steps were conducted: (1) randomly select two data points from the three data points from each subject as references 1 and 2 in a four-way crossover study, (2) randomly select two data points from the three data points from each subject as test 1 and test 2 in a four-way crossover study, (3) fix the sequence as [1-2-1-2-1-2-1-2-1-2], (4) calculate the sWR, sWT, and the upper bound of the 90% CI for sWT/sWR, and (5) repeat 5000 times and calculate the passing ratio based on the variability comparison criterion. Finally, the distribution of s2WT/s2WR are compared with theoretical F8,8 distribution.
RESULTS
Effect of σW0 and Δ on Implied BE Limits
The scaling model has two regulatory constants: σW0 and Δ. They affect the 90% CI limits and the power of a BE study at a given WSV level. Two values of σW0 (0.10 and 0.25) and two values of Δ (1.11 and 1.25) were examined (Fig. 1). At a given σW0, Δ = 1.11 gives a narrower BE limit than Δ = 1.25. Specifically, when σW0 = 0.10 and Δ = 1.11 (Note: 1.11 = 1/0.9), 90% CI limits become 80–125% when the coefficient of variation (CV; calculated from σWR, the within-subject standard deviation of the reference product on the log scale, using the equation ) is around 21%. When σW0 = 0.10 and Δ = 1.25, 90% CI limits become 80–125% when the CV is around 10%.
Fig. 1.
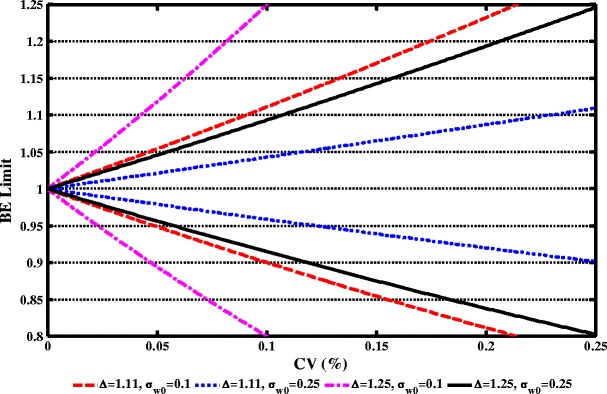
Effect of σ W0 and Δ on implied BE limits. Red Δ = 1.11, σ W0 = 0.10; blue Δ = 1.11, σ W0 = 0.25; magenta Δ = 1.25, σ W0 = 0.10; and black Δ = 1.25, σ W0 = 0.25. Note: 1.11 = 1/0.9
At a given Δ, the implied BE limits at σW0 = 0.25 are narrower than those at σW0 = 0.10. Specifically, when Δ = 1.11 and the CV is within 10%, the implied BE limits are within 90–111% at σW0 = 0.10 and are within 95–105% at σW0 = 0.25. As such, Δ = 1.11 and σW0 = 0.10 were selected for further analysis because at σW0 = 0.10 (i.e., a common value to define small WSV), the implied BE limits coincide with other major health regulatory standards for NTI drugs.
Comparison of Narrower Average BE Limits and Scaled BE Limits on Study Power and the Effect of Point Estimate Constraints (PECs)
Figure 2 compares passing rates under the average BE criteria and under the scaled BE criterion in combination with different PECs, using 24 subjects (n = 24). Capping criterion, which will be discussed later, has not been applied here. The PEC criterion is that the point estimate of GMR falls within a given range (e.g., 90.00–111.00, 95.00–105.263, or 80.00–125.00%).
Fig. 2.
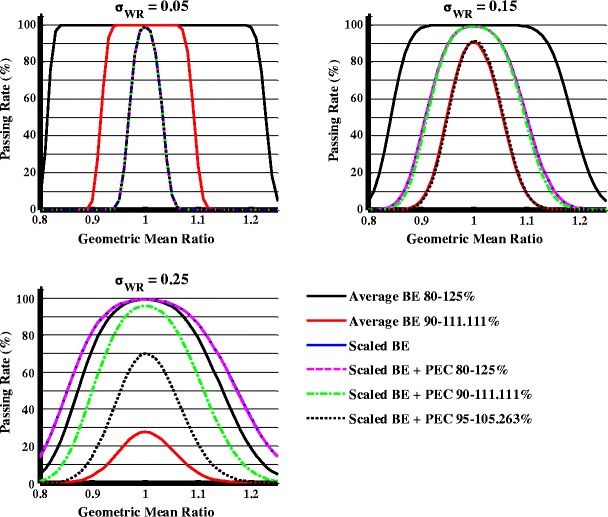
Effect of point estimate on study power under different σ WR values when σ WT = σ WR, n = 24
When the average BE criteria are applied, narrower BE limits of 90.00–111.11% have a lower passing rate. When the RLD is compared to itself or an identical generic product (i.e., GMR = 1, σWT = σWR), the passing rate with BE limits of 90.00–111.11% is 91.18% when σWR = 0.15 and 27.69% when σWR = 0.25. When the GMR is 0.95 and σWT = σWR, the passing rate with BE limits of 90.00–111.11% is 52% when σWR = 0.15 and 17% when σWR = 0.25. In contrast, the scaled average BE criterion ensures a 100% passing rate when the RLD is compared to itself or an identical generic product.
The impact of PECs on study power was evaluated with scaled BE limits. When σWT = σWR = 0.05, PECs do not significantly affect study power based on scaled BE criteria. However, when σWT = σWR = 0.15 or 0.25, PECs may decrease the study power. When the RLD is compared to itself, at σWR = 0.15, the passing rate dropped from 99 to 92% with a PEC of 95–105%, while at σWR = 0.25, the passing rate dropped from 99 to 96% with a PEC of 90–111% and dropped to 70% with a PEC of 95–105%. When the GMR = 0.95, at σWR = 0.15, the passing rate dropped from 89 to 50% with a PEC of 95–105%, while at σWR = 0.25, the passing rate dropped from 97 to 85% with a PEC of 90–111% and dropped to 48% with a PEC of 95–105%.
The authors also investigated the effect of an additional constraint: that BE CI limits should contain 100%, on study power. With this added constraint, when the RLD is compared to an identical generic product or itself, the chance of passing never exceeds 90% because there is always a 10% chance that the 90% CI will not contain 100% (15). Simulation also showed that study power decreases with increasing sample sizes.
Approaches to Ensure BE Limits Are Never Wider than 80.00–125.00%
The reference-scaled BE limits can expand beyond 80.00–125.00% as the reference WSV increases. There arises the concern that an inappropriately conducted study resulting in high WSV could pass the scaled BE criteria when it would not be accepted using the current limits. The authors evaluated two approaches to ensure that the BE limits are never wider than 80.00–125.00%: (1) stop scaling at certain estimated within-subject standard deviation of the reference product (sWR) and (2) require that the study pass both scaled BE limits and average BE limits of 80.00–125.00%. When σW0 = 0.10 and Δ = 1.11, the cutoff value of sWR is around 0.21. Both of these approaches preserve the actual level of significance at no more than 5% (15). The second approach has the advantage of not specifying the threshold limit to stop scaling; thus, it was selected for further evaluation.
The Power of the Average BE Criterion and the Scaled + Capping BE Criterion Under Different σWT/σWR Ratios
When the scaled BE limits are wider than the standard average BE limits, both the standard average and scaled BE criteria should be applied (the combination of standard average and scaled BE criteria will be termed scaled + capping BE criterion hereafter). Figure 3 describes the impact of the scaled + capping BE criterion on study power in comparison to the average BE criterion under different σWT/σWR ratios at σWR = 0.1, 0.2, or 0.25.
Fig. 3.
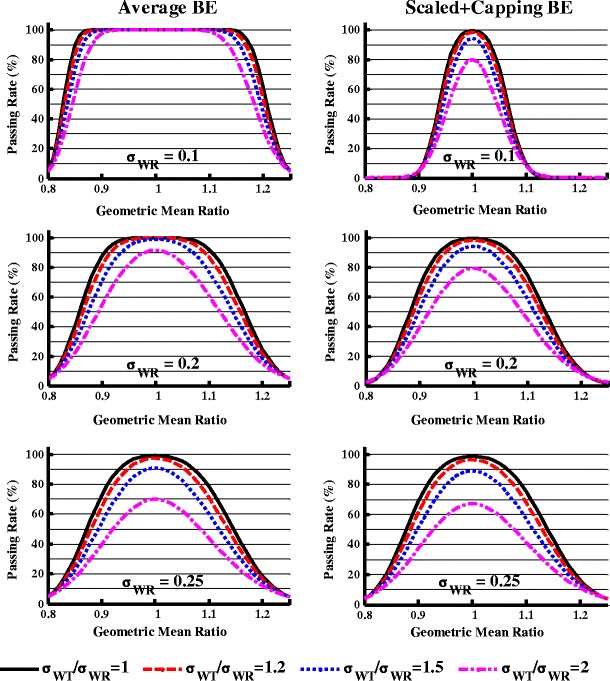
The effect of within-subject variability difference on the study power when evaluated by the average bioequivalence (left panel) and the scaled average bioequivalence + capping criteria (right panel), n = 24
When σWR = 0.1 (Fig. 3, upper panel), using the average BE limit, the study power was always close to 100% when the GMR varied between 0.95 and 1.05 and σWT/σWR ranged from 1 to 2. In contrast, when the σWT/σWR increased from 1 to 2, using the scaled + capping BE criterion, at GMR = 1, the study power dropped from 99 to 80%, while at GMR = 1.05, the study power dropped from 74 to 46%.
When σWR = 0.2 (Fig. 3, middle panel), GMR = 1, and n = 24, when the σWT/σWR ratio increased from 1 to 2, the study power dropped from 100% to about 91% when evaluated by the average BE limits of 80.00–125.00%. When evaluated by the scaled + capping BE criterion, the study power decreased from 99 to 79% under the same conditions. When the GMR = 1.05 and the σWT/σWR ratio increased from 1 to 2, the study power decreased from 99 to 83% and 95 to 68% as evaluated by the average BE and the scaled + capping BE criterion, respectively.
When σWR = 0.25 (Fig. 3, lower panel), similar study power was observed for each σWT/σWR ratio when evaluated by the average BE and the scaled + capping BE criterion. This is because when σWR = 0.25, the capping criterion takes over the scaling criterion.
Effect of Various Variability Comparison Schemes and Standard Values on the Study Power for Different σWT/σWR Ratios
An F test evaluates whether the WSV of test and reference products are similar by calculating the 90% CI for the ratio of the within-subject standard deviation of test product to reference product σWT/σWR and comparing the CI to a standard (δ). Figure 4 demonstrates the study power in three equivalence evaluation schemes when n = 24, GMR = 1, σWR = 0.1, and the standard value is set at 1.25, 1.5, 2, or 2.5. The three schemes were as follows:
-
I)
Pass if the UPPER limit of the 90% CI for σWT/σWR ≤ δ;
-
II)
Pass if the LOWER limit of the 90% CI for σWT/σWR ≤ δ; and
-
III)
Pass if the ESTIMATE, sWT/sWR, is ≤δ.
Fig. 4.
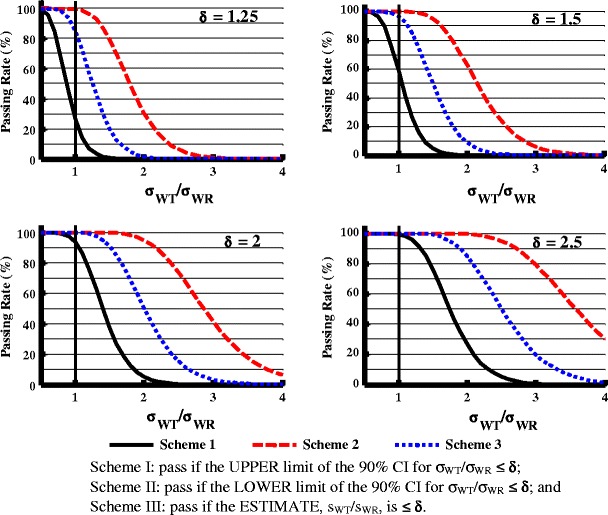
Effect of variability comparison evaluation schemes (I, II, and III) and the regulatory standard (δ) on the study power (σ WR = 0.1), n = 24. Scheme I pass if the UPPER limit of the 90% CI for σ WT/σ WR ≤ δ, Scheme II pass if the LOWER limit of the 90% CI for σ WT/σ WR ≤ δ, and Scheme III pass if the ESTIMATE, sWT/sWR, is ≤δ
When δ = 1.25 and σWT/σWR = 1, there was about 25, 98, and 85% study power with schemes I, II, and III, respectively. When the standard value was increased to 1.5, 2, and 2.5, the study power increased significantly in all three schemes. When σWT/σWR is greater than 1, the study power follows this order: scheme I < scheme III < scheme II. For example, when δ = 2.5, at σWT/σWR = 2, the study powers for schemes I, II, and III are 25, 99, and 85%, respectively.
Effect of Combined Scaled + Capping BE Criterion and Variability Comparison Criterion on the Study Power Under Different σWT/σWR
In Fig. 5, when σWR = 0.1, GMR = 1, n = 24, and σWT/σWR = 1.2, the study power was about 98, 96, and 76%, respectively, when examined separately by the scaled limits, variability comparison criterion scheme I with δ = 2.5, and variability comparison criterion scheme I with δ = 2.0. When GMR = 1 and it was evaluated with both the scaled limits and variability comparison criterion, the overall study power was slightly lower (less than 2%) compared with being evaluated with variability comparison criterion scheme I alone. The study power decreased further when the GMR moved away from 1. When σWT/σWR increased to 2, the study power dropped below 30% (δ = 2.5) or 10% (δ = 2) when evaluated by the variability comparison criterion or the scaled plus variability comparison criterion. Figure 5 shows that the variability comparison criterion will reject the test product with much higher WSV than the reference product.
Fig. 5.
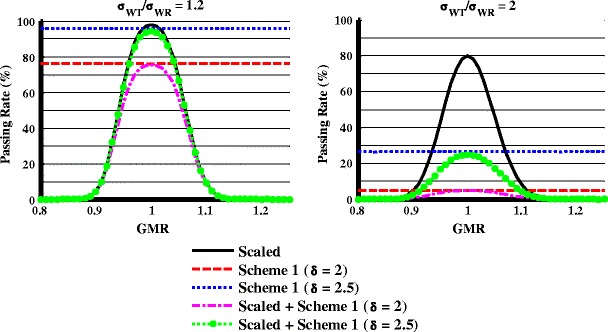
Effect of scaled average bioequivalence criteria, variability comparison criterion, and their combination on the study power at different σ WT/σ WR ratios when σ WR = 0.1, n = 24
Figure 6 shows the study power at different σWT/σWR values (n = 24) when evaluated by the combination of the scaled + capping BE criterion and the variability comparison criterion using scheme I with δ = 2 or 2.5. With δ = 2 (Fig. 6, left panel), when GMR = 1 and σWT/σWR = 1.2, less than 80% of studies can pass in all cases, suggesting this criterion is too strict. When δ = 2.5 (Fig. 6, right panel), at σWR = 0.1 and GMR = 1.025, more than 80% study power can be obtained when the σWT/σWR is within 1.2. At σWR = 0.2 and GMR = 1.05, more than 80% study power can be obtained when the σWT/σWR is within 1.2. Finally, when σWT/σWR > 2, there is less than a 20% chance of passing the study with δ = 2.5 as the limit regardless the value of σWR.
Fig. 6.
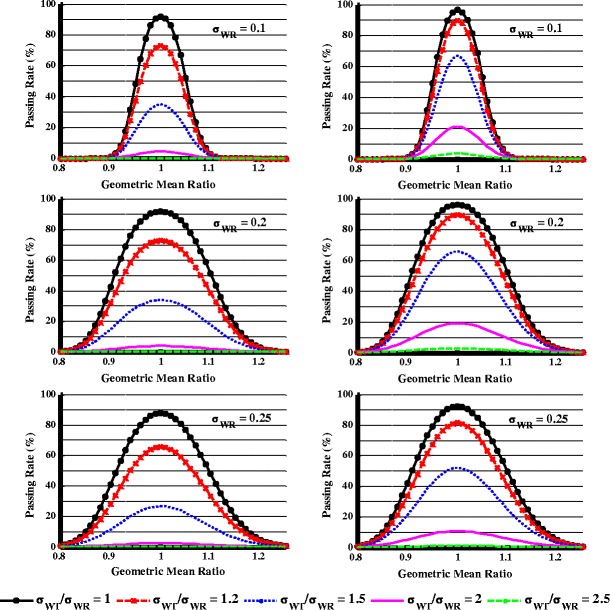
Effect of within-subject variability difference on the study power when evaluated by combination of scaled + capping BE and variability comparison criterion, n = 24. Variability comparison criterion used was scheme I with δ = 2 (left panel) or δ = 2.5 (right panel)
Investigation on the Variability of Within-subject Variability
A concern is that if the variability of the WSV is too large, the chance is high that a reference to reference comparison may fail the variability comparison criterion. To investigate the effect of variability of within-subject variability on variability comparison criterion or to assess whether the selected regulatory constant for the upper limit of the 90% equal-tails confidence interval for σWT/σWR is appropriate, a subject needs to receive the same treatment at least three times to obtain the variability of within-subject variability. Such a study design is rare. A furosemide AUC data set provided by Professor Leslie Benet (University of California, San Francisco) was used to investigate the variability of within-subject variability (see “METHODS” section for more detail). Though not an NTI drug, three sets of in vivo data are available for the same furosemide formulation, thus are useful for calculating the variability of WSV. Based on the simulation model (see “METHODS” section), sWT of the furosemide data set varied from 0.06 to 0.33 (Fig. 7a) with a mean value of 0.21 and standard deviation of 0.047. If we sample two observations from each subject as the T1 and T2 and two observations for each subject as the R1 and R2 (i.e., at least one observation will be used twice) and calculate the sWR, sWT, and the upper bound of the 90% CI for sWT/sWR, the passing rate is 81% using the variability comparison scheme I with δ = 2.5. The simulated distribution of sWT2/sWR2 is very close to the theoretical F8,8 distribution (Fig. 7b), suggesting that the underlying assumption for variability comparison criterion is reasonable. The authors further performed a simulation similar to Fig. 4 with n = 10 and sWR = 0.21. The passing rate was about 80% when σWT/σWR = 1 and evaluated with scheme I with δ = 2.5 (data not shown), suggesting that the variability criterion is reasonable.
Fig. 7.
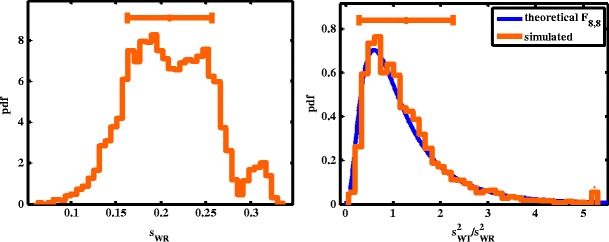
a Distribution of s WR and b comparison of the observed distribution of s 2WT/s 2WT and theoretical F 8,8 distribution
DISCUSSION
NTI drugs have small differences in dose and/or blood concentration that may lead to serious therapeutic failures or adverse drug reactions. Generally, NTI drugs have small to medium WSV. In typical nonreplicate BE studies comparing generic and reference formulations of six-sample NTI drugs, the mean CV ranges from 5.7 to 21.7% (16). Because the residual variability in a typical BE study includes both the true WSV and variations due to differences in two formulations, the actual WSV in a replicate design study would be even smaller. Health Canada and EMA recommend tighter BE limits of 90.00–111.11% for NTI drugs. When the RLD is compared to exactly the same generic product or itself, the passing rate under the tightened average BE criterion decreased significantly when the σWR increases (Fig. 2). When σWR = 0.25, the study power is less than 30% when applying BE limits of 90.00–111.11%. In contrast, the scaled average BE criterion alone (when no 80.00–125.00% capping applied) ensures a close to 100% passing rate when the RLD is compared to an identical generic product or itself at σWR = 0.25 (Fig. 2), and the BE limits will narrow with the decrease of σWR (Fig. 1). Given the range of σWR in NTI drugs (16), the fixed average BE limits of 90.00–111.00% can be too strict for truly equivalent generic drugs (i.e., GMR = 0.95–1.05) with small to medium WSV. Thus, FDA has recommended a scaled average BE criterion for BE demonstration of NTI drugs. For NTI drugs with moderate sWR, e.g., >0.21, they also need to pass conventional 80.00–125.00% BE limits, which will be discussed in the later section.
A scaled bioequivalence approach and point estimate constraint have previously been reported to demonstrate BE of highly variable drugs (1,2). In the simulations performed in this study, the additional PECs demonstrated a σWR-dependent effect on the study power (Fig. 2). The smaller the σWR, the smaller the influence of PECs on the study power since the reference-scaled limits are already tight. The higher the σWR, the more power decreasing was observed with tighter PECs. In the case of moderate σWR (e.g., between 0.2 and 0.3), additional PEC will enforce test and reference product BE limits to be closer with each other. Furthermore, simulation suggested that additional BE criterion to include 100% in the 90% CI causes a constant failure rate around 10% even when the RLD is compared to itself or an identical generic product. These simulation results suggested that inclusion of 100% in the BE limits can be too strict for equivalent generic NTI drugs; therefore, it is not recommended for demonstrating BE between generic and reference NTI drugs. In addition, simulation also showed that study power decreases with increasing sample sizes when including 100% in the 90% CI. Generic applicants would have a disincentive to study more subjects (15). Therefore, confidence intervals including 100% are not appropriate for BE demonstration of NTI drugs.
To prevent the scenario where the estimated σWR from a particular study is high and the inappropriately conducted study may pass the scaled BE criteria, passing both scaled BE limits and average BE limits of 80.00–125.00% is recommended. When σW0 = 0.10, Δ = 1.11, and sWR > 0.21, the average BE limits of 80.00–125.00% essentially control whether a study passes.
Because larger WSV of the test product than the RLD is of concern for NTI drugs, the WSV comparison becomes particularly important for generic NTI approval. While the scaled + capping BE criterion penalizes products with differences in WSV or GMR more than the average BE standards—especially at low σWR (Fig. 3)—even with σWT/σWR = 2, there is still a 70 or 80% chance a study will pass the scaled + capping limits if the geometric mean ratio is close to 1 (Fig. 3). The simulation suggested the scaled + capping BE criterion alone is insufficient to fail BE studies with large differences (e.g., σWT/σWR = 2) in reference and test WSV when the GMR is close to 1. Thus, criterion to compare test and reference variability was developed and discussed below.
To estimate both test and reference WSV, a fully replicated, 2-sequence, 2-treatment, 4-period crossover study is needed. With this BE study design, each subject receives each formulation (reference, R, and test, T) twice. Because the pharmacokinetics and the analytical variability are the same for both the test and the reference products in a fully replicated study, a significant difference in the estimated WSV between test and reference products is an indicator of a product quality problem. Three equivalence evaluation schemes were evaluated as described in the “RESULTS” section. Scheme II was not considered because it can give applicants the incentive to increase the chance of passing by underpowering a study. Scheme III is considered too relaxed because it allows products with relatively large difference in WSV to pass with greater than 80% power. As such, scheme I became the focus of further investigation.
In further evaluation of the scaled + capping BE limits and variability comparison criterion, simulations indicated that the study power was mostly determined by the power of the variability comparison for BE studies with large difference in variability when the GMR is close to 1 (Fig. 5). Scheme I with δ = 2.5 was selected as the recommended criterion for variability comparison because it could produce more than 80% power for similar products (0.95 < GMR < 1.05 and σWT/σWR < 1.2) and less than 20% power for products with larger than twofold differences in within-subject standard deviation using 24 subjects (Fig. 6).
There were concerns that it may be difficult to pass variability comparison criterion since the variability of WSV is high in actual BE studies. To investigate this concern, the authors analyzed a furosemide AUC data set (provided by Professor Leslie Benet, University of California, San Francisco). Although the distribution of sWR covered a larger than twofold range (Fig. 7a), when the RLD is compared to itself, the study power is above 80% with the variability comparison criterion, which is reasonable for a study population size much smaller than normal. Overall, the furosemide data set support that the variability comparison criterion is reasonable.
The new BE standards for NTI drugs tightens the BE limits based on the RLD’s WSV, penalizes differences between the test product WSV and reference product WSV, and ensures a consistent study power at higher than 80% when the same product is compared to itself or an identical generic product. Adaptation of this scaled BE and variability comparison approach will enhance the ability to approve quality generic NTI drugs.
As of July 2014, FDA has published two product-specific BE recommendations where the scaled BE and variability comparison criterion are recommended to be applied to demonstrate bioequivalence. The products are a warfarin sodium tablet (17) and tacrolimus capsule (12). The bioequivalence limits of NTIs are scaled based on the estimated within-subject standard deviation of the reference product (sWR) in the study. The smaller the sWR, the narrower the BE limits are for the test product. The higher the sWR, the wider the BE limits are for the test product; however, wider product variation is prevented by the demonstration that average BE is within 80.00–125.00%. In addition, variability comparison is recommended for NTI drugs. The extension of this approach to other drugs depends on a consistent method for NTI drug classification. Improper application of this approach to non-NTI drugs will result in an unnecessarily low passing rate of generic products for which normal fluctuation in plasma concentration would be well tolerated. Further work in NTI drug classification and use of scaled BE and variability comparison to other NTI drugs is ongoing.
Acknowledgments
The authors would like to acknowledge Barbara Davit, Ph.D., J.D.; Professor Kamal K. Midha, Ph.D.; and Professor Leslie Benet, Ph.D. for their valuable discussion during the method development.
Conflict of Interest
The authors declared no conflict of interest.
Author Contributions
W.J., X.Z., and N.Z. wrote the manuscript. W.J., F.M., D.J.S., X.Z., L.X.Y., D.C., and R.L. designed the research. W.J., F.M., D.J.S., N.Z., and X.Z. performed the research and analyzed the data.
Disclaimer
The views expressed in this article are those of the authors and not necessarily those of the Food and Drug Administration (FDA).
REFERENCES
- 1.Haidar SH, Davit B, Chen ML, Conner D, Lee L, Li QH, et al. Bioequivalence approaches for highly variable drugs and drug products. Pharm Res. 2008;25(1):237–41. doi: 10.1007/s11095-007-9434-x. [DOI] [PubMed] [Google Scholar]
- 2.Haidar SH, Makhlouf F, Schuirmann DJ, Hyslop T, Davit B, Conner D, et al. Evaluation of a scaling approach for the bioequivalence of highly variable drugs. AAPS J. 2008;10(3):450–4. doi: 10.1208/s12248-008-9053-4. [DOI] [PMC free article] [PubMed] [Google Scholar]
- 3.Van Peer A. Variability and impact on design of bioequivalence studies. Basic Clin Pharmacol Toxicol. 2010;106(3):146–53. doi: 10.1111/j.1742-7843.2009.00485.x. [DOI] [PubMed] [Google Scholar]
- 4.FDA. Individual product bioequivalence recommendations—warfarin sodium. Accessed in December 2013. Available at http://www.fda.gov/downloads/Drugs/GuidanceComplianceRegulatoryInformation/Guidances/UCM201283.pdf. 2012.
- 5.Health Canada. Comparative bioavailability standards: formulations used for systemic effects. Accessed in December 2013. Available at http://www.hc-sc.gc.ca/dhp-mps/alt_formats/pdf/prodpharma/applic-demande/guide-ld/bio/gd_standards_ld_normes-eng.pdf. 2012.
- 6.Japan Pharmaceutical and Food Safety Bureau. Guideline for bioequivalence studies for different strengths of oral solid dosage forms. Accessed in December 2013. Available at http://www.nihs.go.jp/drug/be-guide(e)/strength/GL-E_120229_ganryo.pdf. 2012.
- 7.FDA. Meeting of the Advisory Committee for Pharmaceutical Science and Clinical Pharmacology—briefing information. Accessed in December 2013. Available at http://www.fda.gov/downloads/AdvisoryCommittees/CommitteesMeetingMaterials/Drugs/AdvisoryCommitteeforPharmaceuticalScienceandClinicalPharmacology/UCM263465.pdf. 2010.
- 8.European Medicines Agency. Questions & answers: positions on specific questions addressed to the pharmacokinetics working party. Accessed in December 2013. Available at http://www.ema.europa.eu/docs/en_GB/document_library/Scientific_guideline/2009/09/WC500002963.pdf. 2013.
- 9.Lionberger R, Jiang W, Huang SM, Geba G. Confidence in generic drug substitution. Clin Pharmacol Ther. 2013;94(4):438–40. doi: 10.1038/clpt.2013.104. [DOI] [PubMed] [Google Scholar]
- 10.Zhang X, Zheng N, Lionberger RA, Yu LX. Innovative approaches for demonstration of bioequivalence: the US FDA perspective. Ther Deliv. 2013;4(6):725–40. doi: 10.4155/tde.13.41. [DOI] [PubMed] [Google Scholar]
- 11.Endrenyi L, Tothfalusi L. Determination of bioequivalence for drugs with narrow therapeutic index: reduction of the regulatory burden. J Pharm Pharm Sci. 2013;16(5):676–82. doi: 10.18433/j31k51. [DOI] [PubMed] [Google Scholar]
- 12.FDA. Bioequivalence recommendation on tacrolimus capsules. Accessed in December 2013. Available at http://www.fda.gov/downloads/Drugs/GuidanceComplianceRegulatoryInformation/Guidances/UCM181006.pdf. 2012.
- 13.Phillips KF. Power of the two one-sided tests procedure in bioequivalence. J Pharmacokinet Biopharm. 1990;18(2):137–44. doi: 10.1007/BF01063556. [DOI] [PubMed] [Google Scholar]
- 14.Patterson SD, Zariffa NM, Montague TH, Howland K. Non-traditional study designs to demonstrate average bioequivalence for highly variable drug products. Eur J Clin Pharmacol. 2001;57(9):663–70. doi: 10.1007/s002280100371. [DOI] [PubMed] [Google Scholar]
- 15.FDA. Approaches to demonstrate bioequivalence of narrow therapeutic index drugs. Accessed in December 2013. Available at http://www.fda.gov/downloads/AdvisoryCommittees/CommitteesMeetingMaterials/Drugs/AdvisoryCommitteeforPharmaceuticalScienceandClinicalPharmacology/UCM266777.pdf. 2011.
- 16.Yu LX. Quality and bioequivalence standards for narrow therapeutic index drugs. Accessed in December 2013. Available at http://www.fda.gov/downloads/Drugs/DevelopmentApprovalProcess/HowDrugsareDevelopedandApproved/ApprovalApplications/AbbreviatedNewDrugApplicationANDAGenerics/UCM292676.pdf 2011.
- 17.FDA. Bioequivalence recommendation on warfarin sodium tablets. Accessed in December 2013. Available at http://www.fda.gov/downloads/Drugs/GuidanceComplianceRegulatoryInformation/Guidances/UCM201283.pdf. 2012.


