

Abstract
The aim of this study was to determine the effects of single and repeated episodes of clamped hypoglycemia on fibrinolytic balance, proinflammatory biomarkers, proatherothrombotic mechanisms, and endothelial function. Twenty healthy individuals (12 male and 8 female) were studied during separate 2-day randomized protocols. Day 1 consisted of either two 2-h hyperinsulinemic (812 ± 50 pmol/L)-euglycemic (5 ± 0.1 mmol/L) or hyperinsulinemic (812 ± 50 pmol/L)-hypoglycemic (2.9 ± 0.1 mmol/L) clamps. Day 2 consisted of a single 2-h hyperinsulinemic-hypoglycemic clamp. Two-dimensional Doppler ultrasound was used to determine brachial arterial endothelial function. Plasminogen activator inhibitor 1, vascular cell adhesion molecule-1, intracellular adhesion molecule-1, E-selectin, P-selectin, TAT (thrombin/antithrombin complex), tumor necrosis factor-α, and interleukin-6 responses were increased (P < 0.05) during single or repeated hypoglycemia compared with euglycemia. Endogenous and exogenous nitric oxide (NO)-mediated vasodilation were both impaired by repeated hypoglycemia. Neuroendocrine and autonomic nervous system (ANS) responses were also blunted by repeated hypoglycemia (P < 0.05). In summary, acute moderate hypoglycemia impairs fibrinolytic balance; increases proinflammatory responses, platelet activation, and coagulation biomarkers; and reduces NO-mediated endothelial function in healthy individuals. Repeated episodes of hypoglycemia further impair vascular function by additionally reducing exogenously NO-mediated endothelial function and increasing coagulation biomarkers. We conclude that despite reduced neuroendocrine and ANS responses, antecedent hypoglycemia results in greater endothelial dysfunction and an increased proatherothrombotic state compared with a single acute episode of hypoglycemia.
Introduction
Data are accumulating that hypoglycemia is associated with increased cardiovascular and cerebrovascular mortality (1,2). Epidemiologic data as well as studies in ambulatory practice and intensive care settings have demonstrated increased risk of serious cardiovascular adverse events after severe hypoglycemia (3–5). Several recent large randomized controlled trials have demonstrated that with both intensive and standard treatment of patients with type 2 diabetes, the patients can suffer episodes of severe hypoglycemia (5–7). These episodes were associated with serious cardiovascular adverse events and, in some trials, increased mortality (5,8). Somewhat surprisingly, individuals with higher HbA1c in both standard and intensive treatment arms appeared to have worse cardiovascular outcomes after severe hypoglycemia (5–7). The possible mechanisms for these findings remain unexplained. Type 2 diabetes is a syndrome typically associated with increased cardiovascular risk (endothelial dysfunction, abnormal fibrinolytic balance, increased inflammation, premature atherothrombotic risks, and vascular disease). It is unclear whether episodes of hypoglycemia may also contribute to the syndrome of premature and diffuse vascular disease (9,10). Recent work has started to investigate the effects of acute hypoglycemia on proinflammatory and proatherothrombotic mechanisms in both healthy and diabetic humans (9–12). Available data are consistent, demonstrating that acute insulin-induced hypoglycemia can activate proinflammatory responses (12,13).
However, lacking are data reporting the effects of repeated hypoglycemia on proinflammatory and proatherothrombotic markers. Similarly, the effects of antecedent hypoglycemia on endothelial function are largely unknown. Therefore, in this present study, we have tested the hypothesis that acute or antecedent moderate hypoglycemia can 1) impair endothelial function, 2) activate proinflammatory and proatherothrombotic mechanisms, and 3) reduce fibrinolytic balance in healthy individuals.
To control for the independent effects of insulin on proinflammatory responses and endothelial function (2), the hyperinsulinemic-euglycemic and hyperinsulinemic-hypoglycemic clamp techniques were used to equate insulin levels in all studies. With use of this approach, the independent effects of acute and repeated hypoglycemia on in vivo vascular physiology could be identified.
Research Design and Methods
Study Participants
Twenty adult volunteers (12 male and 8 female), age 34 ± 3 years, BMI 27 ± 1 kg/m2, and HbA1c 5 ± 0.3% and 31 ± 3.3 mmol/mol, participated in two randomized, single-blind 2-day experiments. Twelve individuals participated in both protocols, and an additional eight individuals underwent a single 2-day visit, resulting in n = 16 for both 2-day studies. None of the subjects smoked or received anticoagulants, clopidogrel, or statins. Subjects over age 40 years were screened for silent ischemia with a standard treadmill stress test. Each subject had a normal blood count, plasma electrolytes, and liver and renal function and no evidence of either impaired fasting glucose or overt diabetes. All gave written informed consent. Studies were approved by the Vanderbilt University Human Subjects Institutional Review Board.
Participants were instructed to avoid any alcohol and exercise and consume their usual weight-maintaining diet for 3 days before each experiment. Patients were also asked not to use aspirin, nonsteroidal anti-inflammatory drugs, or cyclooxygenase 2 inhibitors for 3 days prior to a study. Subjects were admitted to the general clinical research center the night prior to the study. After an overnight 10-h fast, two intravenous cannulae were inserted under 1% lidocaine local anesthesia. One cannula was placed in a retrograde fashion into a vein on the back of the hand of the nondominant arm. This hand was placed in a heated box (55–60°C) during the study so that arterialized blood could be obtained (14). The other cannula was placed in the ipsilateral arm for infusions. Subjects were randomized to undergo the following 2-day protocols (Fig. 1).
Figure 1.
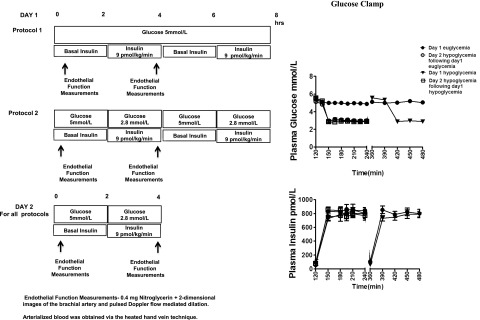
Experimental protocols, clamped glucose, and insulin levels during hyperinsulinemic-euglycemic and hyperinsulinemic-hypoglycemic clamps in healthy subjects. Values are mean ± SE. Endothelial function measurements: 0.4 mg nitroglycerin plus two-dimensional images of the brachial artery and pulsed Doppler flow-mediated dilation. Arterialized blood was obtained via the heated hand vein technique. hrs, hours.
Protocol 1
Day 1
After placement of venous cannulae, a period of 120 min was allowed to elapse followed by a 120-min hyperinsulinemic-euglycemic experimental period. At time 120 min, a primed constant (9.0 pmol/kg/min) infusion of insulin (Human Regular Insulin; Eli Lilly, Indianapolis, IN) was started and continued until 240 min. During this period, plasma glucose was measured every 5 min and a 20% dextrose infusion was adjusted so that plasma glucose levels were held constant at 5.0 ± 0.1 mmol/L (15). Potassium chloride (20 mmol/L) was infused to reduce insulin-induced hypokalemia. At time 240 min, the insulin infusion was turned off and a further 120 min was allowed to elapse before starting an identical 120-min afternoon euglycemic clamp. After day 1 procedures, participants received a standard meal and evening snack and underwent a 10-h overnight fast.
Day 2
Day 2 consisted of an initial 120-min resting period. At time 120 min, a primed constant (9.0 pmol/kg/min) infusion of regular insulin was started and continued until 240 min. The rate of fall of glucose was controlled (∼0.08 mmol/min), and the glucose nadir (2.9 mmol/L) was achieved using a modification of the glucose clamp technique (15,16). Potassium chloride (20 mmol/L) was infused during the clamp. At time 240 min, insulin was turned off, plasma glucose was restored to euglycemia, and participants were given a meal.
Protocol 2
Day 1
After placement of venous cannulae, a period of 120 min was allowed to elapse, followed by a 120-min hyperinsulinemic-hypoglycemic experimental period similar to that described for day 2 of protocol 1. After the morning clamp experiment, a 120-min euglycemic period was established by infusing 20% dextrose. After that, a second 120-min hyperinsulinemic-hypoglycemic clamp period similar to the morning study was performed. At completion of day 1 procedures, participants received a standard meal and an evening snack.
Day 2
After a 10-h overnight fast, day 2 morning procedures were identical to the hyperinsulinemic-hypoglycemic clamp studies performed during protocol 1, day 2.
Analytical Methods
The collection of blood samples has previously been described (17). Plasma glucose concentrations were measured in triplicate using the glucose oxidase method with a glucose analyzer (Beckman, Fullerton, CA). Insulin, catecholamines, cortisol, and nonesterified fatty acids (NEFAs) were drawn every 30 min. Insulin was measured as previously described with an interassay coefficient of variation (CV) of 9% (18). Catecholamines were determined by high-performance liquid chromatography with an interassay CV of 12% for epinephrine and 8% for norepinephrine (19). Cortisol was assayed using the Clinical Assays Gammacoat radioimmunoassay kit with an interassay CV of 6%. NEFA were measured using the WAKO kit with an interassay CV of 7% (20).
During the experimental period, blood for soluble vascular adhesion molecule (VCAM)-1, soluble intracellular adhesion molecule (ICAM)-1, E-selectin, P-selectin, interleukin (IL)-6, tumor necrosis factor (TNF)-α, plasminogen activator inhibitor (PAI)-1, and thrombin/antithrombin (TAT) complex was drawn every 60 min. VCAMs and adiponectin were assayed using LINCO Research kits (St. Charles, MO) with an interassay CV of 8.5% (soluble VCAM-1), CV of 9.7% (soluble ICAM-1), CV of 13.4%, (soluble E-selectin), CV of 9.02% (IL-6), and CV of 9.98% (TNF-α), respectively (21). P-selectin was measured by Meso Scale Discovery assays (Gaithersburg, MD) with a CV of 9.9%. PAI-1 was determined by TintElize PAI-1 kit with interassay CV of 3.3% and TAT Complex, CV of 7%, with Assay Pro (St. Charles, MO).
Cardiovascular Measurements
Heart rate and systolic, diastolic, and mean arterial blood pressure were measured noninvasively by a Dinamap vitals monitor (Critikon, Tampa, FL) every 10 min throughout each 2-h clamp study.
Endothelial Function
Measurements of endothelial function were conducted at baseline and during the final 30 min of each glucose clamp. Flow-mediated dilation of the dominant brachial artery was measured using two-dimensional Doppler ultrasound during reactive hyperemia and exogenous nitroglycerin administration. Baseline images of the brachial artery were obtained during systole by scanning the artery in longitudinal section 5–10 cm above the antecubital fossa of the dominant arm with the focal zone set to the depth of the mid-vessel. Boundaries for diameter measurements were identified manually with electronic calipers. Reactive hyperemia was obtained by inflating the blood pressure cuff around the proximal forearm to a pressure of 50 mmHg greater than the individual’s systolic blood pressure for 5 min (22). Brachial artery diameter measurements were taken at time points 30 s, 60 s, 90 s, and 120 s and after cuff deflation. After a 15-min rest period, subjects received 0.4 mg sublingual nitroglycerin (as an exogenous nitric oxide [NO] donor). Additional scans were performed as above with vessel diameter measurements obtained at 1, 2, 3, and 4 min (22).
Statistical Analysis
Data are expressed as mean ± SE and were analyzed using standard, parametric, and one- and two-way ANOVA and with repeated measures where appropriate (GraphPad Software, Inc., San Diego, CA). Tukey post hoc analysis was used to delineate statistical significance within each group. Data were also analyzed using paired and unpaired two-tailed t tests. In all cases, a P value of <0.05 was accepted as statistically significant.
Results
Glucose and Insulin
Plasma glucose was maintained equivalently (5 ± 0.1 mmol/L) during the euglycemic clamps. During the hypoglycemic studies, glucose reached a steady state by 150 min and equivalent hypoglycemia was maintained (2.9 ± 0.1 mmol/L) during all hypoglycemic clamp procedures (Fig. 1). Insulin levels (812 ± 50 pmol/L) were similar during all clamp studies (Fig. 1).
Neuroendocrine Counterregulatory Hormones
Epinephrine responses were significantly higher (P < 0.001) during the final 30 min of day 1 hypoglycemia (3,741 ± 465 pmol/L) and day 2 hypoglycemia after day 1 euglycemia (4,251 ± 568 pmol/L) compared with euglycemia (189 ± 20 pmol/L) or day 2 repeated hypoglycemia (2,497 ± 265 pmol/L). Norepinephrine levels were also similar during all hypoglycemia protocols but significantly higher (P < 0.001) compared with euglycemia (1,984 ± 156 vs. 1,159 ± 77 pmol/L, respectively) (Table 1). Glucagon, cortisol, and growth hormone levels were all reduced (P < 0.05) during day 2 hypoglycemia after day 1 hypoglycemia (Table 1).
Table 1.
Neuroendocrine responses and NEFA responses during euglycemic and hypoglycemic clamps
| Day 1 euglycemia |
Day 2 hypoglycemia
after day 1 euglycemia |
Day 1 hypoglycemia |
Day 2 hypoglycemia
after day 1 hypoglycemia |
|||||
|---|---|---|---|---|---|---|---|---|
| Basal | Final | Basal | Final | Basal | Final | Basal | Final | |
| Epinephrine (pmol/L) | 190 ± 20 | 189 ± 20 | 179 ± 20 | 4,251 ± 568*† | 184 ± 40 | 3,741 ± 465*† | 198 ± 30 | 2,497 ± 265*†‡ |
| Norepinephrine (pmol/L) | 1,083 ± 80 | 1,159 ± 77 | 1,128 ± 124 | 1,957 ± 134* | 1,057 ± 119 | 1,966 ± 149* | 1,161 ± 124 | 2,028 ± 184* |
| Cortisol (nmol/L) | 344 ± 31 | 292 ± 30 | 330 ± 32 | 714 ± 42*† | 359 ± 34 | 850 ± 70*† | 271 ± 26 | 572 ± 62*†‡ |
| Glucagon (ng/L) | 65 ± 5 | 43 ± 3* | 50 ± 6 | 112 ± 17*† | 57 ± 4 | 164 ± 26*† | 44 ± 7 | 90 ± 13*†‡ |
| GH (ng/mL) | 2.5 ± 0.4 | 2.4 ± 0.4 | 4 ± 1.34 | 25 ± 5*† | 3.1 ± 0.5 | 28 ± 5* | 2.2 ± 0.2 | 20 ± 3*† |
| NEFA (mmol/L) | 379 ± 48 | 103 ± 40* | 382 ± 55 | 97 ± 14* | 288 ± 32 | 110 ± 19* | 351 ± 28 | 98 ± 23* |
Data are means ± SE. GH, growth hormone.
*P < 0.05, significantly different from baseline.
†P < 0.05, significantly different from day 1 euglycemia.
‡P < 0.05, significantly different from day 1 hypoglycemia.
Intermediary Metabolism
NEFA baseline levels were similar at the start of glucose clamps. Plasma NEFA levels fell similarly (P < 0.0001) during hypoglycemic and euglycemic clamps (Table 1).
Atherogenic VCAMs
Baseline values of ICAM-1, VCAM-1, and E-selectin were similar (Table 2) and fell (P < 0.05) during the hyperinsulinemic-euglycemic clamps (Figs. 2 and 3). End of clamp responses during all hypoglycemic protocols were similarly increased (P < 0.05) compared with euglycemia (Figs. 2 and 3). Conceptually similar statistical differences were obtained when responses from the entire time course of the 2-h clamp studies (Figs. 2 and 3) and incremental changes from baseline were evaluated.
Table 2.
Proinflammatory and proatherothrombotic markers at baseline
| Day 1 euglycemia | Day 2 hypoglycemia after day 1 euglycemia | Day 1 hypoglycemia | Day 2 hypoglycemia after day 1 hypoglycemia | |
|---|---|---|---|---|
| ICAM (ng/mL) | 90 ± 7 | 89 ± 7 | 88 ± 3 | 78 ± 5 |
| VCAM (ng/mL) | 838 ± 37 | 772 ± 43 | 819 ± 62 | 735 ± 48 |
| E-selectin (ng/mL) | 22 ± 2 | 18 ± 2 | 21 ± 2 | 16 ± 2 |
| P-selectin (pg/mL) | 83 ± 9 | 56 ± 6* | 63 ± 13 | 45 ± 9* |
| PAI-1 (ng/mL) | 18 ± 3 | 14 ± 2 | 13 ± 3 | 17 ± 6 |
| TAT (ng/mL) | 3.5 ± 0.4 | 2.9 ± 0.3 | 3.5 ± 0.2 | 3.6 ± 0.2 |
| tPA (ng/mL) | 6.1 ± 1 | 5.9 ± 1 | 5 ± 1 | 4.2 ± 1 |
Data are means ± SE.
*P < 0.05, significantly different from day 1 euglycemia at baseline.
Figure 2.

Effects of hyperinsulinemic euglycemia (5.1 mmol/L) and hypoglycemia (2.9 mmol/L) in overnight-fasted healthy subjects on vascular biologic markers. Response of VCAM-1, ICAM-1, E-selectin, IL-6, PAI-1, P-selectin, and TAT is increased during all hypoglycemia protocols compared with euglycemia. Values are mean ± SE. *P < 0.05, significantly different from day 1 euglycemia.
Figure 3.

Effects of hyperinsulinemic euglycemia (5.1 mmol/L) and hypoglycemia (2.9 mmol/L) in overnight-fasted healthy subjects on vascular biologic markers. Response of VCAM-1, ICAM-1, E-selectin, IL-6, PAI-1, P-selectin, and TAT is increased during all hypoglycemia protocols compared with euglycemia. Values are mean ± SE. *P < 0.05, significantly different from day 1 euglycemia. †P < 0.05, significantly different from day 2 hypoglycemia after day 1 euglycemia. ‡P < 0.05, significantly different from day 2 hypoglycemia after day 1 hypoglycemia.
Platelet Activation and Fibrinolytic/Thrombotic Balance
Baseline values for PAI-1, TAT, and tissue plasminogen activator (tPA) were similar for all protocols (Table 2). Basal day 2 hypoglycemia P-selectin values were lower (P < 0.05) after day 1 hyperinsulinemia. PAI-1, P-selectin, and TAT end-of-clamp responses were increased (P < 0.05) during all hypoglycemic studies compared with euglycemic clamp studies (Figs. 2 and 3). Incremental responses from baseline for the entire time course during hypoglycemia for PAI-1, TAT, and P-selectin were also increased compared with euglycemia (Fig. 3). Plasma tPA values remained similar to baseline during euglycemic and hypoglycemic studies.
Inflammatory Cytokines
Baseline values for IL-6 and TNF-α were similar at the start of all protocols of glucose clamp studies (Table 2). End of clamp responses were increased (P < 0.05) during all hypoglycemic protocols compared with euglycemia (Figs. 2 and 3).
Cardiovascular Parameters
Heart rate and systolic, diastolic, and mean arterial blood pressure responses are shown in Table 3.
Table 3.
Cardiovascular responses during hyperinsulinemic-euglycemic and hyperinsulinemic-hypoglycemic clamps
| Basal | Final | |
|---|---|---|
| Systolic blood pressure (mmHg) | ||
| Day 1 eugly | 110 ± 3 | 110 ± 3 |
| Day 2 hypo after day 1 eugly | 109 ± 3 | 116 ± 4 |
| Day 1 hypo | 112 ± 4 | 121 ± 7† |
| Day 2 hypo after day 1 hypo | 113 ± 4 | 123 ± 5†‡ |
| Diastolic blood pressure (mmHg) | ||
| Day 1 eugly | 63 ± 2 | 62 ± 2 |
| Day 2 hypo after day 1 eugly | 65 ± 1 | 60 ± 2† |
| Day 1 hypo | 65 ± 2 | 62 ± 3 |
| Day 2 hypo after day 1 hypo | 66 ± 1 | 62 ± 2† |
| Mean arterial pressure (mmHg) | ||
| Day 1 eugly | 79 ± 2 | 76 ± 3 |
| Day 2 hypo after day 1 eugly | 80 ± 2 | 80 ± 2 |
| Day 1 hypo | 81 ± 3 | 82 ± 4 |
| Day 2 hypo after day 1 hypo | 81 ± 2 | 83 ± 3 |
| Heart rate (bpm) | ||
| Day 1 eugly | 64 ± 3 | 67 ± 2 |
| Day 2 hypo after day 1 eugly | 65 ± 3 | 74 ± 2†‡ |
| Day 1 hypo | 66 ± 3 | 70 ± 3 |
| Day 2 hypo after day 1 hypo | 68 ± 3 | 75 ± 2†‡ |
Data are means ± SE. eugly, euglycemia; hypo, hypoglycemia.
†P < 0.05 compared with baseline.
‡P < 0.05 compared with final euglycemia.
Endothelial Function
Endothelial function during endogenous NO stimulation was decreased (P < 0.05) during day 1 and both day 2 hypoglycemia protocols compared with day 1 euglycemia (Fig. 4). Endogenous NO-mediated endothelial function was also reduced (P < 0.05) by repeated hypoglycemia compared with day 2 hypoglycemia after day 1 euglycemia. There were also reductions (P < 0.05) in endothelial function during exogenous NO stimulation during repeated hypoglycemia compared with day 1 euglycemia and day 1 hypoglycemia (Fig. 4).
Figure 4.

Endogenously and exogenously (NO) flow-mediated dilation during acute and repeated hyperinsulinemic/hypoglycemic protocols compared with hyperinsulinemic euglycemia in overnight-fasted healthy individuals. Bsl, baseline; EC, end of clamp; Max, maximum. *P < 0.01, significantly different from day 1 euglycemia. #P < 0.01, significantly different from day 2 hypoglycemia after day 1 euglycemia. ≠P < 0.04, significantly different from day 1 hypoglycemia. **P < 0.01, significantly different from baseline. §P < 0.001, significantly different from day 1 euglycemic end of clamp.
Discussion
This study has investigated the effects of clamped hyperinsulinemic euglycemia and acute and repeated 2-h episodes of moderate hyperinsulinemic hypoglycemia (2.9 mmol/L) on endothelial function, fibrinolytic balance, and proinflammatory and proatherothrombotic mechanisms in healthy man. Our results demonstrate that acute hypoglycemia reduces endogenous NO-mediated endothelial vasodilation, activates inflammatory processes, impairs fibrinolytic balance, and increases proatherothrombotic mechanisms. Secondly, repeated episodes of hypoglycemia can further impair vascular function by additionally reducing both endogenous and exogenous NO-mediated endothelial function and increasing TAT complex formation.
Recent large randomized controlled trials investigating the effects of intensifying glucose control both in hospitals and in outpatient settings have demonstrated an association with hypoglycemia and severe cardiovascular outcomes and even death (5,8). The in vivo vascular pathophysiologic mechanisms responsible for these findings are poorly understood. Additionally, the mechanistic role played by repeated hypoglycemia in these adverse events is largely unknown. In fact, it is argued that as counterregulatory responses during repeated hypoglycemia are blunted that antecedent hypoglycemia may have a reduced role in the pathophysiology of the adverse events in the above studies.
In this study, glucose clamp techniques were used to allow assessment of the effects of euglycemia and repeated hypoglycemia on in vivo endothelial function and proatherothrombotic and proinflammatory responses during equivalent insulinemia. This latter point is an important element of the study design, as hyperinsulinemia, per se, can acutely improve endothelial function and reduce proinflammatory responses (23,24).
The results of the current study clearly demonstrate that despite reduced neuroendocrine and autonomic nervous system counterregulatory responses, repeated hypoglycemia produces a greater aggregate of deleterious in vivo vascular biologic effects compared with a single similar hypoglycemic episode.
Relatively few studies have investigated the effects of acute hypoglycemia on proinflammatory and proatherothrombotic mechanisms (10,12,24,25). In this present study, we confirm and extend previous findings that 2 h of acute moderate hypoglycemia can activate proinflammatory (ICAM-1, VCAM-1, E-selectin, TNF-α, and IL-6) and prothrombotic (PAI-1, P-selectin, and TAT complex) mechanisms. The increased TAT complexes (increased intravascular coagulation), elevated P-selectin (increased platelet aggregability), and increased PAI-1 relative to tPA (disordered fibrinolytic balance) responses demonstrate a broad activation of prohemostatic clotting mechanisms by hypoglycemia.
Supporting previous studies, our results demonstrate that hyperinsulinemic euglycemia can acutely lower proinflammatory and proatherothrombotic responses (10,12,25). These data demonstrate that insulin per se can reduce inflammation acutely. However, despite the beneficial effects of insulin, our results demonstrate that two episodes of hyperinsulinemic euglycemia on day 1 had only limited effects on preventing the deleterious proinflammatory vascular action of next day hyperinsulinemic hypoglycemia.
The time course of the increases in inflammatory biomarkers is worth noting. Adhesion molecules (ICAM-1, VCAM-1, and E-selectin), prothrombotic markers (P-selectin, PAI-1, and TAT complex), and proinflammatory markers (TNF-α and IL-6) increased during the 2-h hyperinsulinemic-hypoglycemic clamps. All of the above marker responses were elevated relative to the reductions observed during hyperinsulinemic-euglycemic control studies (Figs. 2 and 3). Whether extended periods or deeper levels of hypoglycemia would further increase prothrombotic and proinflammatory biomarkers is unknown.
Endothelial dysfunction is a key feature of macrovascular complications in both type 1 and type 2 diabetes. Flow-mediated dilation is a well-validated assessment of impaired endothelial function (26). Using this technique, numerous studies have determined the association of impaired endothelial function with increased risk for atherosclerosis and coronary artery disease (26). However, there are few data describing the effects of hypoglycemia on the vascular endothelium (25,27,28) and none directly measuring endothelial function during repeated hypoglycemia.
Acute endothelial function was assessed by both exogenously and endogenously NO-mediated vasodilatory mechanisms. Any episode of hypoglycemia significantly impaired endogenous NO-mediated endothelial function. However, repeated hypoglycemia blunted both endogenous and nonendogenous NO-mediated vasodilation and resulted in greater endothelial dysfunction compared with a single episode of hypoglycemia. This finding is notable for several reasons. Firstly, it appears that repeated hypoglycemia is the only physiologic stress that impairs both endogenous and exogenous NO-mediated vasodilation (29). Secondly, this demonstrates that repeated acute episodes of hypoglycemia can result in greater endothelial dysfunction compared with a single episode of hypoglycemia. Thirdly, these present results indicate that repeated hypoglycemia can impair NO-mediated vascular smooth muscle function (endogenous) as well as exogenously mediated inputs into vasculature (e.g., autonomic nervous system) (30).
Antecedent episodes of hypoglycemia typically blunt the majority of neuroendocrine and autonomic nervous system responses during subsequent hypoglycemia in nondiabetic individuals and individuals with type 1 or type 2 diabetes (31). Consistent with prior findings, day 2 epinephrine, cortisol, glucagon, and growth hormone responses were also reduced in these present studies by day 1 antecedent hypoglycemia. Despite this, proinflammatory and particularly proatherothrombotic mediators were not reduced during day 2 of repeated hypoglycemia. In fact, responses of P-selectin (marker of platelet aggregation), PAI-1 (marker of reduced fibrinolytic balance), and TAT complexes (marker of thrombin activity) were either similarly or preferentially increased by repeated hypoglycemia. Thus, our present findings demonstrate that three episodes of hypoglycemia have greater physiologic effects on endothelial function and proatherothrombotic markers compared with a single episode of comparable hypoglycemia.
The possible physiologic mechanisms responsible for the above findings deserve further discussion. Our present results strongly indicate that acute hyperinsulinemia per se does not have acute proinflammatory or deleterious effects on the vasculature (23,24). The hyperinsulinemic-euglycemic control studies improved acute vascular function and provided anti-inflammatory benefit. Rana et al. (32) also have demonstrated that insulin-induced hypoglycemia reduces myocardial blood flow, whereas hyperinsulinemic euglycemia has a beneficial effect on myocardial blood flow in healthy individuals and individuals with type 1 diabetes. However, it should be noted that the insulin levels achieved during the short duration of the present studies (euglycemic and hypoglycemic) are considerably higher than those chronically and typically observed in clinical practice.
Despite the beneficial acute anti-inflammatory effects of insulin, day 1 euglycemia appeared to have little effect on reducing endothelial dysfunction or proinflammatory and proatherogenic responses during next-day hypoglycemia, underscoring the powerful putative effects of repeated hypoglycemia on the vasculature. The only demonstrable beneficial effects of day 1 insulinemia (after either euglycemic or hypoglycemic studies) were that basal P-selectin levels were reduced at the start of day 2 hypoglycemia studies.
NEFA levels were similarly reduced during euglycemic and hypoglycemic clamp studies. Thus, it appears unlikely that NEFA levels could have been responsible for the proinflammatory and impaired endothelial function occurring during hypoglycemia (33).
This would indicate that either hypoglycemia per se or a consequence of hypoglycemia is the putative agent for vascular dysfunction and inflammation. Previous work has elegantly demonstrated that activation of α- or β-receptors can reduce endogenously NO-mediated smooth muscle vasodilation. The effects of catecholamines and direct sympathetic nervous system drive on proinflammatory, fibrinolytic balance, and proatherothrombotic markers are complex, with reports of both activation and reduction of inflammatory responses (34–36). These effects may be tissue specific (e.g., platelet vs. adipocyte) and may also depend on the circulating neuroendocrine milieu (i.e., interactions with corticosteroids) (37). Thus, the combination of the hypoglycemia-driven increases in epinephrine, norepinephrine, or direct sympathetic nervous system activity may have played a role in our findings (31).
In this study, antecedent hypoglycemia blunted corticosteroid responses during day 2 hypoglycemia. Thus, it is possible that the reduced levels of corticosteroids may also have contributed to the relatively increased proinflammatory and endothelial dysfunction occurring during repeated hypoglycemia (38). Additionally, previous work by Wang et al. (29) has also demonstrated direct inflammatory and adverse effects of hypoglycemia per se on in vitro vascular smooth muscle endothelial function. Lastly, we also cannot exclude that increases in endothelin-1 may also have played a role in the proinflammatory responses and impaired endothelial function observed during acute and repeated hypoglycemia (25,27).
In summary, this present study has demonstrated the complex, deleterious vascular biologic effects of acute and antecedent moderate hypoglycemia on endothelial function, fibrinolytic/thrombotic balance, and proinflammatory mechanisms in healthy individuals. We conclude that in healthy individuals, acute moderate hypoglycemia can activate proinflammatory and prothrombotic mechanisms and secondly, antecedent hypoglycemia can result in greater prothrombotic responses and impaired endothelial function compared with a single episode of acute moderate hypoglycemia.
Article Information
Acknowledgments. The authors thank Wanda Snead, Eric Allen, and the Vanderbilt Hormone Assay Core laboratory for their excellent technical assistance. The authors also thank the nursing staff of the Vanderbilt Clinical Research Center for excellent care.
Funding. This work was supported by grant P50-HL-081009 from the National Institutes of Health (NIH) and the National Heart, Lung, and Blood Institute (NHLBI); grant R01-DK-069803 from NIH and the National Institute of Diabetes and Digestive and Kidney Diseases (NIDDK); grant P01-HL-056693 from NIH/NHLBI; a Vanderbilt Diabetes Research and Training grant from NIH/NIDDK, and Vanderbilt General Clinical Research Center funding from NIH and the National Center for Research Resources.
Duality of Interest. The authors thank Takeda Pharmaceuticals for a fellowship award to N.G.J. No other potential conflicts of interest relevant to this article were reported.
Author Contributions. N.G.J. performed studies, researched data, and wrote the manuscript. D.B.T. and L.M.Y. helped perform studies, researched data, and reviewed and edited the manuscript. S.N.D. devised the study, reviewed and edited data, and wrote the manuscript. S.N.D. is the guarantor of this work and, as such, had full access to all the data in the study and takes responsibility for the integrity of the data and the accuracy of the data analysis.
Prior Presentation. Parts of this study were presented in abstract form at the 69th Scientific Sessions of the American Diabetes Association, New Orleans, LA, 5–9 June 2009.
Footnotes
Clinical trial reg. no. NCT00574340, clinicaltrials.gov.
See accompanying article, p. 2322.
References
- 1.Desouza C, Salazar H, Cheong B, Murgo J, Fonseca V. Association of hypoglycemia and cardiac ischemia: a study based on continuous monitoring. Diabetes Care 2003;26:1485–1489 [DOI] [PubMed] [Google Scholar]
- 2.Wright RJ, Frier BM. Vascular disease and diabetes: is hypoglycaemia an aggravating factor? Diabetes Metab Res Rev 2008;24:353–363 [DOI] [PubMed] [Google Scholar]
- 3.Finfer S, Chittock DR, Su SY, et al.; NICE-SUGAR Study Investigators . Intensive versus conventional glucose control in critically ill patients. N Engl J Med 2009;360:1283–1297 [DOI] [PubMed] [Google Scholar]
- 4.Egi M, Bellomo R, Stachowski E, et al. Hypoglycemia and outcome in critically ill patients. Mayo Clin Proc 2010;85:217–224 [DOI] [PMC free article] [PubMed] [Google Scholar]
- 5.Gerstein HC, Miller ME, Byington RP, et al.; Action to Control Cardiovascular Risk in Diabetes Study Group . Effects of intensive glucose lowering in type 2 diabetes. N Engl J Med 2008;358:2545–2559 [DOI] [PMC free article] [PubMed] [Google Scholar]
- 6.Duckworth W, Abraira C, Moritz T, et al.; VADT Investigators . Glucose control and vascular complications in veterans with type 2 diabetes. N Engl J Med 2009;360:129–139 [DOI] [PubMed] [Google Scholar]
- 7.Patel A, MacMahon S, Chalmers J, et al.; ADVANCE Collaborative Group . Intensive blood glucose control and vascular outcomes in patients with type 2 diabetes. N Engl J Med 2008;358:2560–2572 [DOI] [PubMed] [Google Scholar]
- 8.Wei M, Gibbons LW, Mitchell TL, Kampert JB, Stern MP, Blair SN. Low fasting plasma glucose level as a predictor of cardiovascular disease and all-cause mortality. Circulation 2000;101:2047–2052 [DOI] [PubMed] [Google Scholar]
- 9.Dandona P, Chaudhuri A, Dhindsa S. Proinflammatory and prothrombotic effects of hypoglycemia. Diabetes Care 2010;33:1686–1687 [DOI] [PMC free article] [PubMed] [Google Scholar]
- 10.Dandona P, Chaudhuri A, Ghanim H, Mohanty P. Effect of hyperglycemia and insulin in acute coronary syndromes. Am J Cardiol 2007;99:12H–18H [DOI] [PubMed] [Google Scholar]
- 11.Wright RJ, Newby DE, Stirling D, Ludlam CA, Macdonald IA, Frier BM. Effects of acute insulin-induced hypoglycemia on indices of inflammation: putative mechanism for aggravating vascular disease in diabetes. Diabetes Care 2010;33:1591–1597 [DOI] [PMC free article] [PubMed] [Google Scholar]
- 12.Gogitidze Joy N, Hedrington MS, Briscoe VJ, Tate DB, Ertl AC, Davis SN. Effects of acute hypoglycemia on inflammatory and pro-atherothrombotic biomarkers in individuals with type 1 diabetes and healthy individuals. Diabetes Care 2010;33:1529–1535 [DOI] [PMC free article] [PubMed] [Google Scholar]
- 13.Razavi Nematollahi L, Kitabchi AE, Stentz FB, et al. Proinflammatory cytokines in response to insulin-induced hypoglycemic stress in healthy subjects. Metabolism 2009;58:443–448 [DOI] [PubMed] [Google Scholar]
- 14.Abumrad NN, Rabin D, Diamond MP, Lacy WW. Use of a heated superficial hand vein as an alternative site for the measurement of amino acid concentrations and for the study of glucose and alanine kinetics in man. Metabolism 1981;30:936–940 [DOI] [PubMed] [Google Scholar]
- 15.DeFronzo RA, Tobin JD, Andres R. Glucose clamp technique: a method for quantifying insulin secretion and resistance. Am J Physiol 1979;237:E214–E223 [DOI] [PubMed] [Google Scholar]
- 16.Amiel SA, Tamborlane WV, Simonson DC, Sherwin RS. Defective glucose counterregulation after strict glycemic control of insulin-dependent diabetes mellitus. N Engl J Med 1987;316:1376–1383 [DOI] [PubMed] [Google Scholar]
- 17.Briscoe VJ, Ertl AC, Tate DB, Dawling S, Davis SN. Effects of a selective serotonin reuptake inhibitor, fluoxetine, on counterregulatory responses to hypoglycemia in healthy individuals. Diabetes 2008;57:2453–2460 [DOI] [PMC free article] [PubMed] [Google Scholar]
- 18.Wide L, Porath J. Radioimmunoassay of proteins with the uses of sephadex-coupled antibodies. Biochim Biophys Acta 1966;130:257–260 [Google Scholar]
- 19.Causon RC, Carruthers ME, Rodnight R. Assay of plasma catecholamines by liquid chromatography with electrochemical detection. Anal Biochem 1981;116:223–226 [DOI] [PubMed] [Google Scholar]
- 20.Ho RJ. Radiochemical assay of long-chain fatty acids using 63Ni as tracer. Anal Biochem 1970;36:105–113 [DOI] [PubMed] [Google Scholar]
- 21.Sigurdardottir G, Ekman AK, Ståhle M, Bivik C, Enerbäck C. Systemic treatment and narrowband ultraviolet B differentially affect cardiovascular risk markers in psoriasis. J Am Acad Dermatol 2014;70:1067–1075 [DOI] [PubMed] [Google Scholar]
- 22.Faulx MD, Wright AT, Hoit BD. Detection of endothelial dysfunction with brachial artery ultrasound scanning. Am Heart J 2003;145:943–951 [DOI] [PubMed] [Google Scholar]
- 23.Chaudhuri A, Dandona P, Fonseca V. Cardiovascular benefits of exogenous insulin. J Clin Endocrinol Metab 2012;97:3079–3091 [DOI] [PubMed] [Google Scholar]
- 24.Dandona P, Chaudhuri A, Ghanim H. Acute myocardial infarction, hyperglycemia, and insulin. J Am Coll Cardiol 2009;53:1437–1439 [DOI] [PubMed] [Google Scholar]
- 25.Ceriello A, Novials A, Ortega E, et al. Evidence that hyperglycemia after recovery from hypoglycemia worsens endothelial function and increases oxidative stress and inflammation in healthy control subjects and subjects with type 1 diabetes. Diabetes 2012;61:2993–2997 [DOI] [PMC free article] [PubMed] [Google Scholar]
- 26.Poredos P, Jezovnik MK. Testing endothelial function and its clinical relevance. J Atheroscler Thromb 2013;20:1–8 [DOI] [PubMed] [Google Scholar]
- 27.Giménez M, Gilabert R, Monteagudo J, et al. Repeated episodes of hypoglycemia as a potential aggravating factor for preclinical atherosclerosis in subjects with type 1 diabetes. Diabetes Care 2011;34:198–203 [DOI] [PMC free article] [PubMed] [Google Scholar]
- 28.Babar GS, Zidan H, Widlansky ME, et al. Impaired endothelial function in preadolescent children with type 1 diabetes. Diabetes Care 2011;34:681–685 [DOI] [PMC free article] [PubMed] [Google Scholar]
- 29.Wang J, Alexanian A, Ying R, et al. Acute exposure to low glucose rapidly induces endothelial dysfunction and mitochondrial oxidative stress: role for AMP kinase. Arterioscler Thromb Vasc Biol 2012;32:712–720 [DOI] [PMC free article] [PubMed] [Google Scholar]
- 30.Sandu OA, Ragolia L, Begum N. Diabetes in the Goto-Kakizaki rat is accompanied by impaired insulin-mediated myosin-bound phosphatase activation and vascular smooth muscle cell relaxation. Diabetes 2000;49:2178–2189 [DOI] [PubMed] [Google Scholar]
- 31.Cryer PE. Hypoglycemia-associated autonomic failure in diabetes. Handb Clin Neurol 2013;117:295–307 [DOI] [PubMed] [Google Scholar]
- 32.Rana O, Byrne CD, Kerr D, et al. Acute hypoglycemia decreases myocardial blood flow reserve in patients with type 1 diabetes mellitus and in healthy humans. Circulation 2011;124:1548–1556 [DOI] [PubMed] [Google Scholar]
- 33.Mathew M, Tay E, Cusi K. Elevated plasma free fatty acids increase cardiovascular risk by inducing plasma biomarkers of endothelial activation, myeloperoxidase and PAI-1 in healthy subjects. Cardiovasc Diabetol 2010;9:9. [DOI] [PMC free article] [PubMed] [Google Scholar]
- 34.Frost RA, Nystrom GJ, Lang CH. Epinephrine stimulates IL-6 expression in skeletal muscle and C2C12 myoblasts: role of c-Jun NH2-terminal kinase and histone deacetylase activity. Am J Physiol Endocrinol Metab 2004;286:E809–E817 [DOI] [PubMed] [Google Scholar]
- 35.Halleux CM, Declerck PJ, Tran SL, Detry R, Brichard SM. Hormonal control of plasminogen activator inhibitor-1 gene expression and production in human adipose tissue: stimulation by glucocorticoids and inhibition by catecholamines. J Clin Endocrinol Metab 1999;84:4097–4105 [DOI] [PubMed] [Google Scholar]
- 36.van der Poll T, Levi M, Dentener M, et al. Epinephrine exerts anticoagulant effects during human endotoxemia. J Exp Med 1997;185:1143–1148 [DOI] [PMC free article] [PubMed] [Google Scholar]
- 37.Farmer P, Pugin J. beta-adrenergic agonists exert their “anti-inflammatory” effects in monocytic cells through the IkappaB/NF-kappaB pathway. Am J Physiol Lung Cell Mol Physiol 2000;279:L675–L682 [DOI] [PubMed] [Google Scholar]
- 38.Hafezi-Moghadam A, Simoncini T, Yang Z, et al. Acute cardiovascular protective effects of corticosteroids are mediated by non-transcriptional activation of endothelial nitric oxide synthase. Nat Med 2002;8:473–479 [DOI] [PMC free article] [PubMed] [Google Scholar]