

Abstract
Background
Chronic malnutrition, termed stunting, is defined as suboptimal linear growth, affects one third of children in developing countries, and leads to increased mortality and poor developmental outcomes. The causes of childhood stunting are unknown, and strategies to improve growth and related outcomes in children have only had modest impacts. Recent studies have shown that the ecosystem of microbes in the human gut, termed the microbiota, can induce changes in weight. However, the specific changes in the gut microbiota that contribute to growth remain unknown, and no studies have investigated the gut microbiota as a determinant of chronic malnutrition.
Results
We performed secondary analyses of data from two well-characterized twin cohorts of children from Malawi and Bangladesh to identify bacterial genera associated with linear growth. In a case-control analysis, we used the graphical lasso to estimate covariance network models of gut microbial interactions from relative genus abundances and used network analysis methods to select genera associated with stunting severity. In longitudinal analyses, we determined associations between these selected microbes and linear growth using between-within twin regression models to adjust for confounding and introduce temporality. Reduced microbiota diversity and increased covariance network density were associated with stunting severity, while increased relative abundance of Acidaminococcus sp. was associated with future linear growth deficits.
Conclusions
We show that length growth in children is associated with community-wide changes in the gut microbiota and with the abundance of the bacterial genus, Acidaminococcus. Larger cohorts are needed to confirm these findings and to clarify the mechanisms involved.
Electronic supplementary material
The online version of this article (doi:10.1186/s40168-015-0089-2) contains supplementary material, which is available to authorized users.
Keywords: Microbiota, Microbiome, Intestinal, Stunting, Growth, Statistical learning, Networks
Background
Undernutrition in early childhood underlies 45 % of mortality in children aged under 5 years worldwide, resulting in 3.1 million deaths annually [1]. Ponderal and linear growth faltering in children are viewed as indicators of acute and chronic malnutrition, respectively, and are often measured in terms of z-scores (i.e., deviations in attained growth from a reference population median). Children whose length- or height-for-age z-scores (LAZ or HAZ) is more than 2 standard deviations below the reference population median are termed stunted. Stunting has short-term effects on morbidity and mortality [2], leads to poor motor development and cognition, and reduces educational and economic attainment over the life-course [1–3]. An estimated 165 million children under 5 years old were stunted in 2011 [1], representing almost one third of children in this age group in low- and middle-income countries (LMICs), hindering developmental potential and human capital of entire societies.
Most linear growth faltering occurs in the period from conception to 2 years of age, and restoration of deficits in linear growth beyond that period is limited. Interventions to prevent stunting are therefore required early in the life-course. Social, economic, and educational factors, as well as infectious diseases and poor diet in early childhood all contribute to linear growth faltering [1, 4–7]. Furthermore, a number of studies have shown that small intestinal inflammation and permeability are associated with poor linear growth [8–11]. This subclinical gut pathology has been termed environmental enteric dysfunction (EED) and is acquired early in life among children living in unsanitary conditions [5, 12–15]. Reduced intestinal barrier function caused by EED enables bacterial translocation to occur, leading to chronic systemic inflammation, which is associated with reduced insulin-like growth factor 1 (IGF-1) and linear growth faltering [16]. However, the pathophysiology of stunting is not well understood, and currently available interventions, which focus mostly on dietary supplementation and prevention of diarrhea, have only a modest impact [17]. Mechanisms underlying stunting therefore need to be better defined so that tractable pathways for intervention can be identified.
Recent studies suggest a role of the intestinal microbiota in child growth. The intestinal microbiota is an ecosystem of gut microbes that helps to modulate nutrient harvesting from the diet, mucosal inflammation, and the immune response in the gut [18–22]. Observational studies in humans [23–26] have demonstrated a relationship between the intestinal microbiota and severe acute malnutrition (SAM). A causal effect of the intestinal microbiota on weight has also been shown using experimental animal models [27, 28]. However, the specific changes in the microbiota that contribute to growth remain unclear, and no studies to date have investigated the intestinal microbiota as a determinant of linear growth.
We performed a secondary analysis of publicly available data from two twin cohorts of undernourished children from low-income settings (Malawi and Bangladesh) [25, 27], to identify bacterial genera whose relative abundances explain linear growth. Previous analyses from these cohorts showed that acute malnutrition was associated with differences in gut microbiota functional gene abundances [27] and maturation [25]. Our analyses aimed to determine changes in gut microbiota networks and relative abundance associated with stunting status, in order to identify potential microbiota members that contribute to linear growth faltering (i.e., chronic malnutrition). We hypothesized that differences in the relative abundance of identified genera are independently associated with prospective deficits in linear growth between siblings.
Results and discussion
Cohort description
Data were provided for 44 children in the Malawi cohort, who were median 10.2 months (interquartile range (IQR) 4.6, 14.5) old at baseline and followed for median 9.7 months (IQR 4.1, 14.5). Baseline HAZ and weight-for-height z-scores (WHZ) were −2.95 (IQR −3.70, −2.18) and −0.46 (IQR −0.87, −0.13), respectively. Anthropometric, epidemiological, and DNA whole genome shotgun sequencing data were provided for median 7 (IQR 4, 8) follow-up visits per child, for a total of 308 longitudinal observations (Additional file 1: Table S1). Data were available for 25 children in the Bangladesh birth cohort, who were 0.3 months (IQR 0.19, 0.63) old at baseline and followed for median 14.5 months (IQR 11.9, 20.7). Baseline HAZ and WHZ were −3.75 (IQR −4.54, −2.68) and −0.57 (IQR −1.51, 0.35), respectively. Anthropometric, epidemiological, and relative abundance data were provided for median 17 (IQR 13, 22) follow-up visits per child. Randomly excluding one child from the set of triplets for between-within regression analyses provided 429 longitudinal observations.
Description of cases and controls
In the Malawi cohort, 13 children had a follow-up visit that met incident case criteria for severe stunting, and 11 had a follow-up visit that met control criteria for stunting (see “Methods” for details on case and control definitions). Six eligible cases were co-twins, and six eligible controls were also co-twins. In the Bangladesh cohort, eight children had a follow-up visit that met incident case criteria, and ten had a follow-up visit that met control criteria. Four eligible cases were co-twins, and ten eligible controls were co-twins. For each pair of co-twins that both met case criteria, we randomly chose one sibling as a case to avoid within-group correlations [29]. The same was done for pairs of co-twins that both met control criteria. This provided ten cases and eight controls from Malawi, and six cases and five controls from Bangladesh (Fig. 1). Cases from the Malawi cohort had lower HAZ (−3.08 v −2.45, p < 0.01) and were younger compared to controls (10.8 v 19.6 months, p = 0.05). Similarly, in the Bangladesh cohort, case HAZ was −3.17 v −2.63 for controls, p < 0.01, and age was 2.9 v 11.0 months, p < 0.01. WHZ was also higher in Bangladesh cases compared to controls (0.53 v −0.64, p = 0.05) (Additional file 1: Table S1).
Fig. 1.
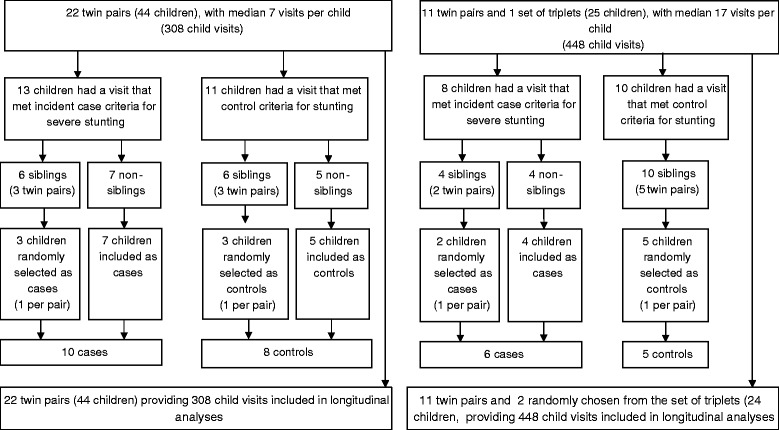
Flow chart of case and control selection from the Malawi twin cohort for network analysis (left) and flow chart of case and control selection from the Bangladesh twin cohort for network analysis (right)
Genus relative abundance and microbiota diversity
Roche 454 shotgun whole genome sequence data were provided for median 76,700 (IQR 55,200, 103,000) reads per sample in the entire Malawi cohort, while relative abundance data from the Bangladesh cohort were quantified from a median 20,192 (IQR 16, 155, 24,632) reads. In both cohorts, a similar number of reads were available for cases and controls (Additional file 1: Table S1).
In the Malawi cohort, Bifidobacterium (42.8 %) and Prevotella (22.7 %) were the most abundant genera identified, followed by Bacteroides (3.7 %), Faecalibacterium (3.14 %), Collinsella (1.0 %), Lactobacillus (0.6 %), and Blautia (0.6 %). In the Bangladesh cohort, Bifidobacterium (46.2 %), Streptococcus (4.8 %), Lactobacillus (2.6 %), and Escherichia/Shigella (1.8 %) were the most abundant genera, followed by Collinsella (0.5 %). These were also the most prevalent genera identified in fecal samples collected during follow-up (Additional file 2: Table S2) and are consistent with the literature on microbiota in infants and with different diets [30–35]. In the Malawi cohort, Prevotella (18.1 v 42.9, p = 0.06), Bacteroides (1.9 v 7.4, p = 0.01), Eubacterium (0.0 v 2.4, p < 0.01), and Blautia (0.6 v 2.4, p = 0.03) showed the largest decrease in relative abundance in cases v controls (Additional file 3: Table S3). In the Bangladesh cohort, Lactobacillus (0.1 v 8.7, p < 0.01), Olsenella (0.0 v 0.8, p < 0.01), Dorea (0.0 v 0.7, p = 0.05), Blautia (0.0 v 0.2, p < 0.01), and unclassified genera in the Coriobacteriaceae (0.0 v 0.3, p < 0.01) and Enterococcaceae (0.0 v 0.1, p = 0.08) families showed the largest decrease in relative abundance in cases v controls. Lesser, but statistically significant depletion of Anaerococcus, Dialister, Faecalibacterium, Megamonas, Weissella, Megasphaera, and unclassified genera in the Lachnospiraceae, Lactobacillaceae, and Veillonellaceae families were also observed in Bangladesh cases (Additional file 4: Table S4). Case microbiota were less diverse than controls in both cohorts (Malawi: 0.5 v 0.7, p = 0.02; Bangladesh: 0.5 v 0.7, p = 0.05) (Additional file 1: Table S1).
Network indices
Network density (i.e., the probability that two randomly selected microbes co-vary) was greater in case compared to control networks in both cohorts (Malawi: 0.56 v 0.25, p = 0.08; Bangladesh: 0.56 v 0.33, p = 0.42), indicating a greater potential for information flow in case microbiota. We also observed that the density of edges from aerobes to anaerobes was greater in the case network in both populations (Figs. 2 and 3).
Fig. 2.
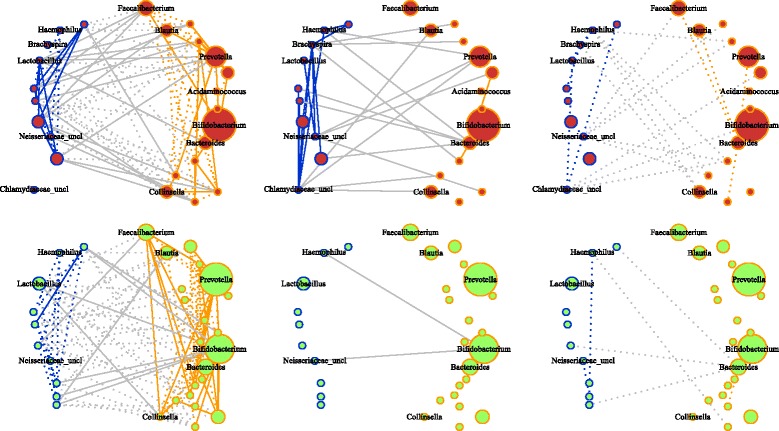
Graphical models of Malawi case and control microbiota networks constructed using glasso. (Top) Case networks. (Bottom) Control networks. (Left to right) Associations found in both groups, cases only and controls only. Solid and dotted edges indicate positive and negative associations. Blue indicates associations among aerobic and facultative anaerobic genera. Orange indicates associations among anaerobic genera. Gray indicates associations from aerobic/facultative anaerobic to anaerobic genera. Node size is proportional to median abundance
Fig. 3.
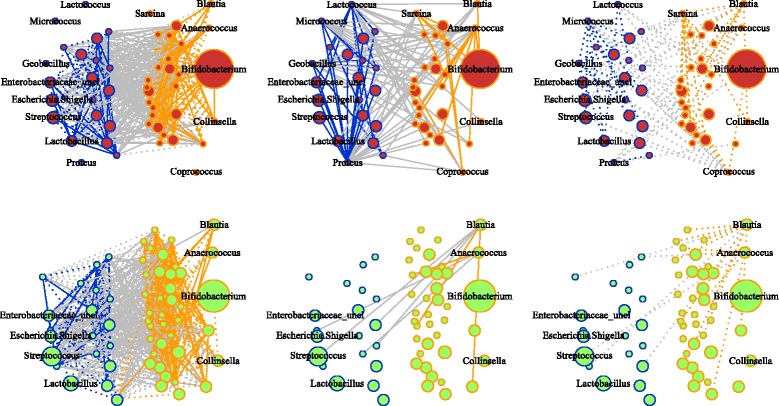
Graphical models of Bangladesh case and control microbiota networks constructed using glasso. (Top) Case networks. (Bottom) Control networks. (Left to Right) Associations found in both groups, cases only and controls only. Solid and dotted edges indicate positive and negative associations. Blue indicates associations among aerobic and facultative anaerobic genera. Orange indicates associations among anaerobic genera. Gray indicates associations from aerobic/facultative anaerobic to anaerobic genera. Node size is proportional to median abundance
In the Malawi cohort, differences in degree centrality were observed for Acidaminococcus (0.6 v 0.0, p = 0.06), Bacteroides (0.6 v 0.2, p = 0.03), Brachyspira (0.6 v 0.0, p = 0.09), Haemophilus (0.6 v 0.2, p = 0.07), and unclassified genera in the Neisseriaceae (0.6 v 0.2, p = 0.08) and Chlamydiaceae (0.6 v 0.0, p = 0.05) families in case v control networks (Additional file 3: Table S3). In the Bangladesh cohort, Acinetobacter (0.5 v 0.0, p = 0.03), Anaerococcus (0.7 v 0.2, p = 0.09), Blautia (0.7 v 0.2, p = 0.08), Coprococcus (0.5 v 0.0, p = 0.03), Geobacillus (0.6 v 0.0, p = 0.09), Lactococcus (0.6 v 0.0, p = 0.02), Micrococcus (0.5 v 0.0, p = 0.05), Proteus (0.6 v 0.0, p = 0.09), and Sarcina (0.6 v 0.0, p = 0.09) were more central in the case network (Additional file 4: Table S4).
Between-within models
Thirty of 164 genera identified across both populations were selected, based on statistically significant differences in relative abundance or centrality, to estimate their association with future HAZ using multivariable between-within regression models. Acidaminococcus, of the phylum Firmicutes, was the only genus associated with HAZ in longitudinal analyses of both cohorts. In the Malawi cohort, a 0.1 % difference in the relative abundance of this genus between co-twins was associated with a 0.08 lower height-for-age z-score (90 % confidence interval (CI) −0.12, −0.04) at the subsequent study visit in the co-twin who had the greater Acidaminococcus abundance compared to their sibling. In the Bangladesh cohort, a 0.1 % difference in the relative abundance of this genus between co-twins was associated with a 0.19 lower HAZ (90 % CI −0.25, −0.13) at the subsequent visit in the co-twin with the greater Acidaminococcus abundance. These associations remained significant after controlling for multiple hypothesis testing (Table 1).
Table 1.
Relative genus abundance associations with future HAZ estimated using multivariable between-within twin regression models for genera with a significant difference in degree centrality between cases and controls
| Malawi | Bangladesh | |||||||
|---|---|---|---|---|---|---|---|---|
| Genus | Abundance differencea | Coefficient (90 % CI) | p value | Adjusted p value | Abundance differencea | Coefficient (90 % CI) | p value | Adjusted p value |
| Acidaminococcus | 0.40 | −0.080 (−0.124, −0.037) | <0.01 | 0.02 | 0.30 | −0.191 (−0.253, −0.129) | <0.01 | <0.01 |
| Acinetobacter b | 0.00 | −0.032 (−0.159, 0.094) | 0.68 | 0.89 | ||||
| Anaerococcus b | 0.01 | −0.182 (−0.915, 0.551) | 0.68 | 0.89 | ||||
| Bacteroides | 4.51 | 0.000 (−0.001, 0.001) | 0.67 | 0.89 | 0.29 | −0.001 (−0.002, 0.001) | 0.63 | 0.89 |
| Blautia | 2.51 | −0.001 (−0.003, 0.002) | 0.64 | 0.89 | 5.00 | 0.001 (0.000, 0.001) | 0.07 | 0.45 |
| Brachyspira | 1.03 | 0.003 (−0.002, 0.007) | 0.32 | 0.89 | ||||
| Chlamydiaceae_uncl | 0.37 | −0.012 (−0.054, 0.030) | 0.65 | 0.89 | ||||
| Coprococcus | 0.35 | −0.006 (−0.061, 0.049) | 0.87 | 0.92 | 4.33 | −0.003 (−0.010, 0.003) | 0.38 | 0.89 |
| Geobacillus b | 0.01 | 0.266 (−0.154, 0.685) | 0.30 | 0.89 | ||||
| Haemophilus | 0.76 | 0.001 (−0.009, 0.010) | 0.92 | 0.92 | ||||
| Lactococcus b | 0.04 | −0.002 (−0.007, 0.004) | 0.59 | 0.89 | ||||
| Micrococcus b | 0.46 | −0.107 (−2.183, 0.169) | 0.16 | 0.94 | ||||
| Neisseriaceae_uncl | 0.22 | −0.027 (−0.103,0.048) | 0.56 | 0.89 | 0.01 | 0.001 (−0.001, 0.004) | 0.46 | 0.64 |
| Proteus b | 0.00 | −0.002 (−0.037, 0.033) | 0.94 | 0.94 | ||||
| Sarcina b | 5.00 | 0.000 (0.000, 0.001) | 0.54 | 0.89 | ||||
Coefficients are expressed as the average difference in future HAZ per 0.1 % difference in abundance between siblings
90 % CI 90 % confidence interval, HAZ height-for-age z-score
aMedian difference in relative abundance between siblings in a twin pair
bModels could not be fit in the Malawi cohort because these genera were only identified in ≤2 samples
The literature on Acidaminococcus sp., with which we can infer its role in the human gut and its potential impact on linear growth in children, is sparse. Only two species in this genus have been described [36, 37]. One notable characteristic of these described species is their ability to consume glutamate as their sole source of carbon and energy. In porcine models, dietary glutamate is an essential oxidative fuel for the intestinal epithelium [38, 39], which undergoes a continuous process of regeneration and has high energy demands. Estimates for the amount of glutamate completely metabolized in the gut range from 64 [39] to 90 % [38]. As such, glutamate is important to gut epithelium restitution. The beneficial effect of glutamate on restoration of gut barrier function has been observed using in vitro cell lines [40–42], as well as in animal models of glutamate supplementation [43–46]. Glutamate is an important precursor and intermediate in the synthesis and metabolic recycling of other amino acids, and with the urea cycle, in the gut [38, 39, 47, 48]. Amino acids closely interlinked with glutamate metabolism include arginine, which also contributes to epithelium restitution, preserves barrier function, prevents accumulation of ammonia in the gut, and attenuates intestinal tissue damage [49–51], and glutathione, which protects the epithelium from damage by oxidative stress [52, 53]. Altogether, major functions of glutamate in the gut appear to be its role as a key intermediate in gut amino acid metabolism and nitrogen cycling, maintenance of epithelial integrity, and preservation of barrier function. Biomarkers of intestinal injury and repair have been associated with lower HAZ in LMICs [54]. Impaired gut barrier function is characteristic of EED, which is also associated with poor linear growth [8–11].
This evidence led us to pose the a posteriori hypothesis that glutamate fermentation by microbes is negatively associated with future HAZ. We tested this hypothesis using KEGG enzyme abundance data provided for the Malawi cohort. We fitted between-within regression models where the relative abundance of critical genes utilized in glutamate fermentation pathways by microbes [55] was the exposure of interest. We found that the abundance of genes encoding glutamate dehydrogenase and α-keto-glutarate reductase was negatively associated with future HAZ. For glutamate dehydrogenase and α-keto-glutarate reductase, respectively, a one unit greater gene abundance in one co-twin compared to their sibling was associated with a −0.17 (90 % CI −0.29, −0.04, p = 0.03) and −0.08 (90 % CI −0.16, −0.01, p = 0.07) smaller HAZ in that co-twin at the subsequent study visit. These are the first two enzymes involved in the hydroxyglutarate fermentation pathway used by Acidaminococcus fermentans for glutamate fermentation; some species in the Peptoniphilus, Fusobacterium, and Clostridia families can also utilize this pathway [55, 56].
In the Bangladesh cohort, we also observed a −0.003 (90 % CI −0.004, −0.002) lower HAZ and a 0.001 (90 % CI 0.000, 0.001) greater HAZ at the subsequent visit in co-twins who had a 0.1 % greater abundance of Weissella or Blautia, respectively, compared to their siblings (Table 1 and Additional file 5: Table S5). The association with Blautia was not statistically significant after controlling for multiple hypothesis testing.
Discussion
In these analyses, we show that less diverse gut microbiota with greater covariance network density are associated with stunting severity, and an increase in the relative abundance of Acidaminococcus sp. is associated with lower future linear growth in two very different, well-characterized cohorts of children living in low-income settings. We applied a novel approach, utilizing a statistical learning method combined with network analysis and a permutation test to determine differences between microbiota communities of stunted and severely stunted children from these cohorts, and applied longitudinal epidemiological analysis methods to investigate whether changes in the genera identified were associated with future linear growth.
In our longitudinal models, greater abundance of Acidaminococcus was associated with a future deficit in HAZ between co-twins in both cohorts. Acidaminococcus sp. can utilize glutamate as their sole source of carbon and energy. Greater abundance of genes encoding the first two enzymes in the hydroxyglutarate pathway for glutamate fermentation was also associated with a future HAZ deficit. Overgrowth of bacteria that can ferment glutamate may have a deleterious effect on linear child growth, potentially as a result of glutamate’s importance in amino acid metabolism, nitrogen balance, and barrier function. This observation may also reflect the state of malnutrition in these cohorts of children, as the microbiota turns to host-associated proteins for energy. The weak negative association between Weissella and future HAZ observed in the Bangladesh cohort was not detected in the Malawi children and needs to be confirmed in other studies.
The impact of Acidaminococcus on growth may also involve its microbial relationships. Network analysis provides a useful framework for identifying important bacteria by their number of relationships [57–59]. One study used correlation network centrality measures to identify bacteria that successfully promote the growth conditions of a previously uncultivable microorganism [59]. In the Malawi cohort, Acidaminococcus showed a large increase in degree centrality in cases, indicating a potential increase in its influence on microbiota composition. The possibility that rare commensals can promote pathological states based on their relationships with other microbes, despite their low abundance, has been proposed [60] and is in line with the notion of keystone organisms [60–62]. Although an increase in Acidaminococcus centrality was not observed in the Bangladesh cases, random sampling error introduced by selecting cases and controls from such a small population (n = 25), lacking truly healthy control subjects of normal length, could bias how representative the case and control exposure histories were in that cohort. Larger epidemiological and experimental investigations are needed to confirm these findings and the mechanisms involved.
Finally, in both populations, we observed greater density in case networks that was only statistically significant in the Malawi cohort and a larger proportion of connections from aerobes to anaerobes in cases. An increase in the average number of connections with worsening nutritional status was also reported in children with SAM using correlation networks [23], and greater connectivity between aerobic and anaerobic bacteria was reported for the microbiota correlation network of children with moderate-to-severe diarrhea compared to non-diarrheal controls [63]. Simulation studies suggest that increased density may provide greater resource flow to nodes that are normally of low importance and may reduce the efficiency of resource flow out of the system [64, 65].
In construction of our graphical models, we adjusted for potential confounders that were reported (e.g., age and WHZ) but could not control for confounding when comparing case and control network indices. These differences may, therefore, still be confounded by age or by other unreported factors such as infant diet, maternal, or environmental variables, since controls were older than cases in both populations, and microbiota composition and structure may relate to the timing of complementary food introduction or environmental exposures. We cannot dismiss the possibility of spurious associations in our graphical models due to compositional effects [66], residual confounding by diet or other factors, and small sample size. The resulting “noise” limited our ability to detect differences between case and control networks, and we must exercise caution in interpreting pairwise associations as true ecological interactions.
The between-within multivariable regression models, however, control for unreported confounders that are shared between co-twins (e.g., fetal, maternal, and environmental), other factors that are identical between twins such as age at each visit and length of follow-up, as well as reported confounders that differ between siblings (e.g., diarrhea and infant sex). Data on any antibiotic use and diet at each visit were only provided for the Bangladesh cohort. Including antibiotic use and breastfeeding (without the use of formula or solid foods) in the between-within models did not change the results. The association between Acidaminococcus and linear growth was reproduced in both populations, suggesting that residual confounding due to other unreported factors that may differ between siblings, such as HIV status (these data were not available from either cohort), is unlikely. We also lagged these models so that changes in exposure preceded changes in growth. The temporality adds credibility to our main findings that an increase in Acidaminococcus and glutamate-fermenting microbes are associated with future growth deficits. Measurement error in quantification of relative abundance is unavoidable in microbiota studies. Since any such error is unlikely to be systematically related to future growth deficits between siblings, measurement error in these analyses would attenuate true associations with growth, further reducing our power in these small cohorts. Finally, the original cohort studies were not designed to investigate stunting. The average child in these populations already suffered from severe growth restriction at study entry, and these data may not elucidate the potential negative effect of microbiota dysbiosis or the protective effect of certain genera in children who are of normal length but still at risk of becoming stunted. This may apply particularly to the case-control analyses, for which there were no healthy, non-stunted controls.
Conclusions
Our study applied a novel use of statistical learning and network methods to identify and interpret changes in graphical models of microbiota covariance patterns. They suggest that reduced microbiota diversity and changes in covariance network density are associated with stunting severity and that overgrowth of Acidaminococcus, and possibly other glutamate-fermenting microbes, may contribute to future growth deficits in already malnourished children. Our findings demonstrate the potential role that certain types of commensals in the gut may have on linear growth deficits. Larger primary studies in other settings, designed specifically to evaluate stunting in infants, are needed to confirm these findings, and experimental studies are needed to clarify the mechanisms involved.
Methods
Study sample
Demographic, clinical, and anthropometric data from a cohort of 22 twin pairs from Malawi, and a second cohort of 11 twin pairs plus one set of triplets from Bangladesh, were made available at http://gordonlab.wustl.edu/SuppData.html. Details are provided in Smith et al. [27] and Subramanian et al. [25]. In brief, 22 twin pairs ages birth to 3 years were selected from among 317 available pairs in five rural communities in Malawi for longitudinal analyses of their gut microbiota. Twin pairs were selected if at least four fecal samples were available from each co-sibling. The 12 sets of siblings from Bangladesh were selected from among mothers with multiple pregnancies at a child health and family planning clinic in Dhaka and were followed up for longitudinal gut microbiota evaluation. In both twin cohorts, at each follow-up visit, length/height and weight were measured, and fecal samples were collected along with data on age in months and diarrhea in the 7 days prior to or at the visit for Malawi and Bangladesh, respectively. Anthropometric measures were provided as height-for-age and weight-for-height z-scores. In the Malawi cohort, if at least one co-twin developed SAM, as defined using WHO criteria [67], both were treated with ready-to-use therapeutic food (RUTF).
Whole genome sequencing and annotation
Whole genome sequence datasets from the Malawi cohort were made available through the European Bioinformatics Institute at http://www.ebi.ac.uk/ena/data/view/ERP001911&display=html [27] and MG-RAST (http://metagenomics.anl.gov/) [30]. Relative genus abundances (expressed as a percentage of the total amount of DNA assigned to a bacterial taxon in each stool sample) were estimated from shotgun reads using MetaPhlan [68]. Relative operational taxonomic unit (OTU) abundance data from the Bangladesh cohort were used as provided at http://gordonlab.wustl.edu/SuppData.html and were analyzed at the genus level. Extraction of genomic DNA from fecal samples, DNA sequencing, processing and filtering of reads, and, for Bangladesh data, OTU picking and taxon assignment have been described [25, 30]. The Simpson diversity index was calculated as a measure of alpha diversity in all samples using vegan [69]. Simpson diversity measures the probability that two randomly selected microbes in a sample will be from different taxa and provides a measure of the number of different types of bacteria present.
Statistical analyses
Analyses were performed separately for the Malawi and Bangladesh cohorts using two approaches. We first conducted an analysis of unmatched cases and controls selected from each cohort in order to identify changes in microbiota networks and relative genus abundance associated with stunting status and to select genera for inclusion in longitudinal analyses. Next, in longitudinal analyses, we fitted multivariable regression models, using data available at all follow-up visits for the entire cohort of children, to control for confounding and to introduce temporality.
Case-control network analyses
Children in the Malawi and Bangladesh twin cohorts had median baseline HAZ of −2.96 (IQR −3.68, −2.18) and −3.75 (IQR −4.54, −2.68), respectively, indicating that the majority were severely stunted at study entry (Additional file 6: Figure S1). For the case-control analyses, linear growth status was therefore defined as severely stunted (HAZ ≤ −3, cases) or stunted (−3 < HAZ ≤ −2, controls). For cases, the visit where a child first reached HAZ ≤ −3 was selected, excluding children already severely stunted at study entry. The subset of children who were not siblings of cases and who had HAZ > −3 but ≤ −2 at the end of follow-up, regardless of their baseline z-score, was selected as controls. Spurious inferences can arise in the analysis of correlated data [70]. Since methods to address correlations are not available for the network analyses methods we implemented, if both siblings in a pair met case or control criteria, one was randomly chosen to avoid within-group correlations [29], and data from only one visit were used per child. Differences in anthropometric, demographic and epidemiological measures, alpha diversity, and relative abundance between cases and controls were evaluated using the chi-squared test or by permutation test on the median, as appropriate.
A supplemental approach to diversity indices for investigating the microbiota uses networks of pairwise correlations between taxa as a model of microbe-microbe interactions. In this representation, nodes are genera and a link between two nodes represents a non-zero association between two genera. This association is used as a proxy for bacterial interaction (see Additional file 7 for further information). An alternative to pairwise correlations is to estimate an inverse covariance matrix from genus abundances as a graphical model of important bacterial relationships. We generated these graphical models separately for cases and controls using the graphical lasso (glasso) [71]. The covariance associations estimated by the glasso (i.e., the links between genera in each network) are independent of all other taxa and covariates included in the model. For each case and control network, we calculated graph density and the normalized degree centrality of each genus [72] using igraph [73]. Differences in network indices were assessed for statistical significance by permutation. Specifically, children were randomly reallocated between the case and control groups 1000 times. For each permutation, one network was estimated per group and distributions of the difference in network indices between case and control networks were generated for statistical inference. Genera with significant differences in degree centrality or relative abundance between cases and controls were selected for longitudinal analyses.
Longitudinal analyses
After performing microbiota feature selection in the case-control analyses, we fitted between-within regression models [70, 74], using data for all follow-up visits from all twin pairs in each cohort (regardless of their selection as cases or controls), to investigate whether the relative abundance of selected genera was associated with linear growth. A between-within model allows estimation of the effect that differences in exposure level (e.g., differences in genus abundance) between siblings within a twin pair have on their outcomes, while adjusting for unmeasured confounders that siblings share, such as fetal, maternal, and environmental factors. This is done by including both (i) individual sibling exposure values and (ii) the mean exposure value of co-twins as covariates in a regression model. Adjustment for measured confounders not shared between co-twins (e.g., diarrhea) can be made by including sibling-specific covariates in the model [74].
We fitted a separate model for each genus selected, with relative abundance as the exposure and HAZ as the outcome. Each model was adjusted for reported diarrhea, WHZ, infant sex, and alpha diversity as reported confounders not shared by co-twins. Age in months and length of follow-up since baseline were also included as predictors of the outcome. All covariates were lagged by one visit in order to model their effect on future HAZ, with the exception of length of follow-up and age. All between-within models were fitted by generalized estimating equations (GEE) using geepack [75], and multiple hypothesis testing adjustments using the Benjamini-Hochberg method [76] were made. Statistical significance was determined at α < 0.1 due to the small sample size of both cohorts. All analyses were conducted in R version 3.0.1.
Acknowledgments
Funding sources
Ethan Gough was supported by the Vanier Canada Graduate Scholarship.
Additional files
Study participant characteristics in each cohort at the baseline visit and in cases v controls. Summary statistics describing the baseline characteristics of participants enrolled in the Malawi and Bangladesh twin cohorts, and comparison of case versus control characteristics.
Genus relative abundance and genus presence in 308 Malawi and 429 Bangladesh fecal samples collected during follow-up. Median, minimum and maximum relative abundance of each genus identified in 308 Malawi and 429 Bangladesh fecal samples collected during follow-up, and the number and proportion of samples in each cohort in which each genus was identified.
Relative abundance and normalized degree centrality of genera identified in severely stunted cases and stunted controls selected from the Malawi cohort. Median, minimum and maximum relative abundance of each genus identified in 10 case or 8 control samples selected from the Malawi cohort. P-values were obtained by permutation test for a difference between case and control medians. Degree centralities of each genus identified in case or control samples were calculated from covariance network models of gut microbial interactions estimated using the graphical lasso, and were normalized for the number of genera in each network. P-values were obtained by permutation test for a difference between case and control degree centralities.
Relative abundance and normalized degree centrality of genera identified in severely stunted cases and stunted controls selected from the Bangladesh cohort. Median, minimum and maximum relative abundance of each genus identified in 6 case or 5 control samples selected from the Bangladesh cohort. P-values were obtained by permutation test for a difference between case and control medians. Degree centralities of each genus identified in case or control samples were calculated from covariance network models of gut microbial interactions estimated using the graphical lasso and were normalized for the number of genera in each network. P-values were obtained by permutation test for a difference between case and control degree centralities.
Relative genus abundance associations with future HAZ estimated using multivariable between-within twin regression models for genera with a significant difference in relative abundance between cases and controls. Associations between relative abundance and future HAZ for each genus with a statistically significant difference in median abundance between cases and controls selected from either the Malawi or Bangladesh cohorts. Coefficients measure the average difference in future HAZ between siblings within a pair of twins that is associated with each 0.1 % difference in relative abundance between siblings. Coefficients are also adjusted for infant sex, weight-for-height z-scores, diarrhea, and alpha diversity using multivariable between-within twin regression, since these factors may differ between co-twins.
Histograms of height-for-age z-score distributions in Malawi and Bangladesh children at study entry. Figure: (top) Height-for-age z-score distribution in the 44 Malawi children at study entry; (bottom) Height-for-age z-score distribution in the 25 Bangladesh children at study entry. Red vertical lines indicate the World Health Organization cut-off for stunting.
Extended Methods. An extended description of the statistical analysis methods.
Footnotes
Competing interests
The authors declare that they have no competing interests.
Authors’ contributions
EKG, DAS, EEMM, AJP, RJS, JHH, and ARM participated in the conception and design. EKG, DAS, EEMM, and ARM participated in the analysis and interpretation of data. EKG drafted the manuscript. All authors read and revised the manuscript critically for important intellectual content and approved the final version to be published.
Contributor Information
Ethan K. Gough, Email: ethan.gough@mail.mcgill.ca
David A. Stephens, Email: david.stephens@mcgill.ca
Erica E.M. Moodie, Email: erica.moodie@mcgill.ca
Andrew J. Prendergast, Email: a.prendergast@qmul.ac.uk
Rebecca J. Stoltzfus, Email: rjs62@cornell.edu
Jean H. Humphrey, Email: jhumphrey@zvitambo.co.zw
Amee R. Manges, Phone: 604-822-9203, Email: amee.manges@ubc.ca
References
- 1.Black RE, Victora CG, Walker SP, Bhutta ZA, Christian P, de Onis M, et al. Maternal and child undernutrition and overweight in low-income and middle-income countries. Lancet. 2013;382(9890):427–51. doi: 10.1016/S0140-6736(13)60937-X. [DOI] [PubMed] [Google Scholar]
- 2.Victora CG, Adair L, Fall C, Hallal PC, Martorell R, Richter L, et al. Maternal and child undernutrition: consequences for adult health and human capital. Lancet. 2008;371(9609):340–57. doi: 10.1016/S0140-6736(07)61692-4. [DOI] [PMC free article] [PubMed] [Google Scholar]
- 3.Adair LS, Fall CH, Osmond C, Stein AD, Martorell R, Ramirez-Zea M, et al. Associations of linear growth and relative weight gain during early life with adult health and human capital in countries of low and middle income: findings from five birth cohort studies. Lancet. 2013;382(9891):525–34. doi: 10.1016/S0140-6736(13)60103-8. [DOI] [PMC free article] [PubMed] [Google Scholar]
- 4.Checkley W, Buckley G, Gilman RH, Assis AM, Guerrant RL, Morris SS, et al. Multi-country analysis of the effects of diarrhoea on childhood stunting. Int J Epidemiol. 2008;37(4):816–30. doi: 10.1093/ije/dyn099. [DOI] [PMC free article] [PubMed] [Google Scholar]
- 5.Dewey KG, Mayers DR. Early child growth: how do nutrition and infection interact?: How do nutrition and infection interact? Matern Child Nutr. 2011;7:129–42. doi: 10.1111/j.1740-8709.2011.00357.x. [DOI] [PMC free article] [PubMed] [Google Scholar]
- 6.Guerrant RL, Oriá RB, Moore SR, Oriá MO, Lima AA. Malnutrition as an enteric infectious disease with long-term effects on child development. Nutr Rev. 2008;66(9):487–505. doi: 10.1111/j.1753-4887.2008.00082.x. [DOI] [PMC free article] [PubMed] [Google Scholar]
- 7.Rodriguez L, Cervantes E, Ortiz R. Malnutrition and gastrointestinal and respiratory infections in children: a public health problem. Int J Environ Res Public Health. 2011;8(4):1174–205. doi: 10.3390/ijerph8041174. [DOI] [PMC free article] [PubMed] [Google Scholar]
- 8.Lin A, Arnold BF, Afreen S, Goto R, Huda TMN, Haque R, et al. Household environmental conditions are associated with enteropathy and impaired growth in rural Bangladesh. Am J Trop Med Hyg. 2013;89(1):130–7. doi: 10.4269/ajtmh.12-0629. [DOI] [PMC free article] [PubMed] [Google Scholar]
- 9.Kosek M, Haque R, Lima A, Babji S, Shrestha S, Qureshi S, et al. Fecal markers of intestinal inflammation and permeability associated with the subsequent acquisition of linear growth deficits in infants. Am J Trop Med Hyg. 2013;88(2):390–6. doi: 10.4269/ajtmh.2012.12-0549. [DOI] [PMC free article] [PubMed] [Google Scholar]
- 10.Campbell DI, Elia M, Lunn PG. Growth faltering in rural Gambian infants is associated with impaired small intestinal barrier function, leading to endotoxemia and systemic inflammation. J Nutr. 2003;133(5):1332–8. doi: 10.1093/jn/133.5.1332. [DOI] [PubMed] [Google Scholar]
- 11.Lunn PG. The impact of infection and nutrition on gut function and growth in childhood. Proc Nutr Soc. 2000;59:147–54. doi: 10.1017/S0029665100000173. [DOI] [PubMed] [Google Scholar]
- 12.Humphrey JH. Child undernutrition, tropical enteropathy, toilets, and handwashing. Lancet. 2009;374(9694):1032–5. doi: 10.1016/S0140-6736(09)60950-8. [DOI] [PubMed] [Google Scholar]
- 13.Keusch GT, Rosenberg IH, Denno DM, Duggan C, Guerrant RL, Lavery JV, et al. Implications of acquired environmental enteric dysfunction for growth and stunting in infants and children living in low-and middle-income countries. Food Nutr Bull. 2013;34(3):357–65. doi: 10.1177/156482651303400308. [DOI] [PMC free article] [PubMed] [Google Scholar]
- 14.Korpe PS, Petri WA. Environmental enteropathy: critical implications of a poorly understood condition. Trends Mol Med. 2012;18(6):328–36. doi: 10.1016/j.molmed.2012.04.007. [DOI] [PMC free article] [PubMed] [Google Scholar]
- 15.Prendergast A, Kelly P. Enteropathies in the developing world: neglected effects on global health. Am J Trop Med Hyg. 2012;86(5):756–63. doi: 10.4269/ajtmh.2012.11-0743. [DOI] [PMC free article] [PubMed] [Google Scholar]
- 16.Prendergast AJ, Rukobo S, Chasekwa B, Mutasa K, Ntozini R, Mbuya MNN, et al. Stunting is characterized by chronic inflammation in Zimbabwean infants. John-Stewart GC, editor. PLoS One. 2014;9(2):e86928. doi: 10.1371/journal.pone.0086928. [DOI] [PMC free article] [PubMed] [Google Scholar]
- 17.Bhutta ZA, Das JK, Rizvi A, Gaffey MF, Walker N, Horton S, et al. Evidence-based interventions for improvement of maternal and child nutrition: what can be done and at what cost? Lancet. 2013;382(9890):452–77. doi: 10.1016/S0140-6736(13)60996-4. [DOI] [PubMed] [Google Scholar]
- 18.Palmer C, Bik EM, DiGiulio DB, Relman DA, Brown PO. Development of the human infant intestinal microbiota. PLoS Biol. 2007;5(7):e177. doi: 10.1371/journal.pbio.0050177. [DOI] [PMC free article] [PubMed] [Google Scholar]
- 19.Maynard CL, Elson CO, Hatton RD, Weaver CT. Reciprocal interactions of the intestinal microbiota and immune system. Nature. 2012;489(7415):231–41. doi: 10.1038/nature11551. [DOI] [PMC free article] [PubMed] [Google Scholar]
- 20.Hooper LV. Do symbiotic bacteria subvert host immunity? Nat Rev Microbiol. 2009;7(5):367–74. doi: 10.1038/nrmicro2114. [DOI] [PubMed] [Google Scholar]
- 21.Chung H, Kasper DL. Microbiota-stimulated immune mechanisms to maintain gut homeostasis. Curr Opin Immunol. 2010;22(4):455–60. doi: 10.1016/j.coi.2010.06.008. [DOI] [PubMed] [Google Scholar]
- 22.Tremaroli V, Bäckhed F. Functional interactions between the gut microbiota and host metabolism. Nature. 2012;489(7415):242–9. doi: 10.1038/nature11552. [DOI] [PubMed] [Google Scholar]
- 23.Ghosh TS, Sen Gupta S, Bhattacharya T, Yadav D, Barik A, Chowdhury A, et al. Gut microbiomes of Indian children of varying nutritional status. Zwick ME, editor. PLoS One. 2014;9(4):e95547. doi: 10.1371/journal.pone.0095547. [DOI] [PMC free article] [PubMed] [Google Scholar]
- 24.Monira S, Nakamura S, Gotoh K, Izutsu K, Watanabe H, Alam NH, et al. Gut microbiota of healthy and malnourished children in Bangladesh. Front Microbiol. 2011;2:1–7. doi: 10.3389/fmicb.2011.00228. [DOI] [PMC free article] [PubMed] [Google Scholar]
- 25.Subramanian S, Huq S, Yatsunenko T, Haque R, Mahfuz M, Alam MA, et al. Persistent gut microbiota immaturity in malnourished Bangladeshi children. Nature. 2014;510:417–21. doi: 10.1038/nature13421. [DOI] [PMC free article] [PubMed] [Google Scholar]
- 26.Gupta SS, Mohammed MH, Ghosh TS, Kanungo S, Nair GB, Mande SS. Metagenome of the gut of a malnourished child. Gut Pathog. 2011;3(1):7. doi: 10.1186/1757-4749-3-7. [DOI] [PMC free article] [PubMed] [Google Scholar]
- 27.Smith MI, Yatsunenko T, Manary MJ, Trehan I, Mkakosya R, Cheng J, et al. Gut microbiomes of Malawian twin pairs discordant for kwashiorkor. Science. 2013;339(6119):548–54. doi: 10.1126/science.1229000. [DOI] [PMC free article] [PubMed] [Google Scholar]
- 28.Ridaura VK, Faith JJ, Rey FE, Cheng J, Duncan AE, Kau AL, et al. Gut microbiota from twins discordant for obesity modulate metabolism in mice. Science. 2013;341(6150):1241214. doi: 10.1126/science.1241214. [DOI] [PMC free article] [PubMed] [Google Scholar]
- 29.Goodrich JK, Waters JL, Poole AC, Sutter JL, Koren O, Blekhman R, et al. Human genetics shape the gut microbiome. Cell. 2014;159(4):789–99. doi: 10.1016/j.cell.2014.09.053. [DOI] [PMC free article] [PubMed] [Google Scholar]
- 30.Yatsunenko T, Rey FE, Manary MJ, Trehan I, Dominguez-Bello MG, Contreras M, et al. Human gut microbiome viewed across age and geography. Nature. 2012;486:222–8. doi: 10.1038/nature11053. [DOI] [PMC free article] [PubMed] [Google Scholar]
- 31.Gueimonde M, Laitinen K, Salminen S, Isolauri E. Breast milk: a source of bifidobacteria for infant gut development and maturation? Neonatology. 2007;92(1):64–6. doi: 10.1159/000100088. [DOI] [PubMed] [Google Scholar]
- 32.Martin R, Jimenez E, Heilig H, Fernandez L, Marin ML, Zoetendal EG, et al. Isolation of bifidobacteria from breast milk and assessment of the bifidobacterial population by PCR-denaturing gradient gel electrophoresis and quantitative real-time PCR. Appl Environ Microbiol. 2009;75(4):965–9. doi: 10.1128/AEM.02063-08. [DOI] [PMC free article] [PubMed] [Google Scholar]
- 33.Marcobal A, Sonnenburg JL. Human milk oligosaccharide consumption by intestinal microbiota: human milk oligosaccharide consumption. Clin Microbiol Infect. 2012;18:12–5. doi: 10.1111/j.1469-0691.2012.03863.x. [DOI] [PMC free article] [PubMed] [Google Scholar]
- 34.De Filippo C, Cavalieri D, Di Paola M, Ramazzotti M, Poullet JB, Massart S, et al. Impact of diet in shaping gut microbiota revealed by a comparative study in children from Europe and rural Africa. Proc Natl Acad Sci. 2010;107(33):14691–6. doi: 10.1073/pnas.1005963107. [DOI] [PMC free article] [PubMed] [Google Scholar]
- 35.Wexler HM. Bacteroides: the good, the bad, and the nitty-gritty. Clin Microbiol Rev. 2007;20(4):593–621. doi: 10.1128/CMR.00008-07. [DOI] [PMC free article] [PubMed] [Google Scholar]
- 36.Rogosa M. Acidaminococcus gen. n., Acidaminococcus fermentans sp. n., anaerobic gram-negative diplococci using amino acids as the sole energy source for growth. J Bacteriol. 1969;98(2):756–66. doi: 10.1128/jb.98.2.756-766.1969. [DOI] [PMC free article] [PubMed] [Google Scholar]
- 37.Jumas-Bilak E, Carlier J-P, Jean-Pierre H, Mory F, Teyssier C, Gay B, et al. Acidaminococcus intestini sp. nov., isolated from human clinical samples. Int J Syst Evol Microbiol. 2007;57(10):2314–9. doi: 10.1099/ijs.0.64883-0. [DOI] [PubMed] [Google Scholar]
- 38.Reeds PJ, Burrin DG, Stoll B, Jahoor F. Intestinal glutamate metabolism. J Nutr. 2000;130(4):978S–82. doi: 10.1093/jn/130.4.978S. [DOI] [PubMed] [Google Scholar]
- 39.Burrin DG, Stoll B. Metabolic fate and function of dietary glutamate in the gut. Am J Clin Nutr. 2009;90(3):850S–6. doi: 10.3945/ajcn.2009.27462Y. [DOI] [PubMed] [Google Scholar]
- 40.Beutheu S, Ghouzali I, Galas L, Déchelotte P, Coëffier M. Glutamine and arginine improve permeability and tight junction protein expression in methotrexate-treated Caco-2 cells. Clin Nutr. 2013;32(5):863–9. doi: 10.1016/j.clnu.2013.01.014. [DOI] [PubMed] [Google Scholar]
- 41.Le Bacquer O, Laboisse C, Darmaun D. Glutamine preserves protein synthesis and paracellular permeability in Caco-2 cells submitted to “luminal fasting”. Am J Physiol Gastrointest Liver Physiol. 2003;285:G128–36. doi: 10.1152/ajpgi.00459.2002. [DOI] [PubMed] [Google Scholar]
- 42.Vermeulen M, De Jong J, Vaessen M, van Leeuwen P, Houdijk APJ. Glutamate reduces experimental intestinal hyperpermeability and facilitates glutamine support of gut integrity. World J Gastroenterol. 2011;17(12):11569–73. doi: 10.3748/wjg.v17.i12.1569. [DOI] [PMC free article] [PubMed] [Google Scholar]
- 43.Dai Z-L, Li X-L, Xi P-B, Zhang J, Wu G, Zhu W-Y. l-Glutamine regulates amino acid utilization by intestinal bacteria. Amino Acids. 2013;45(3):501–12. doi: 10.1007/s00726-012-1264-4. [DOI] [PubMed] [Google Scholar]
- 44.Rezaei R, Knabe DA, Tekwe CD, Dahanayaka S, Ficken MD, Fielder SE, et al. Dietary supplementation with monosodium glutamate is safe and improves growth performance in postweaning pigs. Amino Acids. 2013;44(3):911–23. doi: 10.1007/s00726-012-1420-x. [DOI] [PubMed] [Google Scholar]
- 45.Cabrera RA, Usry JL, Arrellano C, Nogueira ET, Kutschenko M, Moeser AJ, et al. Effects of creep feeding and supplemental glutamine or glutamine plus glutamate (Aminogut) on pre- and post-weaning growth performance and intestinal health of piglets. J Anim Sci Biotechnol. 2013;4(1):29. doi: 10.1186/2049-1891-4-29. [DOI] [PMC free article] [PubMed] [Google Scholar]
- 46.Wu M, Xiao H, Ren W, Yin J, Tan B, Liu G, et al. Therapeutic effects of glutamic acid in piglets challenged with deoxynivalenol. te Pas MF, editor. PLoS One. 2014;9(7):e100591. doi: 10.1371/journal.pone.0100591. [DOI] [PMC free article] [PubMed] [Google Scholar]
- 47.Newsholme P, Procopio J, Lima MMR, Pithon-Curi TC, Curi R. Glutamine and glutamate—their central role in cell metabolism and function. Cell Biochem Funct. 2003;21(1):1–9. doi: 10.1002/cbf.1003. [DOI] [PubMed] [Google Scholar]
- 48.Blachier F, Boutry C, Bos C, Tome D. Metabolism and functions of L-glutamate in the epithelial cells of the small and large intestines. Am J Clin Nutr. 2009;90(3):814S–21. doi: 10.3945/ajcn.2009.27462S. [DOI] [PubMed] [Google Scholar]
- 49.Fritz JH. Arginine cools the inflamed gut. Infect Immun. 2013;81(10):3500–2. doi: 10.1128/IAI.00789-13. [DOI] [PMC free article] [PubMed] [Google Scholar]
- 50.Morris SM. Arginine metabolism: boundaries of our knowledge. J Nutr. 2007;137(6):1602S–9. doi: 10.1093/jn/137.6.1602S. [DOI] [PubMed] [Google Scholar]
- 51.Wu G, Bazer FW, Davis TA, Kim SW, Li P, Marc Rhoads J, et al. Arginine metabolism and nutrition in growth, health and disease. Amino Acids. 2009;37(1):153–68. doi: 10.1007/s00726-008-0210-y. [DOI] [PMC free article] [PubMed] [Google Scholar]
- 52.Jefferies H, Bot J, Coster J, Khalil A, Hall JC, McCauley RD. The role of glutathione in intestinal dysfunction. J Invest Surg. 2003;16:315–23. doi: 10.1080/08941930390250214. [DOI] [PubMed] [Google Scholar]
- 53.Roediger WE, BABIDGE W. Human colonocyte detoxification. Gut. 1997;41(6):731–4. doi: 10.1136/gut.41.6.731. [DOI] [PMC free article] [PubMed] [Google Scholar]
- 54.Peterson KM, Buss J, Easley R, Yang Z, Korpe PS, Niu F, et al. REG1B as a predictor of childhood stunting in Bangladesh and Peru. Am J Clin Nutr. 2013;97(5):1129–33. doi: 10.3945/ajcn.112.048306. [DOI] [PMC free article] [PubMed] [Google Scholar]
- 55.Buckel W, Barker HA. Two pathways of glutamate fermentation by anaerobic bacteria. J Bacteriol. 1974;117(3):1248–60. doi: 10.1128/jb.117.3.1248-1260.1974. [DOI] [PMC free article] [PubMed] [Google Scholar]
- 56.Ezaki T, Kawamura Y, Li N, Li Z-Y, Zhao L, Shu S. Proposal of the genera Anaerococcus gen. nov., Peptoniphilus gen. nov. and Gallicola gen. nov. for members of the genus Peptostreptococcus. Int J Syst Evol Microbiol. 2001;51(4):1521–8. doi: 10.1099/00207713-51-4-1521. [DOI] [PubMed] [Google Scholar]
- 57.Fisher CK, Mehta P. Identifying keystone species in the human gut microbiome from metagenomic timeseries using sparse linear regression. White BA, editor. PLoS One. 2014;9(7):e102451. doi: 10.1371/journal.pone.0102451. [DOI] [PMC free article] [PubMed] [Google Scholar]
- 58.Berry D, Widder S. Deciphering microbial interactions and detecting keystone species with co-occurrence networks. Front Microbiol. 2014;5:1–14. doi: 10.3389/fmicb.2014.00219. [DOI] [PMC free article] [PubMed] [Google Scholar]
- 59.Duran-Pinedo AE, Paster B, Teles R, Frias-Lopez J. Correlation network analysis applied to complex biofilm communities. Gilbert JA, editor. PLoS One. 2011;6(12):e28438. doi: 10.1371/journal.pone.0028438. [DOI] [PMC free article] [PubMed] [Google Scholar]
- 60.Hajishengallis G, Darveau RP, Curtis MA. The keystone-pathogen hypothesis. Nat Rev Microbiol. 2012;10(10):717–25. doi: 10.1038/nrmicro2873. [DOI] [PMC free article] [PubMed] [Google Scholar]
- 61.Mills LS, Doak DF. The keystone-species concept in ecology and conservation. Bioscience. 1993;43(4):219–24. doi: 10.2307/1312122. [DOI] [Google Scholar]
- 62.Cottee-Jones HEW, Whittaker RJ. Perspective: the keystone species concept: a critical appraisal. Front Biogeogr. 2012;4(3):117–27. [Google Scholar]
- 63.Pop M, Walker AW, Paulson J, Lindsay B, Antonio M, Hossain MA, et al. Diarrhea in young children from low-income countries leads to large-scale alterations in intestinal microbiota composition. Genome Biol. 2014;15(6):R76. doi: 10.1186/gb-2014-15-6-r76. [DOI] [PMC free article] [PubMed] [Google Scholar]
- 64.Habiba, Berger-Wolf T. Working for influence: effect of network density and modularity on diffusion in networks. 2014 Sep 29 [cited 2014 Sep 29]; Available from: http://compbio.cs.uic.edu/~habiba/Spread_structure_DamNet2011_final_1013.pdf.
- 65.Yamaguchi K. The flow of information through social networks: diagonal-free measures of inefficiency and the structural determinants of inefficiency. Soc Networks. 1994;16(1):57–86. doi: 10.1016/0378-8733(94)90011-6. [DOI] [Google Scholar]
- 66.Friedman J, Alm EJ. Inferring correlation networks from genomic survey data. PLoS Comput Biol. 2012;8(9):e1002687. doi: 10.1371/journal.pcbi.1002687. [DOI] [PMC free article] [PubMed] [Google Scholar]
- 67.World Health Organization, United Nations Children’s Fund. WHO child growth standards and the identification of severe acute malnutrition in infants and children: a joint statement by the World Health Organization and the United Nations Children’s Fund [Internet]. World Health Organization (WHO); 2009. Available from: http://apps.who.int/iris/handle/10665/44129. [PubMed]
- 68.Segata N, Waldron L, Ballarini A, Narasimhan V, Jousson O, Huttenhower C. Metagenomic microbial community profiling using unique clade-specific marker genes. Nat Methods. 2012;9(8):811–4. doi: 10.1038/nmeth.2066. [DOI] [PMC free article] [PubMed] [Google Scholar]
- 69.Dixon P. VEGAN, a package of R functions for community ecology. J Veg Sci. 2003;14(6):927–30. doi: 10.1111/j.1654-1103.2003.tb02228.x. [DOI] [Google Scholar]
- 70.Carlin JB. Regression models for twin studies: a critical review. Int J Epidemiol. 2005;34(5):1089–99. doi: 10.1093/ije/dyi153. [DOI] [PubMed] [Google Scholar]
- 71.Friedman J, Hastie T, Tibshirani R. Sparse inverse covariance estimation with the graphical lasso. Biostatistics. 2008;9(3):432–41. doi: 10.1093/biostatistics/kxm045. [DOI] [PMC free article] [PubMed] [Google Scholar]
- 72.Newman M. Networks: an introduction. New York, USA: Oxford University Press; 2010. [Google Scholar]
- 73.Csardi G, Nepusz T. The igraph software package for complex network research. InterJournal Complex Syst [Internet]. 2006 [cited 2014 Sep 29];1695(5). Available from: http://www.necsi.edu/events/iccs6/papers/c1602a3c126ba822d0bc4293371c.pdf.
- 74.Sjölander A, Frisell T, Öberg S. Causal interpretation of between-within models for twin research. Epidemiol Methods [Internet]. 2012 Jan 29 [cited 2014 Aug 4];1(1). Available from: http://www.degruyter.com/view/j/em.2012.1.issue-1/2161-962X.1015/2161-962X.1015.xml.
- 75.Halekoh U, Højsgaard S, Yan J. The R package geepack for generalized estimating equations. J Stat Softw. 2006;15(2):1–11. [Google Scholar]
- 76.Benjamini Y, Hochberg Y. Controlling the false discovery rate: a practical and powerful approach to multiple testing. J R Stat Soc Ser B Methodol. 1995;57(1):289–300. [Google Scholar]