


Abstract
Cancer-associated somatic mutations outside protein-coding regions remain largely unexplored. Analyses of the TERT locus have indicated that non-coding regulatory mutations can be more frequent than previously suspected and play important roles in oncogenesis. Using a computational method called SASE-hunter, developed here, we identified a novel signature of accelerated somatic evolution (SASE) marked by a significant excess of somatic mutations localized in a genomic locus, and prioritized those loci that carried the signature in multiple cancer patients. Interestingly, even when an affected locus carried the signature in multiple individuals, the mutations contributing to SASE themselves were rarely recurrent at the base-pair resolution. In a pan-cancer analysis of 906 samples from 12 tumor types, we detected SASE in the promoters of several genes, including known cancer genes such as MYC, BCL2, RBM5 and WWOX. Nucleotide substitution patterns consistent with oxidative DNA damage and local somatic hypermutation appeared to contribute to this signature in selected gene promoters (e.g. MYC). SASEs in selected cancer gene promoters were associated with over-expression, and also correlated with the age of onset of cancer, aggressiveness of the disease and survival. Taken together, our work detects a hitherto under-appreciated and clinically important class of regulatory changes in cancer genomes.
INTRODUCTION
Today the catalog of cancer gene mutations is approaching near-saturation (1), and yet oncogenic mutations in non-coding regions, which cover ∼98% of the genome and harbor major regulatory elements (2), remain mostly uncharted. TERT promoter mutations have demonstrated that non-coding oncogenic mutations could be as common as the classic cancer gene mutations (3,4), and a thorough assessment of such mutations could lead to new directions in cancer diagnosis, patient stratification and therapies (5). There is increasing evidence for functional mutations in non-coding regions with regulatory consequences (6–8). More recently, large-scale genomics approaches have identified recurrent, non-coding mutations affecting regulation of genes such as TERT (3,4,9), SDHD (10) and CLPTM1L (controlled by TERT promoter mutations) (11) in melanoma.
Even though recurrent cancer mutations have received major attention so far, oncogenic mutations need not always be recurrently detected at the same base position in multiple samples (e.g. TP53 oncogenic mutations are distributed throughout the locus (12)), and we argue that non-coding mutations are no exceptions. Clusters of cancer mutations can be indicative of accelerated somatic evolution in the tumor genome, perhaps due to context-dependent mutagenesis and/or selection. Mutations that lead to loss-of-function of tumor suppressor elements or create novel regulatory elements (e.g. super-enhancers) driving oncogenic expression are expected to be positively selected during tumorigenesis. Importantly, similar signatures have been detected in human genome evolution, where human accelerated regions (HARs) acquired significantly more substitutions than expected after divergence from the common ancestor with chimpanzees (13), and those were associated with regulatory functions and potentially contributed to human-specific attributes (13–15). Currently available methods, which aim to detect recurrent mutations, are not tailored to detect the signature of accelerated somatic evolution in cancer genomes. Therefore, we developed a novel computational approach called SASE-hunter to identify regulatory elements with cancer-associated signatures of accelerated somatic evolution (SASE). SASE-hunter searches for genomic regions with a significantly higher abundance of somatic mutations in a genomic element (e.g. gene promoters) than that expected by chance and prioritizes those loci that carry the signature in multiple cancer patients. We analyzed 906 completely sequenced cancer genomes from multiple cancer types with SASE-hunter to address the following questions. (i) How frequently are the signatures of accelerated somatic evolution detected in non-coding regulatory regions such as gene promoters? Availability of gene expression and clinical data for the same samples, as well as emerging evidence for regulatory driver mutations in gene promoters motivated us to focus on the gene promoters. (ii) Do these promoters show signatures of distinct mutagenic processes? (iii) What is the regulatory and clinical relevance of this signature in cancer?
MATERIALS AND METHODS
Data sets
We obtained genome-wide somatic mutation data for 849 samples of 10 different tumor types from the International Cancer Genome Consortium (ICGC) (16), 32 lung adenocarcinoma samples from the TCGA (17), and also 25 metastatic melanoma samples from Berger et al. (18); each cohort had at least 10 samples. Typically tumor and matched normal genomes in the ICGC and TCGA cohorts were sequenced using Illumina GAIIx at a depth of 30X or higher. The majority of the melanoma samples were metastases from melanomas originating from hair-bearing skin. Tumor samples ME015 and ME032 were obtained from cutaneous melanoma metastases originating from hairless skin and a clinical history of chronic ultraviolet light exposure resulted in the primary melanoma, ME009. Tumor and matched peripheral blood samples from the same patients were sequenced at high depth (for 5 cases 30X and 30X haploid coverage for tumor and matched normal, respectively, using Illumina GAIIx, and for the remaining 20 cases, 65X and 32X haploid coverage, respectively, using Illumina HiSeq2000). Taken together, our Pan-cancer data set included 14 cohorts, representing 906 samples from 12 different cancer types. There were over 16 million somatic mutations in the combined data set. The number of somatic mutations per sample varied by orders of magnitude within and between cancer types. In addition, for validation purposes, we used data from another lymphoma study that performed whole genome sequencing of 40 de novo lymphoma cases at median coverage of 33.9X (19).
Identification of genomic regions carrying SASE
We considered several issues while identifying genomic regions carrying SASE. First, mutation burden varies between cancer types, and also between samples within the same tumor type. Even within a sample, mutation detection rate (per Mb) varies throughout the genome due to GC content, chromatin, replication timing pattern etc (20,21). Therefore, we decided to compare the mutation burden in the seed region to a locally constructed null model calculated based on mutation frequency in the genomic neighborhood (e.g. flanking regions (22,23)) for the same sample(s) Second, even within a region, genomic context can affect DNA damage, repair processes and selection, thereby modulating mutational landscape (24). For instance, in protein coding regions evolutionary constraints on the first two bases in a codon are typically much higher than that on the third base. Furthermore, repetitive regions have increased incidence of polymerase slippage-related mutations. Therefore, even within the seed region and its flanking regions, we decided to exclude islands of dissimilar genomic elements (e.g. exons and repetitive regions were excluded while searching for SASE in promoters). Third, the choice of parameters (e.g. seed regions, size of flanks), constraints and statistical tests depends on the problem at hand. Therefore we decided that the tool should be fast, versatile, have a programmatic interface and able to accommodate user-specified needs. The computational framework, reported here, dubbed SASE-hunter (Signatures of Somatic Evolution-hunter), written in Python 2.7, meets the above requirements. SASE-hunter accepts (i) a bed or VCF file containing the genomic co-ordinates of the somatic mutations, (ii) a bed file listing candidate genomic regions, (iii) the window size for flanking regions (default: ±20 kb of the candidate region), (iv) the choice for statistical test (permutation or Fisher's exact test; default: Fisher's exact test) and (v) a bed file containing allowable genomic segments from which seed and flanking regions can be included (or excluded) as inputs. Filtered seed regions are the segment(s) of candidate genomic regions that overlap with the allowable segments, while the filtered flanking regions are the allowable, neighboring segments of the filtered seed regions within the given window. For each filtered seed region, statistical significance of enrichment of somatic mutations in the filtered region, relative to that in the filtered flanking region is estimated using permutation or Fisher's exact test. Permutation P-values were similar to that obtained by Fisher's exact test, but opened up the possibility for more complex, user-defined randomization strategies. For each genomic region (e.g. promoter) P-values from each sample were combined using Fisher's method in order to determine significance of the promoter across all samples. User-guide and example files for SASE-hunter are provided at http://www.sjdlab.org/resources.
Identification of promoters under accelerated evolution in tumor genomes
We obtained the list of all known, protein-coding genes from the Ensembl-v75 (human genome: hg19), chose their respective longest transcripts and defined their promoters as 5 kb upstream to 1 kb downstream of the predicted transcription start sites. We chose the flanking regions to be within the ±20 kb of the promoter regions. This window was narrow enough to have comparable genomic context as the seed region (promoter), and yet large enough to have sufficient number of mutations for meaningful statistical analysis. For validation purposes, P-values were also generated with variable flanking region sizes (40 kb and 100 kb; Supplementary Table S1). Within the seed and flanking regions, we carefully chose the Tier-II+III genomic regions (Tier-II: non-coding, conserved and non-repetitive; Tier-III: non-coding, non-conserved and non-repetitive), which are non-coding and non-repetitive, as allowable, filtered regions and excluded exons and repetitive regions (Tier-I and IV, respectively). For each tumor sample, we overlaid the somatic mutations on the filtered seed and flanking regions, and computed statistical significance of the enrichment using permutation and/or Fisher's test. P-values were FDR adjusted. Mutations in individual samples were acquired independently, and therefore, P-values from multiple samples were combined using Fisher's method in order to determine the overall statistical significance for each promoter.
Conservation and functional genomic Analysis
Functional elements are typically conserved over evolution, and mutations that occurred at evolutionarily conserved positions might be functionally more relevant than those at other positions in the genome. We downloaded base-by-base multi-species evolutionary conservation, as quantified by the GERP++ rejected substitution (RS) score (25), for the entire hg19 human genome. We repeated SASE analyses after masking the base positions in the allowable regions that were highly divergent during evolution (GERP score ≤ 5, 3, 1), and found consistent results (Supplementary Table S2). DNase hyper-sensitivity, chromatin, transcription factor binding sites determined by ChIP-seq experiments in multiple human cell lines was downloaded from the ENCODE database (human genome reference: hg19) (2).
Expression and clinical data analysis
Eight of the cohorts in our study also had gene expression data (RNAseq) available. Individual cohorts covered between 20 502 and 55 889 transcript isoforms. Normalized read counts were expressed as counts per million for the lymphoma cohort. For each SASE signature, we grouped the samples, which had SASE at a given promoter and those that did not. We then compared expression levels (normalized read counts) of the corresponding genes between the two groups using a Mann–Whitney test. Clinical data including age, tumor stage and survival for the cohorts were downloaded from the respective repositories. Many cancer types did not have survival data (e.g. Melanoma cohort (18)), while some other cancer types (e.g. lymphoma (16)) had good prognosis, and most of the patients were alive during the time of data-freeze. We applied correction for multiple testing wherever applicable.
RESULTS
SASE-hunter—a framework for detecting signatures of accelerated somatic evolution
We developed SASE-hunter to identify genomic regions carrying signatures of accelerated somatic evolution (SASE) in cancer (see Methods for details; Figure 1A). In brief, it detects the genomic segments that acquired a significant excess of somatic mutations compared to that expected by chance based on a locally constructed null model, and it prioritizes those that are detected in multiple samples in the same cohort. We further integrated expression data to evaluate their regulatory consequences. We note three important attributes of the framework, which allow it to account for technical biases and distinct functional constraints in different parts of the genome.
Figure 1.
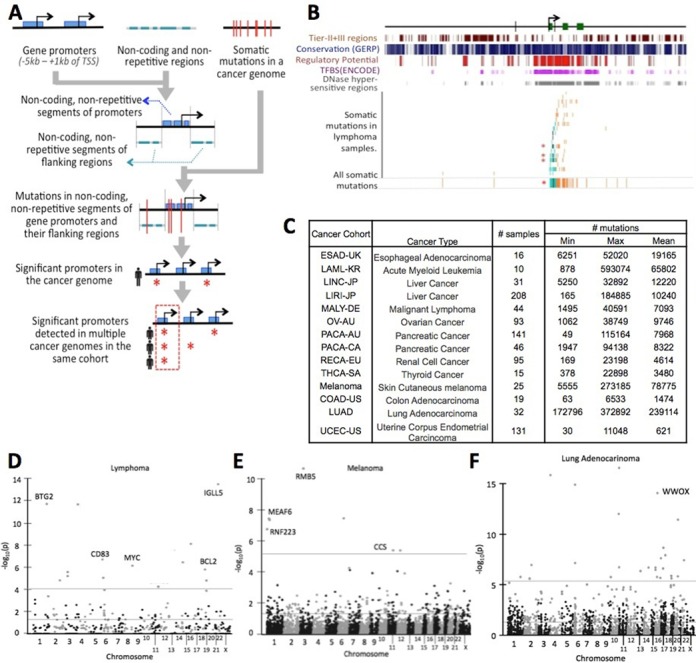
Summary of the approach and results. (A) A schematic representation showing SASE-hunter analysis pipeline. (B) Mutational landscape around MYC promoter together with additional evolutionary and functional annotations. Mutations in Tier-II+III regions of predicted promoters (5 kb upstream to 1 kb downstream of transcription start site) are shown in gray, those in Tier-I+IV regions of predicted promoters are shown in cyan. The mutations in Tier-II+III regions in the flanks are shown in orange. (C) A summary of the data set used in this analysis. Manhattan plot showing significant gene promoters in (D) lymphoma and (E) melanoma samples and (F) lung adenocarcinoma. The two horizontal lines show uncorrected P-value threshold of 0.05 and also that corresponding to FDR adjusted P-value threshold of 0.05 in respective cohorts. The genes deemed significant after FDR correction and also show abnormal expression or clinical relevance are highlighted. Complete list of the significant genes is provided in Supplementary Table S1.
First, we adopted a sample-by-sample analysis approach for two reasons: mutation burden varies by orders of magnitude between patients (26), and in a pooled analysis, a small number of samples with excessive mutation burden could potentially bias the overall trend; furthermore cancer is a heterogeneous disease, and signatures arising from genetic profiles of a subset of the patients might not always be apparent when pooled across the entire cohort.
Second, we implemented a local null model using a subsampling approach for genomic inference. Mutation rates vary between distal genomic regions depending on replication timing, genomic and epigenomic contexts, and such variations may not be similar between individuals due to differences in the epigenetic makeup of their tumors (20,21,27). In addition, some genomic regions have poor sequencing coverage (e.g. centromeres) and hence can show artificial depletion in reported mutations. It is non-trivial to include all covariates in an explicit model. In contrast, a locally constructed null model can accommodate these issues implicitly.
Lastly, we made provisions to explicitly define additional constraints. For instance, in the protein-coding regions, substitutions in the third bases of the codons are more easily accommodated compared to that in the first two bases; moreover repetitive regions show distinct mutational patterns arising from polymerase-slippage. Therefore, while identifying SASE in non-repetitive, non-coding regions in gene promoters, we masked coding bases as well as repetitive sequences within the promoter regions.
SASE-hunter is implemented in Python. The framework allows a user to choose the target regions (e.g. gene promoters), specify the size of the genomic neighborhood for subsampling approach, define the excluded regions and detect statistical significance using permutation or Fisher's test (see Methods for details).
Detecting signatures of accelerated somatic evolution in gene promoters in pan-cancer data set
We analyzed mutation data for 14 cohorts, representing 906 samples from 12 different cancer types using SASE-hunter (Figure 1B). Availability of multi-platform data for the same samples, as well as emerging evidence for regulatory driver mutations motivated us to focus on the gene promoters. Visualization of mutational landscape indicated that many genomic regions had mutation clusters (e.g. MYC promoter region, Figure 1C). Using SASE-hunter, we interrogated the predicted promoters (-5 kb to +1 kb of transcription start site) of the primary transcript of known protein-coding genes, and identified those with SASE in ≥3 cancer patients (>2% of patients) in a cancer cohort. A summary of the results is provided in Table 1 and Supplementary Table S1 while we discuss representative cases below. For the significant genes detected by SASE-hunter, we found consistent results when we used alternative window sizes, filtered the mutations at base-positions with low evolutionary conservation, or pooled the samples in the cohort (Supplementary Tables S2–S4). The number of samples available was insufficient to survey all non-coding elements in the genome in an unbiased manner for SASE, and detect meaningful statistical significance after correction for multiple testing.
Table 1. Selected genes that carried signatures of accelerated evolution in the promoters.
| Genes | Position | Cancer type | Cohort (total samples) | # samples with significant SASE | FDR adjusted P-value |
|---|---|---|---|---|---|
| BTG2 | chr1:203274619:203278730:+1 | Malignant Lymphoma | MALY-DE (44) | 4 | 9.29E-10 |
| TCL1A | chr14:96176304:96180533:-1 | Malignant Lymphoma | MALY-DE (44) | 4 | 7.88E-05 |
| MYC | chr8:128747680:128753674:+1 | Malignant Lymphoma | MALY-DE (44) | 3 | 1.35E-04 |
| BCL2 | chr18:60790579:60987361:-1 | Malignant Lymphoma | MALY-DE (44) | 5 | 2.60E-04 |
| CD83 | chr6:14117872:14137149:+1 | Malignant Lymphoma | MALY-DE (44) | 3 | 1.07E-03 |
| RBM5 | chr3:50126341:50156454:+1 | Melanoma | Melanoma (25) | 7 | 3.07E-07 |
| WWOX | chr16:78133310–79246564:1 | Lung Adenocarenoma | LUAD (32) | 4 | 7.30E-04 |
| CCDC168 | chr13:103381801:103389159:-1 | Colon cancer | COAD-US (19) | 4 | 1.04E-04 |
| CCDC168 | chr13:103381801:103389159:-1 | Endometrial cancer | UCEC-US (131) | 4 | 1.64E-08 |
Only those cases that are found in multiple cancer types, show associated gene expression changes, or clinical attributes are listed. The complete catalog of genes carrying signatures of accelerated evolution in the promoter are shown in Supplementary Table S1.
In the ICGC malignant lymphoma cohort (16), SASE-hunter detected evidence for accelerated somatic evolution in the promoters of 10 genes (FDR-corrected P-value ≤ 0.05; present in ≥3 samples; Figure 1D; Supplementary Table S1), several of which play important roles in hematopoiesis and/or tumor development. For instance, BCL2 and MYC are master regulators of hematopoietic differentiation and major cancer genes in lymphoma (28). BTG2 has anti-proliferative properties and is involved in the regulation of the cell cycle G1/S transition (29); its overexpression is correlated with increased migration and poor clinical prognosis in bladder cancer (30). TCL1 has been implicated in human T cell leukemias (31). CD83 and IGLL5 are broadly expressed in hematopoietic cell types. Moreover, the majority of identified SASE targets in lymphomas were genes previously shown to be targets of somatic hypermutation (SHM) by the member of Apobec family of proteins AICDA (also known as AID) (32). AID-dependent SHM in non-Ig genes has been shown to be a pivotal lymphomagenic event through several mechanisms: transcriptional deregulation, induction of dsDNA breaks as a result of DNA repair, induction of translocations and possibly even deaminase-dependent DNA demethylation (reviewed in (33)). AID has been shown to be required for bcl-6 dependent lymphomagenesis in in vivo mouse models (34). Somatic mutations in these gene promoters were spatially clustered, although did not necessarily occur recurrently at the same base-positions in multiple samples—indicating that their signature could not be detected using base-pair-level recurrence as the primary selection criterion. For instance, the BCL2 promoter contained mutations at 64 locations of which only 4 occurred in multiple samples. This signature was observed in the MYC promoter as well, which contained mutations at 51 positions 48 of which were unique. We note that translocations involving cancer genes (e.g. MYC, BCL2) are common in lymphoma samples; but no sample had SASE and translocation breakpoints in the same gene promoter (or even within 50 kb region), except a single case involving MYC.
In the melanoma cohort (18) SASE-hunter identified four significant gene promoters (MEAF6, RNF223, RBM5 and CCS; FDR-corrected P-value ≤ 0.05; present in ≥3 samples; Figure 1E and Supplementary Table S2). Of them, RBM5, which had SASE in 7 of the 25 samples, is a known tumor suppressor gene that inhibits cell growth and induces apoptosis in multiple cancer types (35,36). MEAF6 is a nuclear protein involved in transcriptional activation and a component of the HBO1 acetyl-transferase complex, which is involved in regulation of cell proliferation (37). Once again, majority of the promoter mutations in these cases were spatially clustered, but did not show base-pair-level recurrence. In the lung cancer cohort, we detected several additional cases (FDR-corrected P-value ≤ 0.05; present in ≥3 samples; Figure 1F and Supplementary Table S1) including WWOX, which is a known tumor suppressor gene; moreover, SASE in WWOX promoter was associated with corresponding decrease in its expression (discussed below). The number of gene promoters with SASE in other cohorts was small. We found SASE in the promoter of CCDC168 in multiple samples in colon cancer (COAD) as well as endometrial cancer (UCEC) cohorts (Supplementary Figure S1).
We extended the analysis to investigate promoters for all known transcripts of protein coding genes in all cancer cohorts and recorded the most significant transcript (FDR-corrected P-value ≤ 0.05; present in ≥3 samples; Supplementary Table S5). Of them, MTA1, which had SASE in 3 of 25 samples, is an emerging target for gene therapy (38); over-expression is associated with higher risk of metastasis in melanoma (39). As a subunit of the condesin II complex, NCAPD3 plays a role in mitotic chromosome assembly and segregation (40). Expression of the gene has also been used as a marker for a prostate cancer subtype (41). Once again, several of these genes were known to be associated with cancer-related pathways (e.g. CIITA).
For validation purposes, we used data from a second lymphoma study that performed whole genome sequencing of 40 de novo lymphoma samples (19). We identified samples that had somatic mutations in the promoters of genes such as BCL2 and TCL1A, but none in the corresponding flanking regions (Supplementary Table S6). The small number of somatic mutation calls within the promoter and flanking regions precluded statistical test, but the results were consistent even when we used 20 kb or 100 kb flanking windows for this analysis. Furthermore, we detected statistical significant SASE in the promoter of MTA1 (FDR-corrected P-value ≤ 0.05; present in 6 samples), which was identified in the melanoma cohort previously.
Taken together, SASE-hunter identifies signatures of accelerated somatic evolution that were not apparent in conventional approaches based on base-pair level recurrence. In addition, the overlap between SASE clusters and previously identified hotspots of somatic hyper-mutation in lymphomas serves as an internal validation for our novel algorithm. Our key results remained consistent even when we used alternative cut-offs for genomic neighborhood, filtered the mutations at base-positions with low evolutionary conservation, or pooled the samples in the cohort (Supplementary Tables S2–S4), suggesting that the signature is robust to analysis choices. Thus it is not surprising that, several of these loci detected by SASE-hunter in multiple samples have already been implicated in cancer, underscoring clinical relevance of this previously unrecognized mutational signature.
Mutational signatures
Overall, nucleotide substitution patterns in the promoters differed considerably between tumor tissue types, perhaps due to tissue-specific environmental exposures and mutagenic processes. And yet, there were some tissue-invariant trends. For instance, G:C>A:T substitution was more frequent in the gene promoters, relative to that observed elsewhere in the genome, and this trend was consistent across cohorts. Only a subset of these mutations was associated with CpG sites.
Nucleotide substitution patterns in the promoters with significant SASE were diverse, but some common signatures emerged. In the lymphoma samples, all significant promoters had enrichment for C:G>G:C substitutions (relative to the substitution patterns observed for all other promoters, and also compared to genome-wide substitution patterns; Figure 2A). Oxidative lesion products of guanine and 8-oxoG (e.g. imidazolone, guanidinohydantoin and spiroiminodihydantoin) are known to cause C:G>G:C substitution (42,43), but we cannot rule out the effects of other mutagenic processes and context dependent selection during oncogenesis (we examine functional consequences in the next sections). In contrast, some other substitutions such as T:A>G:C were less common in these significant promoters (perhaps due to low AT content of promoter regions). Overall, C:G>T:A and C:G>G:C accounted for 50% or more of substitutions in the significant promoters. Lung cancer samples had more variations in substitution patterns between the promoters carrying SASE, but C:G>A:T substitutions, which are indicative of oxidative DNA damage (e.g. due to smoking or environmental exposure) were relatively more common compared to that in the other cohorts (Supplementary Figure S3).
Figure 2.
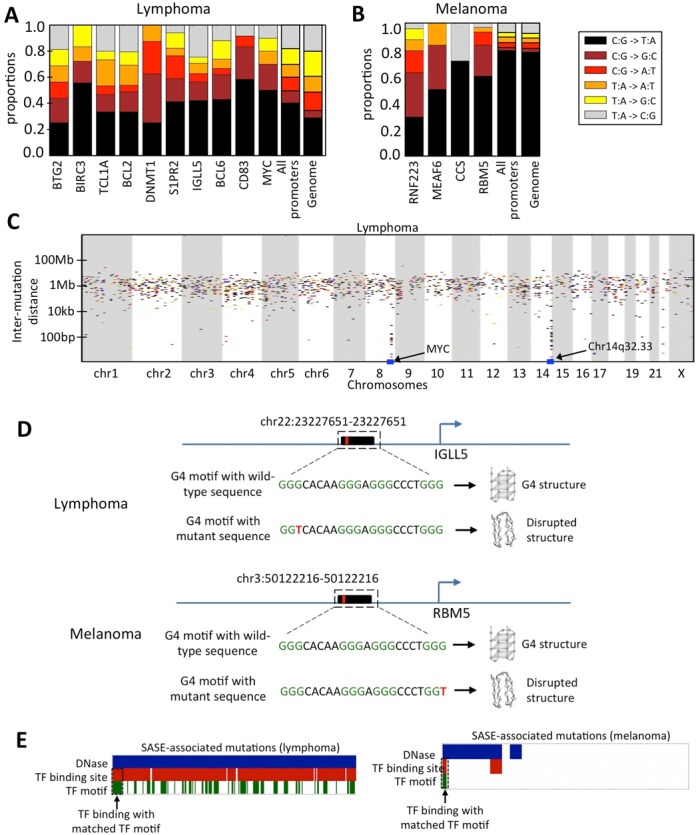
Genomic context of SASE. Nucleotide substitution patterns in the gene promoters that had signatures of accelerated somatic evolution, contrasted against that observed in all gene promoters and also in the completely sequenced genomes for (A) Lymphoma and (B) Melanoma cohort. Examples of somatic mutations overlapping with G4 motifs in representative lymphoma and melanoma samples. (C) Rain-drop plot showing kataegis in the selected gene promoters in the lymphoma cohort. (D) Representative samples showing SASE-associated mutations in the stem regions of G4 motifs. (E) SASE-associated mutations overlap functional elements within promoters such as DNase hypersensitive sites, ChIP-seq transcription factor binding sites and transcription factor binding motifs. The overlapping mutations are highlighted.
UV exposure-related increase in the burden of C:G>T:A substitution is a hallmark of melanoma genomes (18); gene promoters in this cohort also had high proportions of C:G>T:A substitutions. However, the significant promoters had proportionally less G:C>A:T substitutions, compared to other promoters in this cohort (Figure 2B). On the other hand, proportionally excess of C:G>G:C substitutions were also observed in three of four significant promoters in this cohort, which is similar to that observed in the lymphoma cohort as well. An excess of C:G>G:C substitutions in the SASE in multiple cohorts indicated a role of transcription-coupled or context-dependent mutagenic and repair processes.
We then set out to investigate if the significant signatures of accelerated promoter evolution were associated with a specific pattern of localized hypermutation driven by AID/APOBEC cytosine deaminase, known as kataegis. We scanned the tumor genomes using the kataegis definition provided by Lawrence et al. (26) (stretches of at least six mutations having inter-mutation distances at least two standard deviations smaller than the sample median) and marked the regions that show this pattern. In the lymphoma cohort, signatures of kataegis and SASE overlapped on the MYC promoter in 2 of the 3 significant samples (Figure 2C); none of these samples had MYC translocations. We also found additional kataegis patterns, including one in chr14q32.33, close to a non-coding gene cluster. This kataegis signature was present in a majority of the lymphoma samples, and overlapped SASE in the promoters of microRNAs and pseudogenes. Furthermore, these instances had frequent C:G>T:A and C:G>G:C substitutions, the footprints of kataegis. Evidence for a role of kataegis in SASE is reported here for the first time, and yet, it is not totally unexpected. Even other promoters that had SASE, but did not satisfy the published definition of kataegis (26), carried an excess of C:G>G:C substitutions, raising the possibility that AID/APOBEC cytosine deaminase or similar enzymes might be involved in those cases as well.
Some classes of non-B-DNA motifs are mutagenic, and in both the lymphoma and melanoma samples ∼10% mutations in the promoters overlapped with such motifs at the base-pair resolution. Representative examples are shown in Figure 2D. But SASE-associated promoters did not show significant enrichment for overlap with such motifs. SASE-associated mutations were three times more likely to be G4-proximal (within ±200 bp) than others (FDR adjusted P-value: >0.05), which is consistent with the reports that G4s are mutagenic, and therefore G4-proximal regions have an excess of mutations. In contrast, some other motifs such as small tandem repeats were depleted (FDR adjusted P-value < 0.05).
Overlap with regulatory elements in promoters and gene expression changes
Overlaying transcription factor binding site and DNase hypersensitivity data, we assessed whether somatic mutations in these samples could potentially affect transcriptional regulation of gene expression. We focused on the known cancer genes for this analysis. Some of the SASE-associated mutations overlapped DNase hypersensitive sites, and transcription factor binding sites determined by ChIPseq and position-weight matrix (Figure 2E). For instance, somatic mutations in the MYC promoter in the samples (which had SASE in MYC promoters) were spatially clustered, mostly downstream of the transcription start site; several of those clusters overlapped binding sites for several different transcription factors and also DNase hypersensitive sites in multiple ENCODE cell lines. Position weight matrix calculations indicate that the somatic mutations have the potential to modulate transcription factor DNA interactions at these sites. Clusters of somatic mutations in the BCL2 promoter were primarily just upstream of the transcription start site, and overlapped multiple transcription factor binding sites as well as DNase hypersensitive sites in multiple ENCODE cell lines. In most of the cases, the transcription factor binding sites were partially overlapping and somatic mutations occurred in the overlapping regions. In addition, we found that several SASE-associated mutations overlapped G4 motifs (e.g. lymphoma: IGLL5 promoter in 2 samples; melanoma: RBM5 promoter in 4 samples; Figure 2D); all these mutations were in the G4-stem and therefore predicted to disrupt the G4 structure. G4 structures are known to have regulatory potential, and perturbation of such structures can alter expression of the target gene (44). Furthermore, a considerable proportion of the promoter mutations were transversions, which can indirectly affect local DNA accessibility and chromatin landscape by changing DNA bending preference, chromatin structure and transcriptional accessibility.
Gene expression data were available for a subset of the cohorts we analyzed for SASE, allowing us to investigate whether promoter SASE were associated with consistent changes in gene expression. Integrating expression data for the lymphoma samples, we found that the samples with SASE in the BCL2 promoter had significantly higher BCL2 expression (Mann Whitney test; P-value: 1.59E-02; Figure 3A, Supplementary Figure S2) compared to other samples. The potential functional implication of SASE in BCL2 promoter is apparent on further analysis: SASE overlapped with multiple, predicted binding sites of transcription factors like p65 and insulator element CTCF (Supplementary Figure S2). Inability of these factors to bind DNA and properly regulate transcription of associated genes has been experimentally linked to lymphomagenesis (45–47). In addition, the samples with SASE in MYC (P-value: 4.68E-02; Figure 3B) and CD83 (P-value: 1.43E-02; Figure 3C) promoters were also associated with an increase in expression of these genes, respectively. In the lung cancer cohort, SASE in WWOX promoter was associated with a corresponding decrease in its expression (P-value: 0.014; Figure 3D). Some other cohorts (e.g. melanoma) did not have expression data. Nevertheless, over-expression of the target oncogenes lymphoma and lung cancer cohorts was noteworthy. Even though we refrain from inferring causality from correlation, our findings raise a testable hypothesis that these mutations facilitated oncogenic activation and therefore were selected for. In any case, significant association between SASE in promoters and expression changes suggests that SASE-like patterns might be biologically and clinically important.
Figure 3.
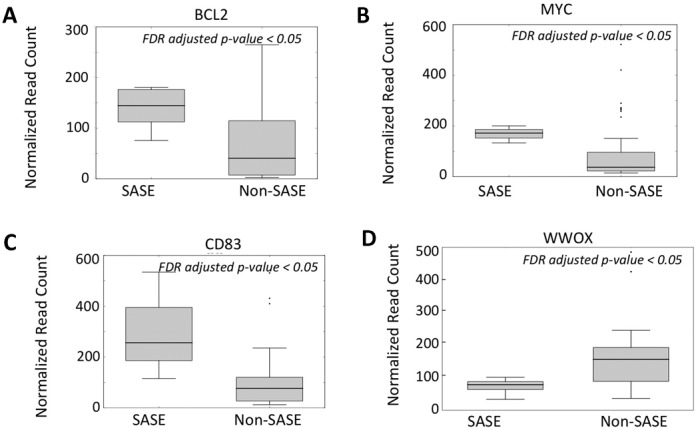
Regulatory significance of SASE. (A) Boxplot showing mRNA expression difference for BCL2 between the samples that have signatures of accelerated somatic evolution in the promoters of BCL2 and other samples in the lymphoma cohort. P-value computed using Mann Whitney U test is shown at the top right corner. (B) and (C) show the similar results for MYC and CD83 respectively in the lymphoma cohort. (D) Boxplot showing mRNA expression difference for WWOX between the samples that have signatures of accelerated somatic evolution in the promoters of WWOX and other samples in the lung adenocarcinoma cohort.
Association with clinical outcomes
Next, we assessed whether SASE was associated with clinical features. We focused on the known cancer genes for this analysis. Some of the cancer types such as lymphoma typically have good prognoses, and a vast majority of the patients were alive at the time of data freeze; therefore survival analysis was not an option. The patients with mutations in the region presenting with SASEs in the MYC promoter were significantly younger (median 12 years) compared to others (median 51 years, Mann–Whitney P-value: 3.6E-02; Figure 4A). In contrast, those with SASEs in the BCL2 promoter were significantly older (median 54 years versus 17.5 years, Mann Whitney P-value: 7.0E-04; Figure 4B). Interestingly, SASE in the promoters of BCL2, TCL1A, or BTG2 was associated with poorer clinical outcome (relapse or partial remission as opposed to complete remission; FDR adjusted P-value < 0.05 in each case; Figure 4C). In the lung adenocarcinoma cohort all the patients with SASE in the WWOX promoter were current reformed smokers, but survival data were too sparse for statistical analysis. In the melanoma cohort, the samples with SASE in RBM5 promoter had significantly shorter survival compared to others (P-value: 3.3E-02; Figure 4D), which is consistent with its tumor suppressor function. Furthermore, these affected patients had higher incidence of distant or lymph node metastasis compared to other samples in the cohort (6/7 compared to 10/15), indicating that SASE in RBM5 promoter typically indicated aggressive disease.
Figure 4.
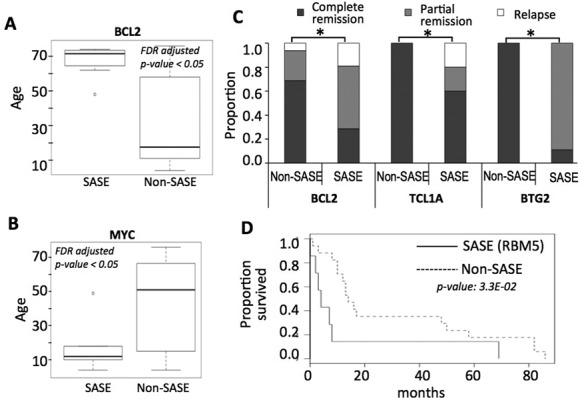
Clinical significance of SASE. (A) Age of the samples that have signatures of accelerated somatic evolution in the promoters of BCL2 are significantly higher relative to other lymphoma samples in the cohort. (B) Age of the samples that have signatures of accelerated somatic evolution in the promoters of MYC are significantly lower relative to other lymphoma samples in the cohort. (C) The samples with SASE in the promoters of BCL2, TCL1A and BTG2 are more likely to have more incidence of partial remission or relapse, compared to other samples in the lymphoma cohort (P-value < 0.05 in each case). (D) SASE in RBM5 promoter was significantly associated with poor survival in the melanoma cohort.
DISCUSSION
Taken together, our pan-cancer survey of 906 tumor genomes from 12 tumor types detected signatures of accelerated somatic evolution in the promoters of several cancer genes, including BCL2, and MYC whose abnormal expression promotes cancer phenotypes. We further demonstrate that, indeed, SASE in the promoters were associated with significant increases in expression for these genes, as well as age of onset of cancer and the aggressiveness of the disease (e.g. in lymphoma) and survival (e.g. melanoma). Importantly, very few of the mutations contributing to SASE were recurrent at the same position in multiple samples, and therefore the signature could not be detected using conventional approaches. Moreover, associated expression changes and clinical attributes underscore that our analysis detects previously under-appreciated patterns of genomic alteration in cancer genomes, and highlights the need to extend such analysis to coding and other non-coding regions.
We note three additional important aspects of our analysis approaches and SASE-hunter. First, by performing a sample-by-sample analysis we account for heterogeneity between patients within a cancer cohort. This is a key consideration because, cancer is a heterogeneous disease comprising of many sub-types, and signatures arising from genetic profiles of a subset of the patients may not always be apparent when pooled across the entire cohort (especially when a few outlier samples have higher mutation burden than others). Second, we implemented a local null model using subsampling approach to account for potential confounding factors such as chromosome-level variation in mutation rate, genomic context and epigenetic make-up. Finally, in the SASE-hunter software, we provide options for the user to change the parameter settings if necessary for greater flexibility and detection of other genomic signatures.
There are several caveats of our analysis. Inaccurate somatic mutation calls have potentials to bias our analysis, but given the validation rate of the original studies, we anticipate that this is probably not a major concern. The sample size for some of the cohorts was small, compromising the power to detect all possible significant cases with signatures of accelerated somatic evolution. This issue also restricted us from extending the analysis to detect functional elements under accelerated somatic evolution at a genome-wide scale. Additionally, this led us to perform limited expression and survival analyses. Furthermore, without allele frequency information, we could not determine whether the mutations contributing to SASE were sub-clonal or present in all tumor cells in the affected samples. Moreover, without further supporting evidence for regulatory consequences, we refrain from inferring causality from correlation alone, and cautiously interpret the data.
We argue that the signature can be driven by context-dependent mutagenesis and/or selection. In the former case, we do not necessarily expect associated expression changes or clinical characteristics. Examining the specific mutations in SASE, we found evidence for kataegis-related localized hypermutation contributing to somatically evolved promoters of cancer genes such as MYC. Given that such signatures were associated with increases in expression for oncogenes such as MYC, BCL2, and decrease in expression for tumor suppressor genes such as WWOX, as well as clinical phenotypes, it is probable that the signature was selected for, at least in selected cases. In contrast, the lack of base-pair level recurrence of mutations suggested that no single base-position within the promoter was under equivalent selection in these samples nor drove the observed patterns. Cancer genes such as MYC are known to acquire an oncogenic super-enhancer via mutation (48). We suspect that, in some cases (e.g. BCL2, MYC), SASE could be yet another mechanism to acquire regulatory boosts to drive over-expression of some of these genes. This finding may shed some light on the pathogenesis of aggressive B and T cell lymphomas, which are associated with MYC overexpression but lack MYC translocation (49), possibly due to SASE-mediated MYC over-expression. It is also conceivable that EBV infection in aggressive Burkitt's lymphomas lacking MYC translocation is associated with activation of evolutionary conserved APOBEC-dependent mechanisms, resulting in increased rate of SASE in the whole genome. Such hypothesis is testable in the future. Alternately, SASE could contribute to loss of function mutations in promoters of tumor suppressor genes (e.g. WWOX), leading to decrease in expression. In other cases, SASE might lead to change in local or higher order chromatin organization, or long-range interactions indirectly affecting gene expression. Ultimately, such deregulation of key oncogenes and tumor suppressor genes could promote tumorigenesis and affect clinical outcome. Indeed, our clinical analysis indicates that SASE in the promoters of several cancer genes is associated with poor clinical outcome. Taken together, our analysis underscores the need for systematic assessment of non-coding regions in cancer genomes for non-traditional mutational signatures of clinical relevance.
AVAILABILITY
Software Availability: http://www.sjdlab.org/resources.
SUPPLEMENTARY DATA
Supplementary Data are available at NAR Online.
Acknowledgments
The authors thank Ryan Morin for data and Paul Bunn Jr, the Computational Biosciences Graduate Program, the members of De lab and the anonymous reviewers for providing helpful comments on the manuscript.
FUNDING
American Cancer Society [ACS-IRG 57-001-53], Lung cancer SPORE [2P50-CA058187], United Against Lung Cancer grant (sponsored by Elliot's Legacy and Joan's Legacy) and Boettecher Foundation [to S.D.]; Gladstone Institutes, a gift from the San Simeon Fund [to K.S.P.]; 5R01-CA164780 [to M.W.G.]; Starr Cancer Consortium Grant [SCC-IA A608 to R.S.]. Funding for open access charge: University of Colorado School of Medicine
Conflict of interest statement. None declared.
REFERENCES
- 1.Lawrence M.S., Stojanov P., Mermel C.H., Robinson J.T., Garraway L.A., Golub T.R., Meyerson M., Gabriel S.B., Lander E.S., Getz G. Discovery and saturation analysis of cancer genes across 21 tumour types. Nature. 2014;505:495–501. doi: 10.1038/nature12912. [DOI] [PMC free article] [PubMed] [Google Scholar]
- 2.ENCODE Project Consortium. An integrated encyclopedia of DNA elements in the human genome. Nature. 2012;489:57–74. doi: 10.1038/nature11247. [DOI] [PMC free article] [PubMed] [Google Scholar]
- 3.Huang F.W., Hodis E., Xu M.J., Kryukov G.V., Chin L., Garraway L.A. Highly recurrent TERT promoter mutations in human melanoma. Science. 2013;339:957–959. doi: 10.1126/science.1229259. [DOI] [PMC free article] [PubMed] [Google Scholar]
- 4.Horn S., Figl A., Rachakonda P.S., Fischer C., Sucker A., Gast A., Kadel S., Moll I., Nagore E., Hemminki K., et al. TERT promoter mutations in familial and sporadic melanoma. Science. 2013;339:959–961. doi: 10.1126/science.1230062. [DOI] [PubMed] [Google Scholar]
- 5.Aerts S., Cools J. Cancer: Mutations close in on gene regulation. Nature. 2013;499:35–36. doi: 10.1038/499035a. [DOI] [PubMed] [Google Scholar]
- 6.Moran A., Iniesta P., de Juan C., Garcia-Aranda C., Diaz-Lopez A., Benito M. Impairment of stromelysin-1 transcriptional activity by promoter mutations in high microsatellite instability colorectal tumors. Cancer Res. 2005;65:3811–3814. doi: 10.1158/0008-5472.CAN-04-4442. [DOI] [PubMed] [Google Scholar]
- 7.Xu Y., Fang F., Ludewig G., Jones G., Jones D. A mutation found in the promoter region of the human survivin gene is correlated to overexpression of survivin in cancer cells. DNA Cell Biol. 2004;23:527–537. doi: 10.1089/dna.2004.23.527. [DOI] [PubMed] [Google Scholar]
- 8.Xu Y., Fang F., Dhar S.K., Bosch A., Clair W.H., Kasarskis E.J., Clair D.K. Mutations in the SOD2 promoter reveal a molecular basis for an activating protein 2-dependent dysregulation of manganese superoxide dismutase expression in cancer cells. Mol. Cancer Res. 2008;6:1881–1893. doi: 10.1158/1541-7786.MCR-08-0253. [DOI] [PMC free article] [PubMed] [Google Scholar]
- 9.Killela P.J., Reitman Z.J., Jiao Y., Bettegowda C., Agrawal N., Diaz L.A. Jr, Friedman A.H., Friedman H., Gallia G.L., Giovanella B.C., et al. TERT promoter mutations occur frequently in gliomas and a subset of tumors derived from cells with low rates of self-renewal. Proc. Natl. Acad. Sci. U.S.A. 2013;110:6021–6026. doi: 10.1073/pnas.1303607110. [DOI] [PMC free article] [PubMed] [Google Scholar]
- 10.Weinhold N., Jacobsen A., Schultz N., Sander C., Lee W. Genome-wide analysis of noncoding regulatory mutations in cancer. Nat. Genet. 2014;46:1160–1165. doi: 10.1038/ng.3101. [DOI] [PMC free article] [PubMed] [Google Scholar]
- 11.Fredriksson N.J., Ny L., Nilsson J.A., Larsson E. Systematic analysis of noncoding somatic mutations and gene expression alterations across 14 tumor types. Nat. Genet. 2014;46:1258–1263. doi: 10.1038/ng.3141. [DOI] [PubMed] [Google Scholar]
- 12.Muller P.A., Vousden K.H. p53 mutations in cancer. Nat. Cell Biol. 2013;15:2–8. doi: 10.1038/ncb2641. [DOI] [PubMed] [Google Scholar]
- 13.Pollard K.S., Salama S.R., Lambert N., Lambot M.A., Coppens S., Pedersen J.S., Katzman S., King B., Onodera C., Siepel A., et al. An RNA gene expressed during cortical development evolved rapidly in humans. Nature. 2006;443:167–172. doi: 10.1038/nature05113. [DOI] [PubMed] [Google Scholar]
- 14.Ziegeler M., Cevec M., Richter C., Schwalbe H. NMR studies of HAR1 RNA secondary structures reveal conformational dynamics in the human RNA. Chembiochem. 2012;13:2100–2112. doi: 10.1002/cbic.201200401. [DOI] [PubMed] [Google Scholar]
- 15.Pollard K.S., Salama S.R., King B., Kern A.D., Dreszer T., Katzman S., Siepel A., Pedersen J.S., Bejerano G., Baertsch R., et al. Forces shaping the fastest evolving regions in the human genome. PLoS Genet. 2006;2:e168. doi: 10.1371/journal.pgen.0020168. [DOI] [PMC free article] [PubMed] [Google Scholar]
- 16.International Cancer Genome Consortium. Hudson T.J., Anderson W., Artez A., Barker A.D., Bell C., Bernabe R.R., Bhan M.K., Calvo F., Eerola I., et al. International network of cancer genome projects. Nature. 2010;464:993–998. doi: 10.1038/nature08987. [DOI] [PMC free article] [PubMed] [Google Scholar]
- 17.Cancer Genome Atlas Research Network. Comprehensive molecular profiling of lung adenocarcinoma. Nature. 2014;511:543–550. doi: 10.1038/nature13385. [DOI] [PMC free article] [PubMed] [Google Scholar]
- 18.Berger M.F., Hodis E., Heffernan T.P., Deribe Y.L., Lawrence M.S., Protopopov A., Ivanova E., Watson I.R., Nickerson E., Ghosh P., et al. Melanoma genome sequencing reveals frequent PREX2 mutations. Nature. 2012;485:502–506. doi: 10.1038/nature11071. [DOI] [PMC free article] [PubMed] [Google Scholar]
- 19.Morin R.D., Mungall K., Pleasance E., Mungall A.J., Goya R., Huff R.D., Scott D.W., Ding J., Roth A., Chiu R., et al. Mutational and structural analysis of diffuse large B-cell lymphoma using whole-genome sequencing. Blood. 2013;122:1256–1265. doi: 10.1182/blood-2013-02-483727. [DOI] [PMC free article] [PubMed] [Google Scholar]
- 20.Liu L., De S., Michor F. DNA replication timing and higher-order nuclear organization determine single-nucleotide substitution patterns in cancer genomes. Nat. Commun. 2013;4:1502. doi: 10.1038/ncomms2502. [DOI] [PMC free article] [PubMed] [Google Scholar]
- 21.Schuster-Bockler B., Lehner B. Chromatin organization is a major influence on regional mutation rates in human cancer cells. Nature. 2012;488:504–507. doi: 10.1038/nature11273. [DOI] [PubMed] [Google Scholar]
- 22.De S., Pedersen B.S., Kechris K. The dilemma of choosing the ideal permutation strategy while estimating statistical significance of genome-wide enrichment. Brief. Bioinform. 2014;15:919–928. doi: 10.1093/bib/bbt053. [DOI] [PMC free article] [PubMed] [Google Scholar]
- 23.Bickel P.J., Boley N., Brown J.B., Huang H., Zhang N.R. Subsampling methods for genomic inference. Ann. Appl. Stat. 2010;4:1660–1697. [Google Scholar]
- 24.Alexandrov L.B., Nik-Zainal S., Wedge D.C., Aparicio S.A., Behjati S., Biankin A.V., Bignell G.R., Bolli N., Borg A., Borresen-Dale A.L., et al. Signatures of mutational processes in human cancer. Nature. 2013;500:415–421. doi: 10.1038/nature12477. [DOI] [PMC free article] [PubMed] [Google Scholar]
- 25.Davydov E.V., Goode D.L., Sirota M., Cooper G.M., Sidow A., Batzoglou S. Identifying a high fraction of the human genome to be under selective constraint using GERP++ PLoS Comput. Biol. 2010;6:e1001025. doi: 10.1371/journal.pcbi.1001025. [DOI] [PMC free article] [PubMed] [Google Scholar]
- 26.Lawrence M.S., Stojanov P., Polak P., Kryukov G.V., Cibulskis K., Sivachenko A., Carter S.L., Stewart C., Mermel C.H., Roberts S.A., et al. Mutational heterogeneity in cancer and the search for new cancer-associated genes. Nature. 2013;499:214–218. doi: 10.1038/nature12213. [DOI] [PMC free article] [PubMed] [Google Scholar]
- 27.Woo Y.H., Li W.H. DNA replication timing and selection shape the landscape of nucleotide variation in cancer genomes. Nat. Commun. 2012;3:1004. doi: 10.1038/ncomms1982. [DOI] [PubMed] [Google Scholar]
- 28.Aukema S.M., Siebert R., Schuuring E., van Imhoff G.W., Kluin-Nelemans H.C., Boerma E.J., Kluin P.M. Double-hit B-cell lymphomas. Blood. 2011;117:2319–2331. doi: 10.1182/blood-2010-09-297879. [DOI] [PubMed] [Google Scholar]
- 29.Morel A.P., Sentis S., Bianchin C., Le Romancer M., Jonard L., Rostan M.C., Rimokh R., Corbo L. BTG2 antiproliferative protein interacts with the human CCR4 complex existing in vivo in three cell-cycle-regulated forms. J. Cell Sci. 2003;116:2929–2936. doi: 10.1242/jcs.00480. [DOI] [PubMed] [Google Scholar]
- 30.Wagener N., Bulkescher J., Macher-Goeppinger S., Karapanagiotou-Schenkel I., Hatiboglu G., Abdel-Rahim M., Abol-Enein H., Ghoneim M.A., Bastian P.J., Muller S.C., et al. Endogenous BTG2 expression stimulates migration of bladder cancer cells and correlates with poor clinical prognosis for bladder cancer patients. Br. J. Cancer. 2013;108:973–982. doi: 10.1038/bjc.2012.573. [DOI] [PMC free article] [PubMed] [Google Scholar]
- 31.Pekarsky Y., Hallas C., Croce C.M. The role of TCL1 in human T-cell leukemia. Oncogene. 2001;20:5638–5643. doi: 10.1038/sj.onc.1204596. [DOI] [PubMed] [Google Scholar]
- 32.Yamane A., Resch W., Kuo N., Kuchen S., Li Z., Sun H.W., Robbiani D.F., McBride K., Nussenzweig M.C., Casellas R. Deep-sequencing identification of the genomic targets of the cytidine deaminase AID and its cofactor RPA in B lymphocytes. Nat. Immunol. 2011;12:62–69. doi: 10.1038/ni.1964. [DOI] [PMC free article] [PubMed] [Google Scholar]
- 33.Dominguez P.M., Shaknovich R. Epigenetic function of activation-induced cytidine deaminase and its link to lymphomagenesis. Front. Immunol. 2014;5:642. doi: 10.3389/fimmu.2014.00642. [DOI] [PMC free article] [PubMed] [Google Scholar]
- 34.Pasqualucci L., Neumeister P., Goossens T., Nanjangud G., Chaganti R.S., Kuppers R., Dalla-Favera R. Hypermutation of multiple proto-oncogenes in B-cell diffuse large-cell lymphomas. Nature. 2001;412:341–346. doi: 10.1038/35085588. [DOI] [PubMed] [Google Scholar]
- 35.Zhao L., Li R., Shao C., Li P., Liu J., Wang K. 3p21.3 tumor suppressor gene RBM5 inhibits growth of human prostate cancer PC-3 cells through apoptosis. World J. Surg. Oncol. 2012;10:247. doi: 10.1186/1477-7819-10-247. [DOI] [PMC free article] [PubMed] [Google Scholar]
- 36.Sutherland L.C., Wang K., Robinson A.G. RBM5 as a putative tumor suppressor gene for lung cancer. J. Thorac. Oncol. 2010;5:294–298. doi: 10.1097/JTO.0b013e3181c6e330. [DOI] [PubMed] [Google Scholar]
- 37.Avvakumov N., Lalonde M.E., Saksouk N., Paquet E., Glass K.C., Landry A.J., Doyon Y., Cayrou C., Robitaille G.A., Richard D.E., et al. Conserved molecular interactions within the HBO1 acetyltransferase complexes regulate cell proliferation. Mol. Cell. Biol. 2012;32:689–703. doi: 10.1128/MCB.06455-11. [DOI] [PMC free article] [PubMed] [Google Scholar]
- 38.Nicolson G.L., Nawa A., Toh Y., Taniguchi S., Nishimori K., Moustafa A. Tumor metastasis-associated human MTA1 gene and its MTA1 protein product: role in epithelial cancer cell invasion, proliferation and nuclear regulation. Clin. Exp. Metastasis. 2003;20:19–24. doi: 10.1023/a:1022534217769. [DOI] [PubMed] [Google Scholar]
- 39.Qian H., Yu J., Li Y., Wang H., Song C., Zhang X., Liang X., Fu M., Lin C. RNA interference of metastasis-associated gene 1 inhibits metastasis of B16F10 melanoma cells in a C57BL/6 mouse model. Biol. Cell. 2007;99:573–581. doi: 10.1042/bc20060130. [DOI] [PubMed] [Google Scholar]
- 40.Ono T., Losada A., Hirano M., Myers M.P., Neuwald A.F., Hirano T. Differential contributions of condensin I and condensin II to mitotic chromosome architecture in vertebrate cells. Cell. 2003;115:109–121. doi: 10.1016/s0092-8674(03)00724-4. [DOI] [PubMed] [Google Scholar]
- 41.Lapointe J., Malhotra S., Higgins J.P., Bair E., Thompson M., Salari K., Giacomini C.P., Ferrari M., Montgomery K., Tibshirani R., et al. hCAP-D3 expression marks a prostate cancer subtype with favorable clinical behavior and androgen signaling signature. Am. J. Surg. Pathol. 2008;32:205–209. doi: 10.1097/PAS.0b013e318124a865. [DOI] [PubMed] [Google Scholar]
- 42.Kino K., Sugiyama H. UVR-induced G-C to C-G transversions from oxidative DNA damage. Mutat. Res. 2005;571:33–42. doi: 10.1016/j.mrfmmm.2004.10.010. [DOI] [PubMed] [Google Scholar]
- 43.Kino K., Sugiyama H. Possible cause of G-C–>C-G transversion mutation by guanine oxidation product, imidazolone. Chem. Biol. 2001;8:369–378. doi: 10.1016/s1074-5521(01)00019-9. [DOI] [PubMed] [Google Scholar]
- 44.Verma A., Yadav V.K., Basundra R., Kumar A., Chowdhury S. Evidence of genome-wide G4 DNA-mediated gene expression in human cancer cells. Nucleic Acids Res. 2009;37:4194–4204. doi: 10.1093/nar/gkn1076. [DOI] [PMC free article] [PubMed] [Google Scholar]
- 45.Bruno A., Boisselier B., Labreche K., Marie Y., Polivka M., Jouvet A., Adam C., Figarella-Branger D., Miquel C., Eimer S., et al. Mutational analysis of primary central nervous system lymphoma. Oncotarget. 2014;5:5065–5075. doi: 10.18632/oncotarget.2080. [DOI] [PMC free article] [PubMed] [Google Scholar]
- 46.Morin R.D., Gascoyne R.D. Newly identified mechanisms in B-cell non-Hodgkin lymphomas uncovered by next-generation sequencing. Semin. Hematol. 2013;50:303–313. doi: 10.1053/j.seminhematol.2013.09.004. [DOI] [PubMed] [Google Scholar]
- 47.Kemp C.J., Moore J.M., Moser R., Bernard B., Teater M., Smith L.E., Rabaia N.A., Gurley K.E., Guinney J., Busch S.E., et al. CTCF haploinsufficiency destabilizes DNA methylation and predisposes to cancer. Cell Rep. 2014;7:1020–1029. doi: 10.1016/j.celrep.2014.04.004. [DOI] [PMC free article] [PubMed] [Google Scholar]
- 48.Mansour M.R., Abraham B.J., Anders L., Berezovskaya A., Gutierrez A., Durbin A.D., Etchin J., Lawton L., Sallan S.E., Silverman L.B., et al. Oncogene regulation. An oncogenic super-enhancer formed through somatic mutation of a noncoding intergenic element. Science. 2014;346:1373–1377. doi: 10.1126/science.1259037. [DOI] [PMC free article] [PubMed] [Google Scholar]
- 49.Chisholm K.M., Bangs C.D., Bacchi C.E., Kirsch H.M., Cherry A., Natkunam Y. Expression profiles of MYC protein and MYC gene rearrangement in lymphomas. Am. J. Surg. Pathol. 2015;39:294–303. doi: 10.1097/PAS.0000000000000365. [DOI] [PubMed] [Google Scholar]
Associated Data
This section collects any data citations, data availability statements, or supplementary materials included in this article.