Abstract
Optimal delivery of light in photodynamic therapy (PDT) requires not only optimal placement and power of light sources, but knowledge of the dynamics of light propagation in the tissue being treated and in the surrounding normal tissue, and of their respective accumulations of sensitizer. In an effort to quantify both tissue optical properties and sensitizer distribution, we have measured fluorescence emission and diffuse reflectance spectra at the surface of a variety of tissue types in the thoracic cavities of human patients. The patients studied here were enrolled in Phase II clinical trials of Photofrin-mediated PDT for the treatment of non-small cell lung cancer and cancers with pleural effusion. Patients were given Photofrin at dose of 2 mg per kg body weight 24 hours prior to treatment. Each patient received surgical resection of the affected lung and pleura. Patients received intracavity PDT at 630nm to a dose of 30 J/cm2, as determined by isotropic detectors sutured to the cavity walls. We measured the diffuse reflectance spectra before and after PDT in various positions within the cavity, including tumor, diaphragm, pericardium, skin, and chest wall muscle in 5 patients. The measurements we acquired using a specially designed fiber optic-based probe consisting of one fluorescence excitation fiber, one white light delivery fiber, and 9 detection fibers spaced at distances from 0.36 to 7.8 mm from the source, all of which are imaged via a spectrograph onto a CCD, allowing measurement of radially-resolved diffuse reflectance and fluorescence spectra. The light sources for these two measurements (a 403-nm diode laser and a halogen lamp, respectively) were blocked by computer-controlled shutters, allowing sequential fluorescence, reflectance, and background acquisition. The diffuse reflectance was analyzed to determine the absorption and scattering spectra of the tissue and from these, the concentration and oxygenation of hemoglobin and the local drug uptake. The total hemoglobin concentration in normal tissues varied from 50 to 300 μM, and the oxygen saturation was generally above 60%. One tumor measured exhibited higher hemoglobin concentration and lower saturation.
Keywords: photodynamic therapy, Photofrin, fluorescence spectroscopy, diffuse reflectance
1. INTRODUCTION
Photodynamic therapy (PDT) requires the presence of light, a sensitizing drug, and oxygen. While several approaches to PDT dosimetry have been suggested, the most commonly used in explicit dosimetry, in which some or all of the important factors are measured directly.1 In this paper, we apply diffuse reflectance spectroscopy to the challenge of determining the optical properties, hemoglobin saturation, and sensitizer concentration in vivo in patients being treated for cancers of the lung and pleura. This particular treatment is unusual in that it is performed during surgery on otherwise inaccessible tissues in the thoracic cavity. In addition to the technical challenges involved in any in vivo optical measurement, intraoperative spectroscopy must be performed with mobile, rugged, sterilizable equipment, and must be finished quickly to avoid prolonging surgery
2. METHODS AND MATERIALS
Patient treatment
The patients described here were enrolled in an ongoing Phase II trial of Photofrin (porfimer sodium)-mediated photodynamic therapy (PDT) in combination with surgery for non-small-cell lung cancer (NSCLC) with pleural spread.2 Surgery was performed at the University of Pennsylvania Health System’s Presbyterian Hospital. All patients underwent thoracotomy under the direction of the attending thoracic surgeon (J.S.F.). After pneumonectomy, each patient received PDT as described below to treat the thoracic cavity. On the day preceding surgery, each patient was injected with Photofrin at a concentration of 2 mg/kg body weight. Diffuse reflectance measurements are made on the skin adjacent to the planned point of incision immediately prior to Photofrin injection, for comparison with measurements made during surgery. The procedure used for intraoperative PDT has been described previously.2, 3 630-nm illumination provided by a KTP-pumped dye laser (model 630 XP, Laserscope, Inc, San Jose, CA) was delivered via a diffusing optical probe consisting of an optical fiber mounted in a modified endotracheal tube that terminated in a balloon filled with 0.1% intralipid. To further homogenize the light dose, the cavity was filled with a scattering solution of 0.01% intralipid. Flat photodiodes were sewn into seven regions of the pleural cavity: apex, anterior chest wall, posterior chest wall, posterior mediastinum, posterior costophrenic sulcus, anterior costophrenic sulcus, and pericardium. The signal from these photodiodes was measured by a dosimetry system, which recorded and displayed both the instantaneous dose rate and the cumulative dose at each site. The illumination was delivered under manual control until the prescribed dose (30 J/cm2) was reached at all sites.
Optical measurements
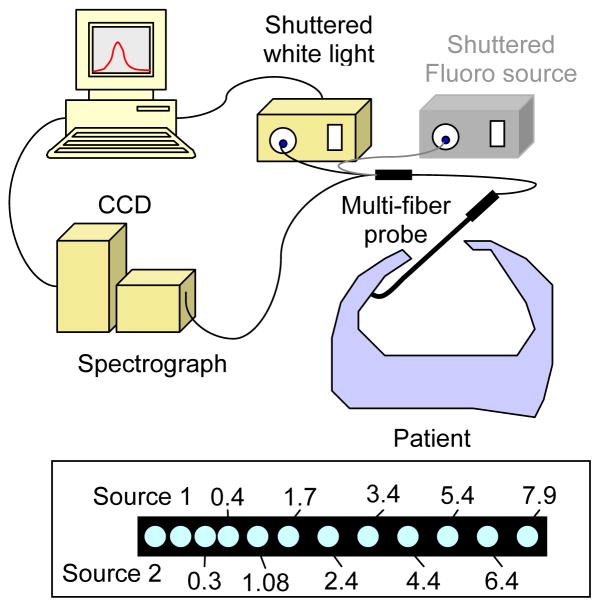
The diffuse reflectance measurements reported here were made using a custom-designed optical probe (FiberOptic Systems, Inc., Simi Valley, CA), shown in figure 1. The probe consisted of two source fibers and 9 detection fibers. One source fiber was coupled to an air-cooled quartz-tungsten-halogen (QTH) lamp (Avalight HAL-S, Avantes, Inc.) for the measurement of diffuse reflectance. The light emitted in or reflected by the tissue was collected by the remaining optical fibers. The spacing of the fibers was such that data were collected at distances from the source ranging from 0.34 to 7.8 mm (see figure 1, inset). The proximal ends of the these fibers were terminated in a ferrule held at the focus of a combination imaging spectrograph and charge-coupled device (CCD)-based camera (InSpectrum 150, Roper Scientific, Princeton, NJ). Background signal, measured in the same tissue with the white light source turned off, is subtracted from each measurement. To account for the wavelength-dependence of the white light source power and CCD response, we divide each tissue spectrum by the spectrum obtained with the same light source and detector in an integrating sphere. The second source fiber was used for measurement of fluorescence emission spectra, not discussed here.
Figure 1.
Diagram of setup for intraoperative diffuse reflectance spectroscopy. The fiber spacing (in mm from Source 1) at the distal end of the probe is shown in the box at the bottom of the frame.
Both light sources and the CCD data acquisition were controlled by a computer program written in-house for the purpose. This program allows sequential acquisition of diffuse reflectance, background, and fluorescence spectra without interruption of the measurement, minimizing unintended movement of the probe. The software also includes automated event logging and filename specification to minimize sources of operator error in the operating room. All measurements were made with the probe in contact with the interior of the cavity. No scattering emulsion was present at the time of measurement. The operating room lights were dimmed to reduce the background signal.
Data analysis
To model the propagation of light in tissue, we have adopted the diffusion-P3 hybrid model with extrapolated boundary conditions for semi-infinite media proposed by Hull and Foster4. Briefly, this model replaces in incident pencil beam with two equally weighted isotropic point sources, one located on the surface and one at a depth equal to twice the medium’s transport mean free path. The boundary is accounted for by placing two equally weighted image sources at the positions of the sources reflected in an extrapolated boundary.
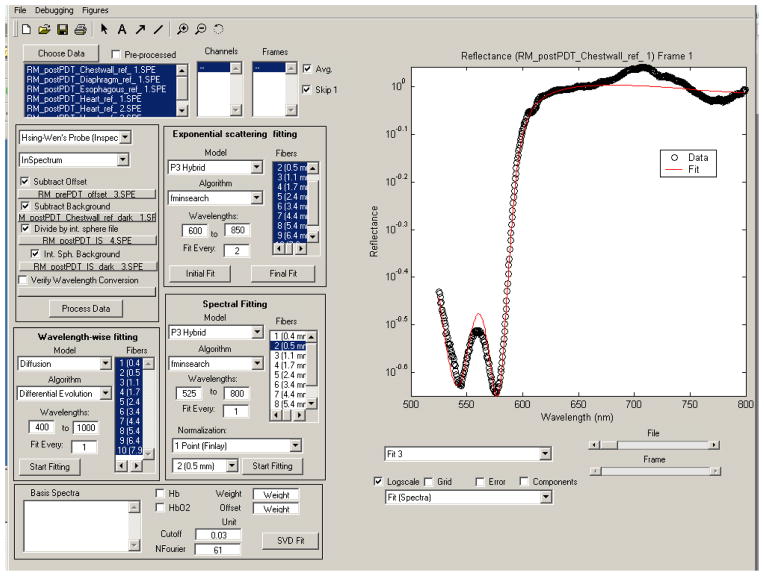
The measured reflectance spectra are fit with a nonlinear fitting algorithm implemented in the MATLAB programming environment (The Mathworks, Natick, MA) to extract the values of relevant parameters. To make the fitting algorithm easy to use and interactive, we implemented a graphical user interface (GUI), as shown in figure 2. The fitting of normalized data can be performed a number of ways, including: on a wavelength-by wavelength basis;4, 5 by normalizing the data to that acquired at the smallest source-detector separation across all wavelengths;6 or by normalizing to the reflectance at 650 nm at a single source-detector separation.7 In this work, we have adopted the latter method. The fitting algorithm models the scattering coefficient as μs′ = A(λ/λ0)−b, a widely used approximation.7, 8 We further assume that the absorption coefficient can be modeled as μa(λ) = Σciεi(λ), where the sum is over the number of absorbers included in the fit, and ci and εi(λ) are the concentration and absorption spectrum of the ith absorber respectively. In this case, our absorption basis spectra are those of oxy- and deoxyhemoglobin and Photofrin. The free parameters in the fit are A and b characterizing the scattering and the concentrations of these three compounds. Prior work with this model indicates that absolute scattering information cannot be recovered when fitting purely normalized data.7 For this reason, we will focus on the results obtained from the parameters related to absorption.
Figure 2.
Graphical user interface designed for the fitting of diffuse reflectance data. The interface allows the users to interactively control the fitting, making it easier to identify poor fits.
Phantom preparation
To verify the accuracy of our analytical model, we have constructed a series of tissue-simulating phantoms. Each phantom was composed of liposyn 30% diluted in water to a concentration that provided the desired reduced scattering coefficient. The absorption coefficient of the phantoms was varied by the addition of Higgin’s Black India Ink. The optical properties of each phantom were verified by measuring the depth dependence of the fluence rate under broad beam illumination.9
3. RESULTS
Phantom verification
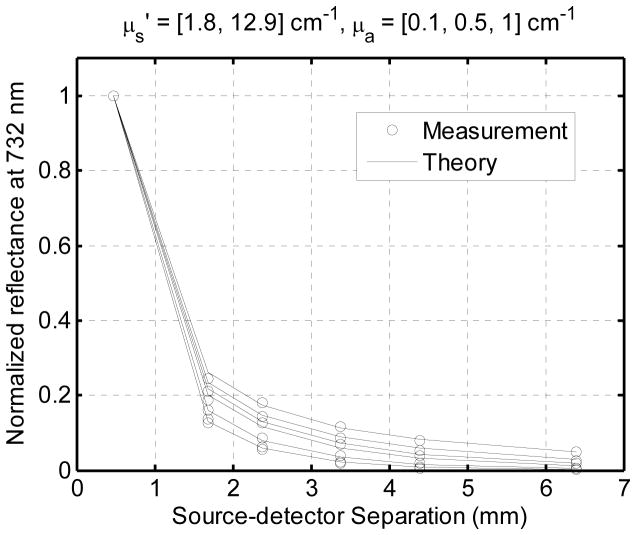
Figure 3 illustrates the agreement between our measurements and the diffusion-P3 hybrid model. Each set of symbols represents the reflectance from a different phantom, and the solid lines represent the analytical model for the corresponding set of optical properties. The agreement is good over the range of reduced scattering coefficient from 1.8 to 13 cm−1 and absorption coefficient from 0.1 to 1 cm−1. This data verifies the accuracy of our analytic model. It does not verify the accuracy of our fitting algorithm, because it can find no meaningful fit can be obtained from these phantoms, which have only one absorber with a flat, featureless spectrum.
Figure 3.
Normalized diffuse reflectance (open circles) measured at the surface of a series of tissue simulating phantoms. The values predicted by the diffusion-P3 hybrid model are indicated by solid lines. The agreement is good over a wide range of absorption and reduced scattering coefficients.
Patient data
Figure 4 shows a typical set of diffuse reflectance spectra obtained in vivo from the interior chest wall of a typical patient. The minima in the reflectance spectrum corresponding to the visible maxima in the oxyhemoglobin absorption spectrum are clearly visible (arrows). The signal is much lower at wavelengths below 600 nm because the absorption due to both forms of hemoglobin is much greater in this range than at longer wavelengths.
Figure 4.
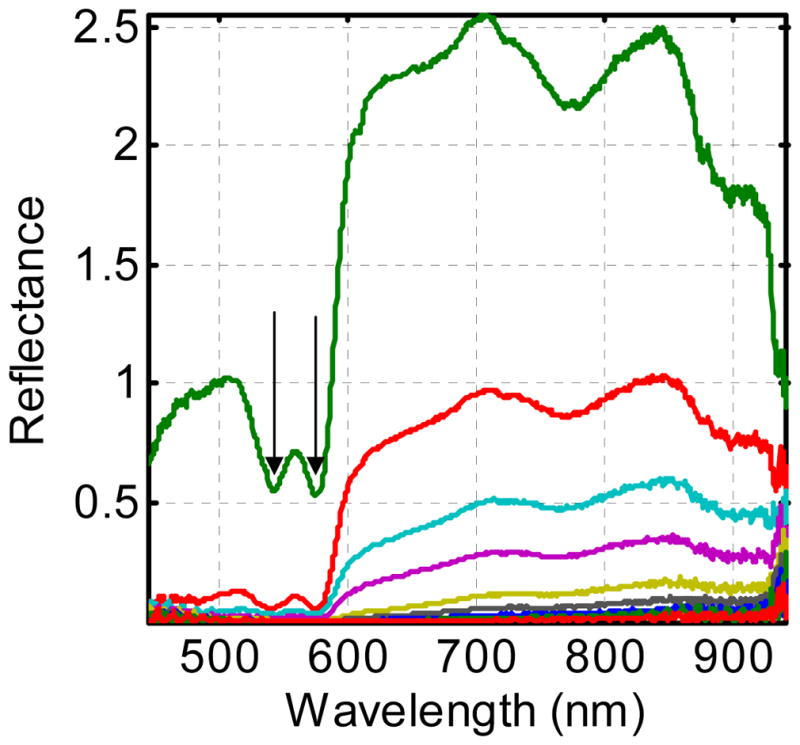
Diffuse reflectance spectra obtained from the interior chest wall of a typical patient. Each spectrum was acquired at a different source-detector separation, as indicated in the inset of figure 1. The double minima around 570 nm (arrows) in each spectrum result from oxyhemoglobin absorption.
Figure 5a shows the results of fitting reflectance measured at the first four source-detector separations simultaneously. The mismatches at both the hemoglobin peaks and at wavelengths beyond 700 nm indicate that the data we measure is not accurately fit by the model. It is possible that this is a result of heterogeneity in the tissue or variable tissue contact in different fibers. To overcome this problem, we instead fit each fiber’s signal independently. This allows independent measurement of the free parameters at a four positions. As shown in figure 5b, the resulting fits are greatly improved. This indicates that at each source-detector separation, the model accurately fits the measured data.
Figure 5.
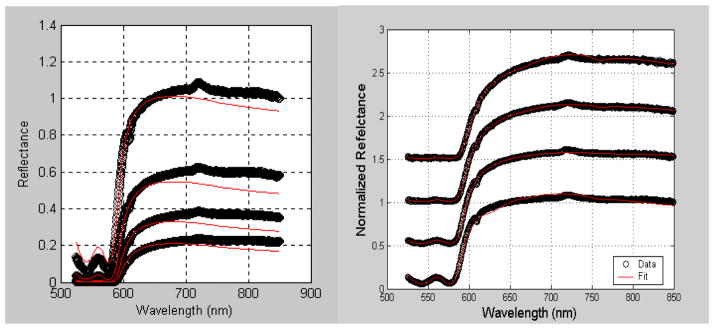
Diffuse reflectance spectra obtained from the interior chest wall of a typical patient fit simultaneously (a) or individually (b). In panel (b), the data are shifted for clarity.
The results of our analysis are summarized in table 1. Because we have obtained data on only a limited sample of each normal tissue type (esophagus, pericardium, diaphragm, chest wall, etc.), we have grouped all the normal tissue together. The mean hemoglobin concentration in the normal tissue was around 140 μM both before and after treatment. The mean hemoglobin saturation was 81% before PDT and 85% after, however the small sample size and large standard deviation make this difference insignificant. In all of our normal tissue measurements, we find a hemoglobin concentration of at least 60%, indicating that the surface we are measuring is well oxygenated. This is to be expected, since the normal tissue is presumably has normal vasculature and is exposed to the air at the time of measurement.
Table 1.
Summary of the fitting results from normal tissues in 5 patients and one tumor. In the tumor case, we report the range in saturation rather than the mean because of the small sample size.
| Total Hemoglobin (μM) | Hemoglobin Saturation (%) | |||
|---|---|---|---|---|
| Pre-PDT | Post-PDT | Pre-PDT | Post-PDT | |
| Normal Tissue (N=5) | 139 ±130 | 144 ±155 | 81 ± 21 | 85 ± 14 |
| Tumor (N=1) | 325 | 303 | 26 – 65 | 85 – 91 |
In one case, we were able to make measurements on tumor tissue. In this case, the hemoglobin concentration was much higher, possibly indicating leakier or less well-organized vasculature. The hemoglobin saturation varied greatly from one position to another and from the pre-treatment to the post-treatment measurements. The pre-treatment measurements, especially, exhibited very low tumor oxygenation.
Although our current algorithm includes the basis spectrum of Photofrin, it does not provide a reliable concentration for the drug. For example, the slight dip in the fit of the bottom curve in figure 5b results from an artifactual assignment of a Photofrin concentration of 83 mg/kg, 40 times higher than the injection concentration. The adjacent curve has a fitted Photofrin concentration of less than 0.1 mg/kg, further refuting the accuracy of this fit. For this reason, we have not reported any results or trends in the Photofrin concentration.
4. DISCUSSION
We have demonstrated the ability of a fiber-optic based optical probe, in combination with an appropriate analytical model, to extract meaningful physiological data from reflectance spectra measured in vivo in the human thoracic cavity. In general, the measurements we have made in normal tissue reveal hemoglobin concentrations in the physiological range and hemoglobin oxygen saturations of 65 to 100%, indicating that at the time of treatment the normal tissue is well-oxygenated. In the case of the one tumor we have been able to measure in vivo, the oxygenation we measured was highly heterogeneous, with a mean much lower than that of the surrounding normal tissue. This may indicate differences between tumor neovascularization and normal vasculature. It is possible that the most PDT-resistant parts of the tumor will be local pockets of hypoxia. The measurements we describe here have the potential to allow identification of such areas.
Future directions
In order to be generally useful for routine clinical in vivo dosimetry, the system we have presented here needs to be improved in several fundamental ways. First, the fitting algorithm should be improved to allow quantification of the Photofrin concentration. This may require placing limits on the Photofrin concentration the model assigns or performing the fit in two stages, one to determine the hemodynamics and another to asses the drug concentration. Because the inability of the algorithm to quantify Photofrin results primarily from the dominant absorption by hemoglobin in the spectral region around Photofrin’s absorption maximum, we expect less trouble with drugs with longer-wavelength absorption maxima. In interstitial measurements in the human prostate, for instance, we have demonstrated the ability to separate the absorption due to Motexafin Lutetium (MLu), which absorbs at 732 nm, from that of hemoglobin.10, 11 Second, the data acquisition and data analysis system needs to be made more automated and more efficient, so allow not only the acquired spectra but also the fitted results to be displayed in near real time in the operating suite. The fitted oxygenation and drug concentration results can then be used to determine a metric of photodynamic damage. This will allow the physician to stop the treatment when the desired PDT dose, rather than just the desired total fluence, has been reached. Third, for dosimetric purposes, it will be necessary to make measurements continuously throughout treatment instead of before and after treatment. This will require a probe that can be left in place in the cavity during treatment. We have developed such a probe using side-firing optical fibers, however we have not yet implemented it in our human trials. Finally, measurements made during irradiation will require removal of the treatment light from the measured signal. We anticipate that this will be possible using a combination of optical filters and frequency-modulated light sources and detectors, allowing both optical and electronic rejection of the treatment light. Work in these areas is ongoing.
Acknowledgments
This work was supported in part by Department of Defense grant DAMD17-03-1-0132, NIH PO1 grant CA87971, and NIH R01 grant CA109456. The authors wish to thank Theresa Busch and Hsing-Wen Wang for help in interpreting the data and developing the fitting algorithm.
References
- 1.Wilson BC, Patterson MS, Lilge L. Implicit and explicit dosimetry in photodynamic therapy: A new paradigm. Lasers Med Sci. 1997;12:182–199. doi: 10.1007/BF02765099. [DOI] [PubMed] [Google Scholar]
- 2.Friedberg JS, Mick R, Stevenson JP, Zhu TC, Busch TM, Shin D, Smith D, Culligan M, Dimofte A, Glatstein E, Hahn SM. Phase II Trial of Pleural Photodynamic Therapy and Surgery for Patients With Non–Small-Cell Lung Cancer With Pleural Spread. J Clin Onc. 2004;22:2192–2201. doi: 10.1200/JCO.2004.07.097. [DOI] [PubMed] [Google Scholar]
- 3.Pass HI, Tochner Z, DeLaney T, Smith P, Friauf W, Glatstein E, Travis W. Intraoperative photodynamic therapy for malignant mesothelioma. Ann Thorac Surg. 1990;50:687–688. doi: 10.1016/0003-4975(90)90230-4. [DOI] [PubMed] [Google Scholar]
- 4.Hull EL, Foster TH. Steady-state reflectance spectroscopy in the P3 approximation. JOSA A. 2001;18:584–599. [Google Scholar]
- 5.Nichols MG, Hull EL, Foster TH. Design and testing of a white-light, steady-state diffuse reflectance spectrometer for determination of optical properties of highly scattering systems. Appl Opt. 1997;36:93–104. doi: 10.1364/ao.36.000093. [DOI] [PubMed] [Google Scholar]
- 6.Wang HW, Zhu TC, Putt ME, Solonenko M, Metz J, Dimofte A, Miles J, Fraker DL, Glatstein E, Hahn SM, Yodh AG. Broadband reflectance measurements of light penetration, blood oxygenation, hemoglobin concentration, and drug concentration in human intraperitoneal tissues before and after photodynamic therapy. J Biomed Opt. 2005;10:14004. doi: 10.1117/1.1854679. [DOI] [PubMed] [Google Scholar]
- 7.Finlay JC, Foster TH. Hemoglobin oxygen saturations in phantoms and in vivo from measurements of steady state diffuse reflectance at a single, short source-detector separation. Med Phys. 2004;31:1949–1959. doi: 10.1118/1.1760188. [DOI] [PubMed] [Google Scholar]
- 8.Jacques SL. Origins of optical properties in the UVA, visible, and NIR regions. OSA Trends in Optics and Photonics on Advances in Optical Imaging and Photon Migration. 1996;2:364–371. [Google Scholar]
- 9.Dimofte A, Finlay JC, Zhu TC. A method for determination of the absorption and scattering properties interstitially in turbid media. Phys Med Biol. 2005;50:2291–2311. doi: 10.1088/0031-9155/50/10/008. [DOI] [PMC free article] [PubMed] [Google Scholar]
- 10.Zhu TC, Finlay JC, Hahn SM. Determination of the distribution of light, optical properties, drug concentration, and tissue oxygenation in-vivo in human prostate during motexafin lutetium-mediated photodynamic therapy. J Photochem Photobiol B: Biol. 2005;79:231–241. doi: 10.1016/j.jphotobiol.2004.09.013. [DOI] [PMC free article] [PubMed] [Google Scholar]
- 11.Finlay JC, Zhu TC, Dimofte A, Stripp D, Malkowicz SB, Whittington R, Miles J, Glatstein E, Hahn SM. In vivo determination of the absorption and scattering spectra of the human prostate during photodynamic therapy. Proc SPIE. 2004;5315:132–142. doi: 10.1117/12.528968. [DOI] [PMC free article] [PubMed] [Google Scholar]


