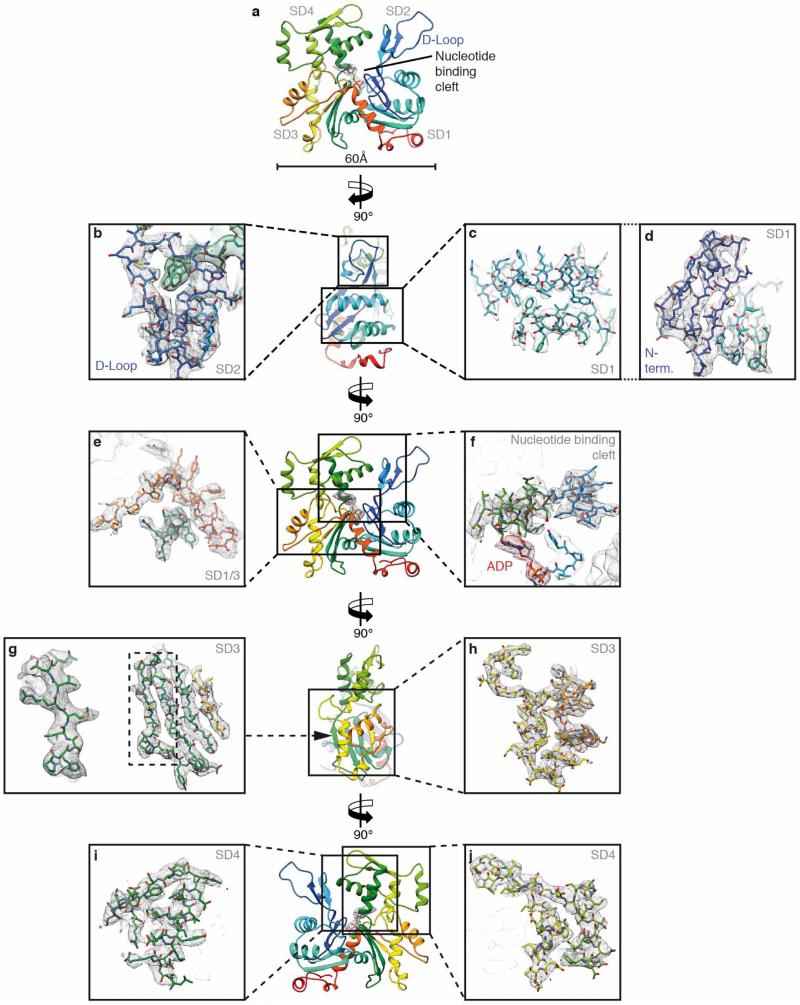
Extended Data Figure 3. Representative regions of the F-actin electron density map.
a, Overview of the atomic model of an F-actin subunit rainbow-coloured from the N terminus (blue) to the C terminus (red). ADP and the coordinated cation, probably Mg2+, are depicted inside their corresponding electron densities. b–d, Side view. Interface between the D-loop (SD2) and the SD3 of the adjacent actin subunit (b), outer two helices of SD1 (c), and inner β-sheet with N terminus (d). e, f, Front view. Connection of SD1 and SD3 (e) and nucleotide binding cleft (f). g, h, Side view. Inner β-sheet of SD3 with one highlighted strand (g) and outer part of SD3 (h). i, j, Back view. SD4 separated in two parts.

