

Abstract
Purpose
This study sought to define and identify drivers of trends in cost and use of targeted therapeutics among privately insured nonelderly patients with cancer receiving chemotherapy between 2001 and 2011.
Methods
We classified oncology drugs as targeted oral anticancer medications, targeted intravenous anticancer medications, and all others. Using the LifeLink Health Plan Claims Database, we studied and disaggregated trends in use and in insurance and out-of-pocket payments per patient per month and during the first year of chemotherapy.
Results
We found a large increase in the use of targeted intravenous anticancer medications and a gradual increase in targeted oral anticancer medications; targeted therapies accounted for 63% of all chemotherapy expenditures in 2011. Insurance payments per patient per month and in the first year of chemotherapy for targeted oral anticancer medications more than doubled in 10 years, surpassing payments for targeted intravenous anticancer medications, which remained fairly constant throughout. Substitution toward targeted therapies and growth in drug prices both at launch and postlaunch contributed to payer spending growth. Out-of-pocket spending for targeted oral anticancer medications was ≤ half of the amount for targeted intravenous anticancer medications.
Conclusion
Targeted therapies now dominate anticancer drug spending. More aggressive management of pharmacy benefits for targeted oral anticancer medications and payment reform for injectable drugs hold promise. Restraining the rapid rise in spending will require more than current oral drug parity laws, such as value-based insurance that makes the benefits and costs transparent and involves the patient directly in the choice of treatment.
INTRODUCTION
Therapeutic advances in oncology have revolutionized cancer care. Today, approximately two thirds of patients with cancer in the United States survive at least 5 years after diagnosis, compared with approximately half in the 1970s.1 However, the cost of cancer care is projected to reach $173 billion in 2020, up from $125 billion in 2010,2 imposing an immense financial burden on anyone who pays for this care directly or indirectly.3,4 Targeted therapies are among the most prominent examples of the high price tag of technologic innovation in oncology. US sales of targeted anticancer therapies to all payers had grown to $10.4 billion by 2009 and continue to rise.5
Targeted anticancer drugs have been the focus of drug development for the past 15 years.6 Many of the earliest targeted agents were monoclonal antibodies administered intravenously (IV) in an office setting, but more recently, small-molecule oral inhibitors have been developed. Managing the rising cost of cancer care driven by the increase in both the price and quantity of targeted therapy agents is challenging, because these anticancer drugs can be paid under the medical or pharmacy benefit, depending on their mode of administration. Although Medicare has limited options to restrict expenditures on new cancer drugs,7 private insurance has more flexibility in reimbursing providers and managing pharmacy benefits. These tools differ for the medical benefit—where provider-administered drugs are covered—and for the pharmacy benefit, where oral drugs are covered.
Industry reports provide limited recent information about cost trends among private plans for oncology specialty drugs,8 and we are unaware of any study that stratified the trends in cost and use of targeted anticancer therapies by oral and IV agents among patients with cancer in the United States. The distinction between oral and IV agents is important, because cost containment strategies differ by nature of insurance design. The objectives of this study were to examine recent trends in payer cost and use and in out-of-pocket (OOP) spending among privately insured patients receiving oral and IV chemotherapy (which we define as any anticancer drug treatment) and to explain the cost trends by disaggregating them into the increase driven by therapeutic substitution with more expensive classes of drugs versus the increase in drug price over time.
METHODS
Data Source and Study Population
Using the LifeLink Health Plan Claims Database, we identified patients with cancer who underwent chemotherapy between January 1, 2001, and September 30, 2011. The database represents approximately 70 million individuals from > 80 health plans throughout the Untied States and contains information on enrollment records and medical and prescription drug claims. To be classified as a patient with cancer, we required the presence of ≥ three cancer-related International Classification of Diseases (ninth revision) codes (ie, 140.xx to 209.xx, except for 173.xx) on different dates within the first 3 months of the first claim date with a cancer diagnosis. We limited our analysis to patients age < 65 years; claims were incomplete for those age ≥ 65 years, because the LifeLink data do not capture Medicare payments. The receipt of chemotherapy was identified from the use of oncology drugs via either Current Procedural Terminology codes in the medical claims or National Drug Codes in the pharmacy claims. We identified targeted therapy agents (Appendix Table A1, online only) based on the list of drugs included in the National Cancer Institute Targeted Cancer Therapies Fact Sheet,9 with the exclusion of hormonal agents for breast cancer, given our focus on cost of recently approved targeted oncology drugs administered during the definite treatment phase. The institutional review board at the University of Chicago exempted this study for approval.
Oncology Drug Trends
We classified oncology drugs into three types: targeted oral anticancer medications (tOAMs), targeted IV anticancer medications (tIVAMs), and all others. Patients with cancer were categorized as tIVAM users if they had any medical claim with a Current Procedural Terminology code indicating a tIVAM. Similarly, patients were grouped as tOAM users if they had any pharmacy claim with a National Drug Code indicating a tOAM. For those who had claims indicating the use of both tIVAMs and tOAMs, we applied the intent-to-treat approach and assigned patients to the drug type that was observed first. We described trends in use of oncology drugs as the proportion of patients by drug type and the proportion of oncology drug–related insurance expenditure on each drug type.
Cost Measures
The LifeLink data collect three financial variables: charge, paid, and allowed. Charge is the amount that was billed to a health plan, paid is the amount actually paid by the plan for a service, and allowed is the amount the plan allows for a specific service and includes the paid amount plus any patient cost sharing (eg, copayment). Patient OOP payments were calculated as allowed minus paid.10,11 We measured the economic burden of anticancer drugs in terms of cancer drug expenditures per patient per month (PPPM) and first-year drug expenditure per patient using paid and OOP payment for payers and patients, respectively. The PPPM amount was calculated by summing paid or OOP payment associated with claims for anticancer drugs divided by months of exposure (ie, total number of months patient with cancer was treated with any anticancer drugs). First-year drug expenditure included all chemotherapy drugs within 12 months of the initiation of chemotherapy; this measure ended with patients initiating chemotherapy in 2010, our last complete year of data, to ensure 12 months of continuous enrollment after treatment initiation. Payments for ancillary services were excluded from the analysis. We present cost trends for all patients combined as well as by cancer drug type. All cost estimates were normalized to 2013 US dollars using the medical care component of the consumer price index (MC-CPI).
Statistical Analysis
To determine whether the observed trends were statistically significant, we performed Cochran-Armitage tests for use trends and regressions for cost trends. Because of the skewness of the cost data, we estimated generalized linear models with a gamma distribution and log link to test the trends for each drug category. We used SAS software (version 9.3; SAS Institute, Cary, NC) and STATA software (version 13.1; STATA, College Station, TX) to conduct all analyses; we reported statistical significance as P < .05.
Decomposition Analysis to Disaggregate Sources of Increase in Cancer Drug Expenditures
For each targeted therapy agent, we used the PPPM in the year the drug was approved by the US Food and Drug Administration as the proxy for launch price. We then applied a decomposition technique that was conceptually similar to the Oaxaca decomposition (Appendix, online only)12 to determine the proportional increase in cancer drug expenditures over time attributable to each of the following three factors: increased use of (higher priced) targeted therapies relative to nontargeted agents, higher launch prices over time for newly approved targeted agents, and increases in targeted drug prices subsequent to launch. To capture the increasing availability of tOAMs since 2005, we explored the increase in expenditures in two time periods: 2001 to 2005 versus 2005 to 2010.
RESULTS
We identified 200,168 nonelderly patients with cancer who received chemotherapy between January 1, 2001, and September 30, 2011. The average age was 52 years (standard deviation, 10.7) and was similar across the three groups (Table 1). Compared with tOAM users, the percentage of women was significantly higher among tIVAM and nontargeted therapy users. This most likely reflects the types of cancer with therapeutic indication for currently approved tOAMs, such as chronic myelogenous leukemia (CML), acute lymphoblastic leukemia, non–small-cell lung cancer, and renal cell carcinoma, which have higher incidence in men, and IV human epidermal growth factor receptor 2–targeting drugs for female breast cancer. The geographic distribution also differed across groups.
Table 1.
Characteristics of Study Cohort by Type of Chemotherapy Agent
| Characteristic | tIVAMs | tOAMs | Nontargeted Agents | P |
|---|---|---|---|---|
| Total patients | 39,503 | 13,313 | 147,352 | |
| Age, years | ||||
| Mean | 52.94 | 53.15 | 51.81 | |
| SD | 8.83 | 9.62 | 11.21 | |
| Sex, % | < .001 | |||
| Male | 39.23 | 53.94 | 36.96 | |
| Female | 60.77 | 46.06 | 63.04 | |
| Region, % | < .001 | |||
| East | 18.02 | 23.58 | 18.94 | |
| Midwest | 27.57 | 28.61 | 30.48 | |
| South | 37.03 | 33.70 | 35.73 | |
| West | 17.38 | 14.11 | 14.84 | |
| Top five cancers, %* | Breast (174), 29.5 | ML (205), 16.6† | Breast (174), 30.6 | |
| Lymphoma (202), 24.7 | Lung (162), 16.2 | Lung (162), 10.7 | ||
| Colon (153), 9.1 | MM (203), 12.0 | Colon (153), 7.4 | ||
| Lung (162), 4.5 | Kidney (189), 9.2 | Anus (154), 5.9 | ||
| ALL (204), 4.1 | Pancreas (157), 5.5 | Bladder (188), 4.9 |
NOTE. Analysis conducted using LifeLink Health Plan Claims Database from January 2001 to September 2011.
Abbreviations: ALL, acute lymphoblastic leukemia; ICD-9, International Classification of Diseases (ninth revision); ML, myeloid leukemia; MM, multiple myeloma; SD, standard deviation; tIVAM, targeted intravenous anticancer medication; tOAM, targeted oral anticancer medication.
ICD-9 code shown in parentheses.
Including acute myeloid leukemia (ICD-9 code 205.0) and chronic myelogenous leukemia (ICD-9 code 205.1).
Figure 1A shows an increase in the proportion of patients with cancer treated with targeted therapies. The proportion of patients who received tIVAMs increased from 9% in 2001 to 28% in 2011 (P < .001), whereas that of tOAMs grew from 2% in 2001 to 14% in 2011 (P < .001). The high price tag associated with these novel oncology drugs is evident from Figure 1B, which illustrates an increase in insurance claim payments for tIVAMs and tOAMs. Although the proportion of patients treated with these drugs increased from 13% in 2001 to 43% in 2011, the proportion of oncology insurance payments allocated to them grew from 22% to 63% in the same time period. Figure 1B also shows an increase in the proportion of payments allocated to tIVAMs as well as in the proportion allocated to tOAMs, growing from 2% in 2001 to 25% in 2011 (P < .001).
Fig 1.
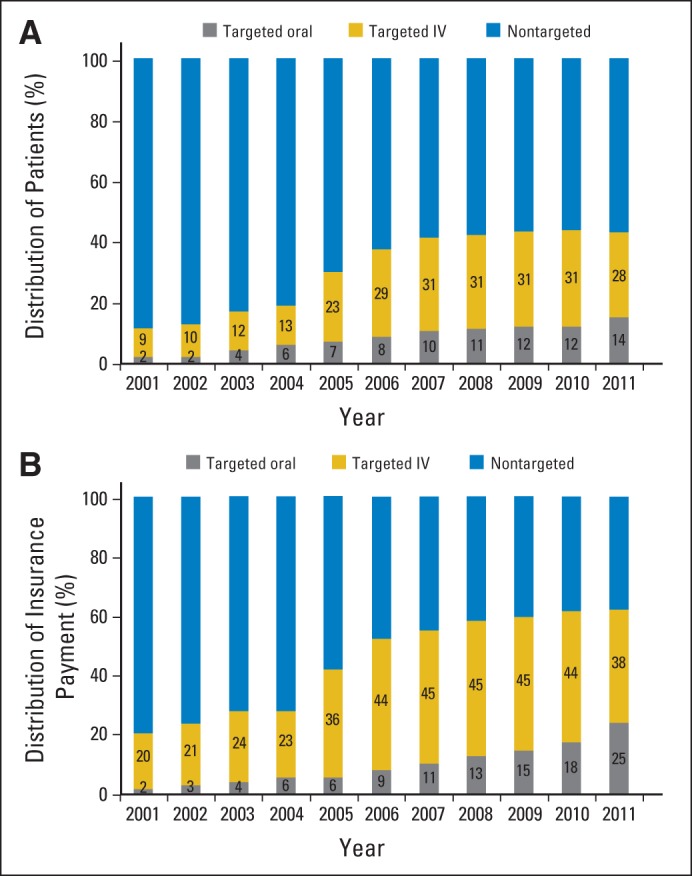
Distribution of (A) patients and (B) insurance payments by type of chemotherapy agent from 2001 to 2011. Analysis conducted using LifeLink Health Plan Claims Database from January 2001 to September 2011. IV, intravenous.
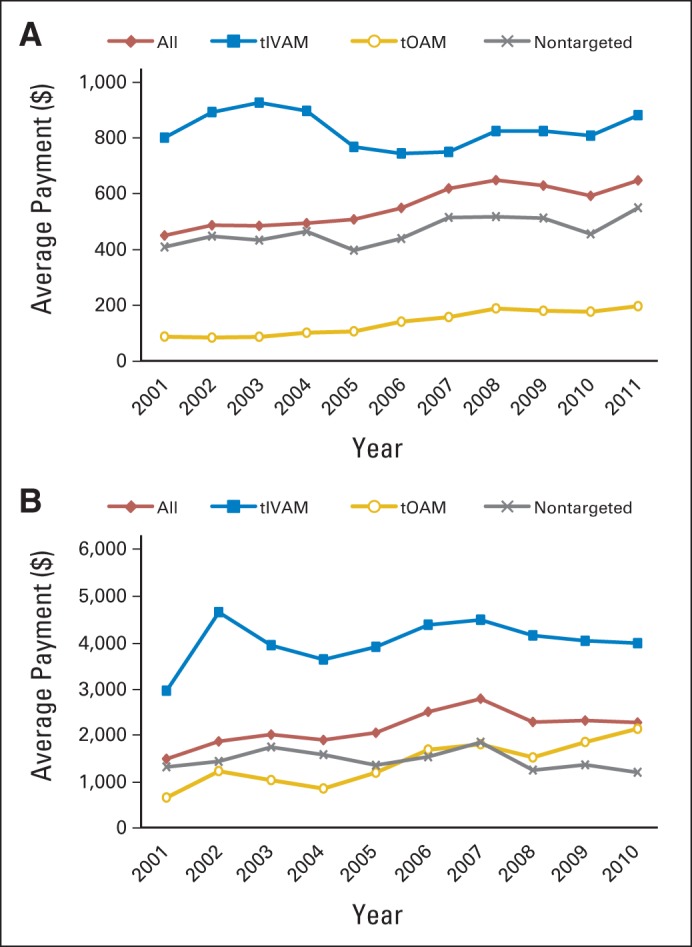
Table 2 and Figure 2A summarize the paid amount PPPM. Overall, expenditures on oncology drugs among private insurance plans increased from $3,349 to $5,187 PPPM (55% increase) from 2001 to 2011. Until 2011, insurance payments PPPM were highest among patients treated with tIVAMs, ranging from $7,190 in 2001 to $7,001 in 2011 (P = .092). However, payments for tOAM-receiving patients more than doubled during the 11-year time period, growing from $3,381 PPPM in 2001 to $7,370 in 2011 (P < .001) and surpassing tIVAM spending in the final year. Payments for patients receiving nontargeted chemotherapy showed signs of decrease beginning in 2004, reaching slightly > $2,600 in 2011. Figure 2B compares the real versus projected PPPM trend for tIVAMs and tOAMs had the rate of increase in drug prices after launch been equal to the MC-CPI. It shows that the impact of sustained price increases postlaunch on insurance payments PPPM was more noticeable for tOAM users. Figure 2C illustrates the observed trend of insurance payments for cancer drugs during the entire first year of chemotherapy. Using the longer time window reduced the relative spending difference between tIVAMs and tOAMs because of the longer treatment duration associated with tOAMs. Comparison of observed and projected trends (Fig 2D) showed that annual payments per patient would have been approximately $14,000 and $9,000 lower for patients who started tOAMs and tIVAMs in 2010, respectively, had price increases been limited to the MC-CPI.
Table 2.
Insurance and Out-of-Pocket Payment PPPM by Type of Chemotherapy Agent: 2001 to 2011
| Year | tIVAMs |
tOAMs |
Nontargeted Agents |
|||
|---|---|---|---|---|---|---|
| Mean | SD | Mean | SD | Mean | SD | |
| Insurance Payment PPPM | ||||||
| 2001 | 7,190 | 6,869 | 3,381 | 1,211 | 2,781 | 3,068 |
| 2002 | 7,631 | 6,913 | 3,768 | 2,290 | 2,929 | 3,096 |
| 2003 | 7,282 | 5,456 | 3,143 | 2,431 | 2,857 | 3,040 |
| 2004 | 7,463 | 5,763 | 3,327 | 4,270 | 3,152 | 3,478 |
| 2005 | 6,522 | 5,430 | 3,823 | 7,535 | 2,937 | 3,149 |
| 2006 | 6,540 | 5,019 | 5,150 | 4,079 | 2,619 | 2,889 |
| 2007 | 6,729 | 4,993 | 5,065 | 3,551 | 2,704 | 3,199 |
| 2008 | 7,059 | 5,457 | 5,710 | 4,194 | 2,678 | 3,591 |
| 2009 | 7,036 | 5,452 | 6,054 | 4,163 | 2,709 | 3,721 |
| 2010 | 7,171 | 5,767 | 6,652 | 4,483 | 2,692 | 3,635 |
| 2011 | 7,001 | 6,058 | 7,370 | 4,888 | 2,684 | 4,336 |
| P* | .092 | < .001 | < .001 | |||
| Out-of-Pocket Payment PPPM | ||||||
| 2001 | 762 | 1,947 | 88 | 201 | 409 | 948 |
| 2002 | 897 | 1,995 | 85 | 198 | 447 | 1,538 |
| 2003 | 931 | 2,314 | 88 | 216 | 433 | 1,526 |
| 2004 | 903 | 2,086 | 103 | 333 | 464 | 1,148 |
| 2005 | 769 | 2,249 | 108 | 367 | 397 | 1,021 |
| 2006 | 738 | 2,107 | 143 | 496 | 439 | 1,346 |
| 2007 | 754 | 2,044 | 159 | 452 | 514 | 1,311 |
| 2008 | 849 | 2,474 | 190 | 605 | 517 | 1,316 |
| 2009 | 850 | 2,157 | 181 | 535 | 512 | 1,588 |
| 2010 | 835 | 2,658 | 178 | 525 | 455 | 1,469 |
| 2011 | 908 | 2,255 | 198 | 578 | 549 | 1,623 |
| P* | .104 | < .001 | < .001 | |||
NOTE. Analysis conducted using LifeLink Health Plan Claims Database from January 2001 to September 2011.
Abbreviations: PPPM, per patient per month; SD, standard deviation; tIVAM, targeted intravenous anticancer medication; tOAM, targeted oral anticancer medication.
P value for statistical significance of time trend variable in generalized linear model.
Fig 2.

Average insurance payment per patient per month by type of chemotherapy agent, (A) real and (B) real (solid lines) versus projected (dashed lines); insurance payment for cancer drugs in first year of chemotherapy by type of chemotherapy agent, (C) real, and (D) real (solid lines) versus projected (dashed lines). Analysis conducted using LifeLink Health Plan Claims Database from January 2001 to September 2011. tIVAM, targeted intravenous anticancer medication; tOAM, targeted oral anticancer medication.
OOP payments PPPM (Table 2; Fig 3A) illustrated a different pattern than paid PPPM in that although the overall trend showed an increase in the economic burden of oncology drugs among nonelderly patients with private insurance (from $450 per month in 2001 to $647 per month in 2011), OOP payments PPPM for tOAM users was lower than for tIVAM users. On average, OOP payments were $164 PPPM for tOAM users compared with $824 for tIVAM users. Taking into consideration the longer treatment duration of tOAMs, Figure 3B shows that although the OOP payment for the first year of chemotherapy for tOAM users remained lower than that for tIVAM users, it increased more than threefold from $642 in 2001 to $2,124 in 2010, eventually surpassing OOP payment by patients receiving nontargeted chemotherapy.
Fig 3.
Average out-of-pocket payment (A) per patient per month by type of chemotherapy agent and (B) for cancer drugs in first year of chemotherapy by type of chemotherapy agent. Analysis conducted using LifeLink Health Plan Claims Database from January 2001 to September 2011. tIVAM, targeted intravenous anticancer medication; tOAM, targeted oral anticancer medication.
Table 3 summarizes the decomposition analysis to disaggregate the sources of increase in per-patient first-year cancer drugs expenditure. For both time periods (2001 to 2005 and 2005 to 2010), switching to more expensive classes of drugs accounted for the large majority of cost increases over time. Postlaunch price increases contributed 10% to 11% of spending increases during the two periods, and the role of launch price increases went from 6% to 15% of spending growth.
Table 3.
Sources of Increase in Cancer Drug Expenditures From 2001 to 2005 and 2005 to 2010
| Source | Expenditure, $ | % |
|---|---|---|
| Total increase between 2001 and 2005 | 7,765.2 | 100 |
| Increase in use of targeted therapy agents | 6,534.4 | 84 |
| Increase in launch price of new targeted therapy agents | 432.4 | 6 |
| Increase in price of targeted therapy agents after launch | 798.4 | 10 |
| Total increase between 2005 and 2010 | 6,846.5 | 100 |
| Increase in use of targeted therapy agents | 5,091.6 | 74 |
| Increase in launch price of new targeted therapy agents | 1,016.0 | 15 |
| Increase in price of targeted therapy agents after launch | 738.9 | 11 |
NOTE. Analysis conducted using LifeLink Health Plan Claims Database from January 2001 to September 2011.
DISCUSSION
Targeted therapies are increasingly used in cancer care,8,10,13 but they are imposing a growing financial burden on privately insured patients with cancer and their insurers. Our results demonstrate a large increase in the use of tIVAMs from 2001 to 2011. Per-patient payments for tIVAMs remained at a constant high level of approximately $7,000 per month and $65,000 annually by 2010. By contrast, use rates for tOAMs rose only gradually, remaining half the rate of tIVAMs by 2011, but payments PPPM and annual payments per patient more than doubled over 10 years. Accordingly, total drug expenditures for patients receiving either type of targeted therapy rose to 63% of all anticancer drug expenditures. tOAMs comprised a growing share, reaching 25% of all expenditures in 2011. Finally, OOP spending rose gradually for all drug types, ranging from approximately $200 PPPM and $2,100 annually for tOAMs to roughly $900 PPPM and $4,000 annually for tIVAMs in 2011. Overall, average insurance payments per patient within the first year of chemotherapy increased by > $14,000 in the 10-year time window. Although the majority of this increase was driven by therapeutic switching to targeted agents, higher launch prices of new drugs accounted for $1,450 of the increase, and sustained growth in drug prices postlaunch contributed to another $1,550 increase, with launch price growth becoming more important during the years 2005 to 2010.
The increase in use of tIVAMs coincided with a period of major innovation involving this drug class. Although the increasing use of tIVAMs may represent therapeutic substitution for greater efficacy, it could in part be the result of financial incentives corresponding to changes in reimbursement for infused drugs among payers around this time.13,14 An alternative explanation is the desire to use (and receive) the newest drugs available.
PPPM payments for tIVAMs, although stable, remained much higher than payments for other cancer drugs for much of the study period. tIVAMs have traditionally been covered under the medical benefit in private plans, with reimbursement largely following a buy-and-bill system similar to Medicare but with more generous margins as a percentage of drug average sales price.13 Under buy and bill, providers are paid drug administration margins that are a percentage of the drug price, so physician take-home earnings are larger when more drugs and more expensive drugs are used. Two general reforms could avoid these inflationary incentives. First, as payers are increasingly doing,8 tIVAMs can be moved from being purchased from providers under the medical benefit to being purchased from specialty pharmacies under the pharmacy benefit (with providers paid only administration fees). Alternatively, buy and bill could be reformed by creating incentives for providers to use lower-cost, higher-value drugs—such as Avastin (bevacizumab; Genentech, South San Francisco, CA) over Zaltrap (ziv-aflibercept; Sanofi, Paris, France) for metastatic colon cancer, to cite a well-publicized example15—through clinical pathways. Within one oncology provider network, use of revenue-neutral clinical pathways was associated with equal survival and 30% to 35% savings for patients with colon or lung cancer,16 and a health plan program supplementing buy and bill with bonus payments for following clinical pathways for patients with breast, colon, or lung cancer produced an estimated $30.9 million in annual savings.17 The new Medicare Oncology Care Model payments18 and the proposed replacements for buy-and-bill by the American Society for Clinical Oncology (ASCO)19 show that payment reforms are occurring, and at least some oncologists are prepared for them.
Our findings pinpoint rising costs of tOAMs in particular as a major source of the rising cost of anticancer drugs. Although recent studies have analyzed increases in drug launch prices,20 we find that sustained price increases after launch were more pronounced among tOAMs. By our estimates, monthly insurance payments for tOAM users in 2010 would have been $2,000 lower had postlaunch price growth been limited to the MC-CPI. This finding echoes a recent editorial decrying the increasing prices of tOAMs for CML.21 The entry of large numbers of tOAMs for cancers including CML, acute lymphoblastic leukemia, non–small-cell lung cancer, and renal cell carcinoma has not yet led to significant price competition, with these cancers having among the highest drug treatment costs. However, each of these cancers has at least one stage or line-of-therapy indication in which ≥ two tOAMs are considered clinically equivalent alternatives under National Comprehensive Cancer Network practice guidelines.22–25 Thus, private payers could use tiered formularies and other standard tools of managed care in pharmacy benefits that have been successful in high-priced specialty oral drug classes, such as hepatitis C antivirals, using the leverage of preferential formulary placement to extract significant rebates from list prices for ≥ one of the clinically equivalent compounds and direct use to these higher-value drugs.26,27 However, payers and specialty pharmacies to date have been reluctant to manage costs of tOAMs to any degree, largely because of opposition from patients with cancer and oncologists.28 The ASCO initiative to incorporate costs into future treatment guidelines29 may pave the way for greater acceptance of payer pressure on low-value tOAMs by all stakeholders.
Patients bear a significant portion of the cost of cancer drugs, with estimates of the OOP cost of oral oncolytics of $15 to $500 per claim10 and $108 per month30 among privately insured nonelderly patients with CML. The OOP payments for tOAMs estimated from our study were in line with these earlier estimates. Our finding that OOP payments PPPM for tOAMs were much lower than for tIVAMs—only half as large over a 1-year timeframe (accounting for longer treatment duration with tOAMs)—is surprising and challenges conventional wisdom. This could be driven by the type of health plans included in the LifeLink data. Although we do not have information on the benefit designs of these plans, it is possible that this database reflects a cohort of well-insured patients with cancer. Patient advocacy groups have succeeded in passing oral cancer drug parity legislation to equalize generosity of coverage between tOAMs and other cancer drugs in more than 30 states.31,32 Our observations on OOP payments suggest that the effects of oral drug parity laws may be limited for well-insured patients with cancer whose cost-sharing requirement under pharmacy benefits consists of a fixed copayment without the coinsurance that is commonly employed in medical benefits. Value-based insurance designs with tiered formularies, which make the benefits and costs transparent and involve the patient directly in the choice of treatment, offer an alternative to parity laws that would maintain patient financial protection for high-value therapies33 but do more to reduce drug cost growth by imposing prohibitive financial consequences for choosing low-value therapies.34,35
In summary, the shift toward treatment with targeted therapies and price inflation at all stages of the drug lifecycle documented in our study highlight the need for creative use of value-based managed care tools by private payers to curb the escalating cost of anticancer drugs. For infused drugs, clinical pathways have been proven to increase value; more thoroughgoing replacements for buy and bill remain to be tested both politically and for their impact on medical care. For oral drugs, value-based insurance designs with tiered formularies can harness price competition when multiple therapeutic options are available to induce reductions in drug prices for insurance plans and patient OOP cost.
Appendix
Decomposition Method to Identify Sources of Increase in Cancer Drug Expenditures
Letting Yit be first-year cancer drug expenditures for patient i in time t, the average expenditure in time t, E(Yt), can be calculated as the weighted average of the proportion of patients in each drug class (Pjt, j = 1, 2, and 3 for targeted intravenous anticancer medications, targeted oral anticancer medications, and nontargeted drugs) and the average expenditure for patients in the corresponding drug class (Ejt, j = 1-3); that is, E(Yt) = ∑(Pjt × Ejt). Denoting the average expenditure at time t = 1 calculated based on launch prices for medication in drug class j as E j1*, the decomposition technique can then disaggregate the average expenditure in two time periods (time 1 and 0) as follows:
E(Y1) – E(Y0)
= ∑(Pj1 × Ej1) – ∑(Pj0 × Ej0)
= ∑(Pj1 × Ej1) – ∑(Pj0 × Ej0) ± ∑(Pj0 × Ej1) (first decomposition)
= ∑ {(Pj1 − Pj0) × Ej1} + ∑{Pj0 × (Ej1 − Ej0)}
= (changes in use) + (changes in drug class-specific expenditures)
= ∑ {(Pj1 − Pj0) × Ej1} + ∑{Pj0 × (E j1 − Ej0)} ± ∑(Pj0 × Ej1*) (second decomposition)
= ∑ {(Pj1 − Pj0) × Ej1} + ∑{Pj0 × (Ej1* − Ej0)} + ∑{Pj0 (Ej1 – Ej1*)}
= (change in use) + (change in drug class-specific expenditure driven by launch prices) + (change in drug class-specific expenditure driven by increase in drug prices after launch)
Note that launch price and postlaunch price increases for nontargeted agents were negligible and not reported in the analysis in this report.
Table A1.
Targeted Therapy Drugs for Cancer Approved Before September 30, 2011
| Drug | Year of FDA Approval | Approved Indication |
|---|---|---|
| Targeted IV | ||
| Rituximab | 1997 | NHL, CLL |
| Trastuzumab | 1998 | Breast cancer, gastric cancer, esophageal cancer/HER2, adenocarcinoma of stomach or gastroesophageal junction |
| Alemtuzumab | 2001 | CLL |
| Ibritumomab tiuxetan | 2002 | NHL |
| Gemtuzumab | 2000 | AML |
| Tositumomab | 2003 | NHL |
| Bevacizumab | 2004 | Colorectal cancer, lung cancer, GBM, RCC, brain cancer |
| Cetuximab | 2004 | Colorectal cancer, head and neck cancer |
| Panitumumab | 2006 | Colorectal cancer |
| Temsirolimus | 2007 | RCC |
| Denileukin diftitox | 1999 | T-cell lymphoma |
| Bortezomib | 2005 | Lymphoma, multiple myeloma |
| Ofatumumab | 2009 | CLL |
| Pralatrexate | 2009 | Lymphoma |
| Romidepsin | 2009 | Cutaneous T-cell lymphoma |
| Brentuximab vedotin | 2011 | Hodgkin lymphoma, ALCL |
| Ipilimumab | 2011 | Melanoma |
| Targeted Oral | ||
| Imatinib | 2001 | CML, dermatofibrosarcoma protuberans, GI stromal tumor, myelodysplastic and myeloproliferative disorders |
| Erlotinib | 2004 | Lung cancer, pancreatic cancer |
| Lenalidomide | 2005 | Multiple myeloma, lymphoma |
| Gefitinib | 2003 | Non–small-cell lung cancer |
| Sorafenib | 2005 | RCC, liver cancer, thyroid cancer |
| Dasatinib | 2006 | CML |
| Vorinostat | 2006 | Lymphoma |
| Sunitinib | 2006 | RCC, GI stromal tumor, pancreatic cancer |
| Lapatinib | 2007 | Breast cancer |
| Nilotinib | 2007 | CML |
| Everolimus | 2009 | RCC, breast cancer, pancreatic cancer |
| Pazopanib | 2009 | RCC, soft tissue sarcoma |
| Vemurafenib | 2011 | Melanoma |
| Vandetanib | 2011 | Thyroid cancer |
Abbreviations: ALCL, anaplastic large-cell lymphoma; AML, acute myelogenous leukemia; CLL, chronic lymphocytic leukemia; CML, chronic myelogenous leukemia; FDA, US Food and Drug Administration; GBM, glioblastoma multiforme; HER2, human epidermal growth factor receptor 2; NHL, non Hodgkin lymphoma; RCC, renal cell cancer.
Support information appears at the end of this article.
The statements, findings, conclusions, views, and opinions contained and expressed in this article are based in part on data obtained under license from the IMS Health LifeLink Health Plan Claims Database (2001 to 2011); these statements, findings, conclusions, views, and opinions contained and expressed herein are not necessarily those of IMS Health or any of its affiliated or subsidiary entities.
Authors' disclosures of potential conflicts of interest are found in the article online at www.jco.org. Author contributions are found at the end of this article.
Support
Supported in part by Grants No. R01 HS018535 (Y.-C.T.S., F.S.) and R01 HS020263 (Y.-C.T.S) from the Agency for Healthcare Research and Quality; by the University of Chicago Cancer Research Foundation Women's Board (Y.-C.T.S.); by Grant No. R01 CA177562 and Core Grant No. P30006979 from the National Cancer Institute, Contract No. 4362 from the Patient Centered Outcomes Research Institute, and by Grant No. NR014050 from the National Institute of Nursing Research (T.J.S.); by a Young Investigator Award from the National Comprehensive Cancer Network to study the implications of cost discussions between patients with cancer and providers (R.J.K.); and by independent Grant No. 11703561 from Pfizer (D.M.G.).
AUTHORS' DISCLOSURES OF POTENTIAL CONFLICTS OF INTEREST
Disclosures provided by the authors are available with this article at www.jco.org.
AUTHOR CONTRIBUTIONS
Conception and design: Ya-Chen Tina Shih, Fabrice Smieliauskas, Daniel M. Geynisman
Collection and assembly of data: Ya-Chen Tina Shih
Data analysis and interpretation: All authors
Manuscript writing: All authors
Final approval of manuscript: All authors
AUTHORS' DISCLOSURES OF POTENTIAL CONFLICTS OF INTEREST
Trends in the Cost and Use of Targeted Cancer Therapies for the Privately Insured Nonelderly: 2001 to 2011
The following represents disclosure information provided by authors of this manuscript. All relationships are considered compensated. Relationships are self-held unless noted. I = Immediate Family Member, Inst = My Institution. Relationships may not relate to the subject matter of this manuscript. For more information about ASCO's conflict of interest policy, please refer to www.asco.org/rwc or jco.ascopubs.org/site/ifc.
Ya-Chen Tina Shih
Consulting or Advisory Role: Bayer
Fabrice Smieliauskas
No relationship to disclose
Daniel M. Geynisman
Consulting or Advisory Role: Prometheus Laboratories
Honoraria: Pfizer
Research Funding: Pfizer
Ronan J. Kelly
Consulting or Advisory Role: Novartis, Eli Lilly, Clovis Oncology
Thomas J. Smith
No relationship to disclose
REFERENCES
- 1.American Society of Clinical Oncology. The state of cancer care in America, 2014: A report by the American Society of Clinical Oncology. J Oncol Pract. 2014;10:119–142. doi: 10.1200/JOP.2014.001386. [DOI] [PubMed] [Google Scholar]
- 2.Mariotto AB, Yabroff KR, Shao Y, et al. Projections of the cost of cancer care in the United States: 2010-2020. J Natl Cancer Inst. 2011;103:117–128. doi: 10.1093/jnci/djq495. [DOI] [PMC free article] [PubMed] [Google Scholar]
- 3.Shih YC, Ganz PA, Aberle D, et al. Delivering high-quality and affordable care throughout the cancer care continuum. J Clin Oncol. 2013;31:4151–4157. doi: 10.1200/JCO.2013.51.0651. [DOI] [PMC free article] [PubMed] [Google Scholar]
- 4.Kelly RJ, Smith TJ. Delivering maximum clinical benefit at an affordable price: Engaging stakeholders in cancer care. Lancet Oncol. 2014;15:e112–e118. doi: 10.1016/S1470-2045(13)70578-3. [DOI] [PubMed] [Google Scholar]
- 5.Aggarwal S. Targeted cancer therapies. Nat Rev Drug Discov. 2010;9:427–428. doi: 10.1038/nrd3186. [DOI] [PubMed] [Google Scholar]
- 6.Sledge GW., Jr What is targeted therapy? J Clin Oncol. 2005;23:1614–1615. doi: 10.1200/JCO.2005.01.016. [DOI] [PubMed] [Google Scholar]
- 7.Bach PB. Limits on Medicare's ability to control rising spending on cancer drugs. N Engl J Med. 2009;360:626–633. doi: 10.1056/NEJMhpr0807774. [DOI] [PubMed] [Google Scholar]
- 8.EMD Serono. EMD Serono Specialty Digest (ed 10) Rockland, MA: EMD Serono; 2014. [Google Scholar]
- 9.National Cancer Institute. Targeted cancer therapies. http://www.cancer.gov/cancertopics/factsheet/Therapy/targeted.
- 10.Raborn ML, Pelletier EM, Smith DB, et al. Patient out-of-pocket payments for oral oncolytics: Results from a 2009 US claims data analysis. J Oncol Pract. 2012;8(suppl):9s–15s. doi: 10.1200/JOP.2011.000516. [DOI] [PMC free article] [PubMed] [Google Scholar]
- 11.Dorn SD, Wei D, Farley JF, et al. Impact of the 2008-2009 economic recession on screening colonoscopy utilization among the insured. Clin Gastroenterol Hepatol. 2012;10:278–284. doi: 10.1016/j.cgh.2011.11.020. [DOI] [PMC free article] [PubMed] [Google Scholar]
- 12.Oaxaca R. Male-female wage differentials in urban labor markets. Int Econ Rev. 1973;14:693–709. [Google Scholar]
- 13.Magellan Pharmacy Solutions. 2012 Medical Pharmacy and Oncology Trend Report. https://www1.magellanmedicaid.com/resource-center/medical-pharmacy-and-oncology-trend-report.aspx.
- 14.Jacobson M, Earle CC, Price M, et al. How Medicare's payment cuts for cancer chemotherapy drugs changed patterns of treatment. Health Aff (Millwood) 2010;29:1391–1399. doi: 10.1377/hlthaff.2009.0563. [DOI] [PubMed] [Google Scholar]
- 15.Bach PB, Saltz LB, Wittes RE. In cancer care, cost matters. New York Times. 2012. Oct 14, p. A25. http://www.nytimes.com/2012/10/15/opinion/a-hospital-says-no-to-an-11000-a-month-cancer-drug.html.
- 16.Neubauer MA, Hoverman JR, Kolodziej M, et al. Cost effectiveness of evidence-based treatment guidelines for the treatment of non–small-cell lung cancer in the community setting. J Oncol Pract. 2010;6:12–18. doi: 10.1200/JOP.091058. [DOI] [PMC free article] [PubMed] [Google Scholar]
- 17.Kreys ED, Koeller JM. Documenting the benefits and cost savings of a large multistate cancer pathway program from a payer's perspective. J Oncol Pract. 2013;9:e241–e247. doi: 10.1200/JOP.2012.000871. [DOI] [PubMed] [Google Scholar]
- 18.Barkley R. Key features of the CMMI oncology care model (OCM) http://obroncology.com/obrgreen/article/key-features-of-the-CMMI-Oncology-Care-Model.
- 19.American Society of Clinical Oncology. Potential approaches to sustainable, long-lasting payment reform in oncology. J Oncol Pract. 2014;10:254–258. doi: 10.1200/JOP.2014.001267. [DOI] [PubMed] [Google Scholar]
- 20.Howard DH, Conti RM. Are new drugs more expensive than old ones? Trends in the benefit-adjusted launch prices of anticancer drugs, 1995-2013. J Clin Oncol. 2014;32(suppl 15s):416s. abstr 6525. [Google Scholar]
- 21.Experts in Chronic Myeloid Leukemia. The price of drugs for chronic myeloid leukemia (CML) is a reflection of the unsustainable prices of cancer drugs: From the perspective of a large group of CML experts. Blood. 2013;121:4439–4442. doi: 10.1182/blood-2013-03-490003. [DOI] [PMC free article] [PubMed] [Google Scholar]
- 22.National Comprehensive Cancer Network: NCCN clinical practice guidelines in oncology: Chronic myelogenous leukemia (version 1.2015) http://www.nccn.org/professionals/physician_gls/pdf/cml.pdf. [DOI] [PubMed]
- 23.National Comprehensive Cancer Network. NCCN clinical practice guidelines in oncology: Acute lymphoblastic leukemia (version 1.2014) http://www.nccn.org/professionals/physician_gls/pdf/all.pdf.
- 24.National Comprehensive Cancer Network. NCCN clinical practice guidelines in oncology: Non-small cell lung cancer (version 2.2015) http://www.nccn.org/professionals/physician_gls/pdf/nscl.pdf. [DOI] [PMC free article] [PubMed]
- 25.National Comprehensive Cancer Network. NCCN clinical practice guidelines in oncology: Kidney cancer (version 3.2015) http://www.nccn.org/professionals/physician_gls/pdf/kidney.pdf. [DOI] [PubMed]
- 26.Navarro RP, Stern CS, Haley R. Prescription drug benefits in managed care. In: Kongstvedt PR, editor. Essentials of Managed Health Care (ed 6) Burlington, MA: Jones and Bartlett Learning; 2012. [Google Scholar]
- 27.Pollack A. AbbVie deal heralds changed landscape for hepatitis drugs. http://www.nytimes.com/2014/12/22/business/pharmacy-deal-heralds-changed-landscape-for-hepatitis-drugs.html.
- 28.Maas A. Advanced RCC gains scrutiny as more drugs are approved for it. Specialty Pharmacy News. 2012;9 [Google Scholar]
- 29.Cavallo J. ASCO develops new strategy to increase value in cancer care. http://www.ascopost.com/issues/may-15,-2014/asco-develops-new-strategy-to-increase-value-in-cancer-care.aspx.
- 30.Dusetzina SB, Winn AN, Abel GA, et al. Cost sharing and adherence to tyrosine kinase inhibitors for patients with chronic myeloid leukemia. J Clin Oncol. 2014;32:306–311. doi: 10.1200/JCO.2013.52.9123. [DOI] [PubMed] [Google Scholar]
- 31.Printz C. Drug parity legislation: States, organizations seek to make oral cancer drugs more affordable. Cancer. 2014;120:313–314. doi: 10.1002/cncr.28556. [DOI] [PubMed] [Google Scholar]
- 32.Patients Equal Access Coalition. Oral chemotherapy access legislative landscape. http://peac.myeloma.org/oral-chemo-access-map/
- 33.Fendrick AM, Buxbaum J, Westrich K. Supporting consumer access to specialty medications through value-based insurance design. http://www.npcnow.org/vbid14.
- 34.Berndt ER, McGuire T, Newhouse JP. A primer on the economics of prescription pharmaceutical pricing in health insurance markets. http://www.nber.org/papers/w16879.
- 35.Baghdadi R. The Part D premium lesson for exchanges. https://www.pharmamedtechbi.com/publications/rpm-report/first-take/2014/3/blum.