

Abstract
Oxidation of unsaturated lipids in cellular membranes has been shown to cause severe membrane damage and potentially cell death. The presence of oxidized lipid species in the membrane is known to cause changes in membrane properties, such as decreased fluidity. This study uses giant unilamellar vesicles (GUVs) to measure passive transport across membranes containing defined concentrations of oxidized lipid species. GUVs consisting of a saturated phospholipid, an unsaturated phospholipid, and cholesterol were used as model membranes. By replacing defined amounts of the unsaturated lipid with a corresponding oxidized product, the oxidation process could be mimicked, yielding vesicles of varying oxidized lipid concentration. Oxidized lipid concentration was varied from 0 mol% to 18 mol% of the total lipid concentration. Passive transport of PEG12-NBD, an uncharged fluorescent molecule, was measured using a microfluidic trap to capture the GUVs and spinning disk confocal microscopy (SDCM) to track the transport of a fluorescent species in the equatorial plane of each GUV. Membrane permeability was determined by fitting the resulting concentration profiles to a finite difference model of diffusion and permeation around and through the membrane. Experiments showed three permeability regimes. Without oxidation, transport was slow, with a measured permeability on the order of 1.5×10⁻⁶ cm/s. At 2.5–10% oxidized species permeation was fast (1.5×10⁻⁵ cm/s). Above 12.5% oxidized species, the bilayer was disrupted by the formation of pore defects. As passive transport is an important mechanism for drug delivery, understanding the relationship between oxidation and permeation could provide insight into the pharmaceutical characteristics of tissues with oxidative damage.
Introduction
The oxidation of phospholipids has become a recent topic of interest within the field of membrane biophysics. The process of lipid oxidation has been associated with tubule formation and membrane budding,1 increases in membrane surface area,2, 3 decreases in membrane fluidity,4 and the promotion of phase separation.5, 6 In medical research, the oxidation process has been linked with physiological conditions such as atherosclerosis7 and aging,8 as well as being used with photodynamic therapy for tumor treatment.6
One phenomenon that has not been examined in detail is the effect of phospholipid oxidation on the permeability of the membrane. Passive diffusion, while not the only mechanism by which molecules can cross a membrane, represents a generic pathway by which drugs and environmental toxins can enter a cell.9, 10 As such, understanding and measuring how oxidation of the lipid bilayer affects permeability is key to understanding how oxidation alters the barrier properties of the membrane, potentially leading to cell damage.
To measure the effect of lipid oxidation on bilayer permeability, we directly measured the permeation of a test species across biomimetic membranes. Our test system is based on fast confocal imaging combined with a microfluidic approach to analyze transport across the membranes of giant unilamellar vesicles (GUVs).11 By immobilizing GUVs in a microfluidic channel, then performing a buffer exchange, it is possible to image the transport of a fluorescent solute across the membrane.
GUVs were formed in which the molar ratio of unsaturated PLinPC (1-palmitoyl-2-linoleoyl-sn-glycero-3-phosphocholine) to its corresponding oxidized product—POxnoPC (1-palmitoyl-2-(9′-oxo-nonanoyl)-sn-glycero-3-phosphocholine)—was varied.12, 13 This approach was designed to mimic different compositions as more and more of the unsaturated lipid is oxidized. We considered a simplified version of the total oxidative pathway that would be expected as a reactive oxygen species attacks the double bonds in an unsaturated lipid tail group. The oxidized product used in this work would be the result of three oxidative steps.13 First, a reactive oxygen species causes the formation of a phospholipid radical species by abstracting a hydrogen adjacent to the double bond. Next, these carbon-centered radicals rapidly react with free oxygen to form peroxyl radicals. The final step is termination, where the cleaved tail group is no longer reactive. POxnoPC is a major termination product of PLinPC oxidation.
In synthetic bilayer systems, the presence of reactive oxygen species has been linked to both the formation of singlet oxygen from photo-induced oxidation14 as well as a process known as autoxidation. Autoxidation occurs when unsaturated lipids, stored in water at physiological temperature, show the effects of oxidation in as little as 72 hours.6 Biological systems have a more diverse set of pathways to introduce reactive oxygen species: the presence of oxidants has been linked with cell respiration and metabolism;15 signaling processes;16 the inhalation of air pollutants;13 and exposure to radiation.13
High levels of lipid oxidation lead to membrane degradation. The amount of oxidation that a lipid bilayer vesicle can withstand before collapse depends on the composition of the membrane. For example, membranes consisting of saturated DPPC (1,2-dipalmitoyl-sn-glycero-3-phosphocholine) and oxidized linoleoyl-palmitoyl-lecithin could not form when there was more oxidized species than saturated species.17 20% POxnoPC in POPC (1-palmitoyl-2-oleoyl-sn-glycero-3-phosphocholine) vesicles compromises the membrane via sustained pore formation.18 The formation of pores has been associated with membrane water defects in molecular dynamics simulations of lipid bilayers.19 This is in contrast to passive diffusion, which occurs via partition into and diffusion across the membrane.19 In order to measure passive diffusion permeability rather than pore transport, total oxidized species concentration was kept below the 20% limit in our experiments.
This study evaluated the effect of oxidation of unsaturated lipids on passive membrane permeability of the membrane to a fluorescent short chain poly(ethylene glycol) molecule (PEG12-NBD). The characteristics of this molecule, including it’s octanol/water partition coefficient (0.20 ± 0.02), molecular weight (821.4 g/mol), diffusivity (3.66×10⁻⁶ cm2/s), and permeability in a ternary system, were characterized by Li et al. in 2010.20 The PEG-NBD species was chosen for this experiment because it is hydrophilic, but uncharged. As charged species can interact with lipid headgroups and have charge- and pH-dependent permeability,21 choosing an uncharged species simplifies the transport model. Additionally, the fluorescent label makes imaging the transport process simple with SDCM.
Experimental Section
1. Reagents used
1-palmitoyl-2-linoleoyl-sn-glycero-3-phosphocholine (PLinPC), 1,2-dimyristoyl-sn-glycero-3-phosphocholine (DMPC), 1-palmitoyl-2-(9′-oxo-nonanoyl)-sn-glycero-3-phosphocholine (POxnoPC), cholesterol, 1,2-dihexadecanoyl-sn-glycero-3-phosphoethanolamine-N-(cap biotinyl) (Biotin-DPPE), and 1,2-dipalmitoyl-sn-glycero-3-phosphoethanolamine-N-(lissamine rhodamine B sulfonyl) (Rhodamine-DPPE) were purchased from Avanti Polar Lipids. Avidin and succinimidyl 6-(N-(7-nitrobenz-2-oxa-1,3-diazol-4-yl)amino)Hexanoate (NBD NHS-ester) were obtained from Invitrogen. Amino-dPEG12-alcohol was purchased from Quanta Biodesign. Poly(dimethylsiloxane) (PDMS) was purchased from Dow Chemical, and the indium-tin-oxide (ITO) coated glass was obtained from Delta Technologies. α-tocopherol and all other chemicals were purchased from Sigma-Aldrich.
2. Preparation of Test Molecule
To prepare the PEG12-NBD, the amine-terminated poly(ethylene glycol) alcohol was reacted with the NBD NHS-ester.20 A 1:1 molar ratio of poly(ethylene glycol) to NBD NHS-ester was reacted in chloroform. The reaction was run at 45 °C for two hours, then at room temperature overnight. The reaction products were separated using high performance liquid chromatography, and confirmed using NMR spectroscopy (full protocol details in Supplementary Information).
3. Preparation of Glass Coverslips
Coverslips were sonicated in MilliQ water (Millipore) at 80°C for 30 minutes, then submerged in sulfuric acid with NoChromix (Sigma-Aldrich) overnight. The acid was rinsed away before sonicating the coverslips for 30 minutes in water. A microfluidic channel was fabricated from PDMS using standard polymer molding techniques.22 For irreversible bonding, oxidation of the PDMS and a #1 coverslip was performed with a corona treatment (BD-20AC, Elecro-Technic Products).23 Figure 1 shows the microfluidic device used to capture vesicles. The channel was a Y-junction, with two inlets and one outlet. The channel had a depth of 100 μm, a width of 1 mm, and a length of 1 cm. Vesicles containing 6 mol% Biotin-DPPE were captured using a biotin-avidin interaction at the glass surface. The coverslips were treated with a 1 mg/mL solution of avidin in water for 30 minutes, then flushed with 200 mM glucose and 4 mM HEPES buffer at pH 7.0 prior to addition of GUVs. Avidin was nonspecifically adsorbed to the glass surface.
Figure 1.
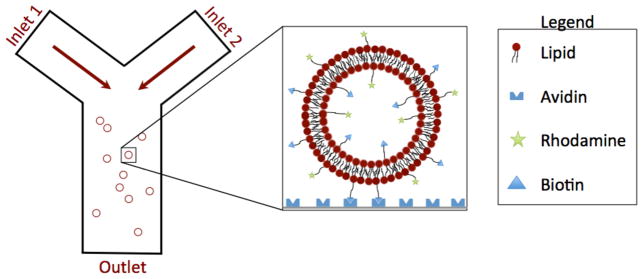
Schematic of the microfluidic device, a simple Y-channel design, with two inlets and a single outlet. The first inlet is for buffer, the second is for buffer with PEG12-NBD. The glass surface was functionalized with a 1 mg/mL avidin solution prior to the experiment. As shown in the inset, vesicles are captured in this device using a biotin-avidin interaction.
4. GUV Preparation and Observation
GUVs were prepared with the electroformation technique introduced by Angelova et al. 24, 25 Vesicle composition prior to oxidation was chosen to be a 42.5:42.5:15 molar ratio of DMPC:PLinPC:Chol. Rhodamine-DPPE was added at 0.01 mol% to visualize the membrane. PLinPC was stored with 0.5 mol% α-tocopherol to act as an oxygen scavenger in the membrane and prevent additional oxidation during electroformation and imaging.26 6 mol% Biotin-DPPE was used to attach the GUVs to the avidin-treated coverslip. The lipids were dissolved in chloroform, then spread into a thin film on the surface of the ITO coated glass. The film was dried in a vacuum for at least two hours before rehydration in pH 7.0 buffer with 200 mM sucrose and 4 mM HEPES. Electroformation was performed at room temperature with a 1 V signal oscillating at 10 Hz for two hours.
Vesicle composition was chosen to prevent phase separation prior to and after the addition of the oxidized species. PLinPC was chosen as a commercially available phospholipid with a corresponding commercially available oxidation product (POxnoPC). The saturated lipid DMPC was then added provide a non-oxidizing background. Finally, cholesterol was added to increase membrane permeability, making the transport process sufficiently slow to measure precisely.27 The amount of cholesterol was tailored such that GUVs containing POxnoPC did not show phase separation in fluorescent microscopy of the labeled GUV membrane. Prior to every transport experiment, we verified that no phase separation was apparent in the membrane of the selected GUV.
GUV composition was varied to simulate the oxidation process. The total concentration of oxidized species was varied up to 18 total mol%, to remain below the previously characterized poration limit.18 To mimic the oxidation of unsaturated lipids, GUVs were fabricated with various concentrations of POxnoPC replacing PLinPC.
After electroformation, GUVs were immediately transferred to the microfluidic channel. The GUVs not captured in the channel were gently flushed from the system using a syringe pump and glucose buffer.
5. Transport Experiments
After flushing the channel of all unbound vesicles, a single unilamellar vesicle of diameter greater than 10 μm was selected for observation. A syringe pump was used to add a solution of 5 μM PEG12-NBD in 200 mM glucose and 4 mM HEPES buffer at pH 7.0. A flow rate of 1.0 mL/h was chosen as the fastest flow that consistently did not damage or detach the GUVs. Transport was observed using spinning disk confocal microscopy, performed with a Yokogawa CSUX confocal head on a Nikon TI-E inverted microscope. 50 mW solid-state lasers at 491 or 561 nm were used as the illumination sources. Transport of PEG12-NBD was imaged with excitation at 491 nm and emission centered at 525 nm. Rhodamine-DPPE was excited at 561 nm and emission at centered 595 nm. The 561 nm excitation channel was used exclusively to select a unilamellar GUV prior to examining transport. During the course of the permeation experiment, the samples were only illuminated with the 491 nm laser. The Images were collected at a regular interval during buffer exchange as the fluorescent species crossed the GUV membrane.
6. Pore Formation Experiments
To examine the formation of pores in the membrane, GUVs were added to a solution of 1 mg/mL fluorescein-dextran in glucose buffer. To estimate the size of the pores, GUVs were imaged with two molecular weights of fluorescein-dextran: 40 kDa and 2000 kDa.
7. Image Processing
Image analysis was performed using Matlab (The MathWorks, Inc.). First, reference images with no fluorophore in the field were used to subtract the background from each image in the sequence. The average intensity value for each pixel was calculated for the series of background reference images. This matrix of background intensities was then subtracted from each of the series of transport images. Next, to correct for illumination heterogeneity across the field of observation, a flat-fielding technique was applied to each image. A reference image taken of 5 μM PEG12-NBD, with no GUVs in the field, was used to determine a multiplicative factor for each pixel to make it equal to the mean intensity value of the reference image. This was repeated for five reference images, and the resulting multiplicative values were averaged at each pixel position. This matrix of factors was applied to each image in the experimental sequence to flat-field the data set.
8. Data Analysis
One concern with spinning disk confocal microscopy is its imperfect exclusion of light from outside the focal plane.28 As shown in Figure 2, the intensity inside the vesicle prior to permeation is not flat. This curved profile indicates the presence of pinhole crosstalk, causing an increase in measured intensity inside the vesicle with background intensity greater where the light path through the vesicle is shorter. Analysis of the out of plane light contribution for a vesicle with varying concentrations showed that the relationship can be considered to be linear with vesicle size and fluorophore concentration, and corrected accordingly (details in Supplementary Information).
Figure 2.

Intensity profile across a vesicle immersed in 1 mg/mL 40 kDa fluorescein-dextran. This image has been corrected for uneven illumination by flat-fielding. As the fluorescein-dextran cannot permeate the membrane, the intensity inside of the vesicle should be 0, and the profile across the vesicle should be flat. The presence of a non-flat profile indicates that there is pinhole crosstalk present in the experiments. This contribution to the intensity inside of the vesicle was accounted for during data analysis.
To calculate the permeability from the intensity vs. time images, a finite difference model was based on Fick’s Second Law in spherical coordinates. Assuming no reaction, symmetry in both angular dimensions, a spherical vesicle, and that diffusion is a significantly higher contributor than convection to the permeation process, the governing equation simplifies to Equation 1. The variable cA represents the concentration of species A at a time t and radial coordinate r (0 at the vesicle center), and DA is the diffusivity of species A in the buffer solution.
| (1) |
This equation was solved in space and time using a finite difference approach. To simplify calculations, the method described by Somersalo et al. was used to decouple the time and space dimensions.29 This technique allowed for a simple time determination of concentration at each discretized space step (described in Supplementary Information).
Boundary conditions for the model were set at three points: an exterior point, the membrane itself, and the vesicle center. The exterior boundary was located at a point from the membrane equal to the vesicle radius. At this boundary, concentration was fixed at the experimentally observed fluorophore concentration. Note that this concentration changes with time as the buffer is exchanged. At the membrane, flux J was determined by membrane permeability such that:
| (2) |
Permeability P was the only free parameter in the model. At the center of the GUV, a no-flux boundary condition was applied.
To fit the experimental data to model results, experimentally observed average fluorescence in a circular region around the center of the vesicle was compared to modeled concentration in the analogous spatial region. Permeability P was determined by performing a χ2 minimization between the model output and the measured intensity values (further details in Supplementary Information).
Results
For concentrations of 0–10% POxnoPC, GUVs were unilamellar with diameters between 10–50 μm. Representative permeation curves for 0 mol% and 2.5 mol% POxnoPC are shown in Figure 3. The data shown include the fluorescence intensities at the exterior boundary point and the vesicle center as functions of time. The finite difference model results are shown in red. After addition of POxnoPC, the vesicles were too small to be efficiently captured by the mechanical trapping device. For these compositions, the biotin-avidin interaction was used to capture vesicles for analysis. As shown in Figure 3a, the permeability of the 0% POxnoPC vesicle is 2.80 ×10⁻⁶ cm/s. This is one order of magnitude less than the permeability of the 2.5% POxnoPC vesicle in Figure 3b (2.85×10⁻⁵ cm/s).
Figure 3.

Intensity data and model fit for a data set with a) 0% POxnoPC and b) 2.5% POxnoPC. The green data points indicate the normalized outside intensity data (measured at one vesicle radius from the GUV membrane), the blue indicate normalized vesicle interior intensity data. The red line a) b) indicates the results of the finite difference model for the best-fit permeability. Image scale bars are 10 μm. The permeability of the 0% POxnoPC data in a) shows a permeability of 2.80×10⁻⁶ cm/s, which is one order of magnitude lower than the permeability of the 2.5% POxnoPC membrane (P = 2.85×10⁻⁵ cm/s) shown in b).
Figure 4 shows the trend between measured permeabilities vs. percent oxidation over several trials for each composition. Two permeability regimes were clearly observed. The first regime, observed for membranes with no POxnoPC, corresponds to slow passive transport across the membranes, with permeability on the order of 1.5×10⁻⁶ cm/s. The second regime, seen for concentrations of POxnoPC, between 2.5 and 10% of the total composition, corresponds to fast transport with permeability on the order of 1.5×10⁻⁵ cm/s. Even small quantities of oxidation cause a large increase in the permeability of the membrane. The addition of the POxnoPC also caused an overall decrease in vesicle size (details in Supplementary Information, Figures S10 and S11).
Figure 4.
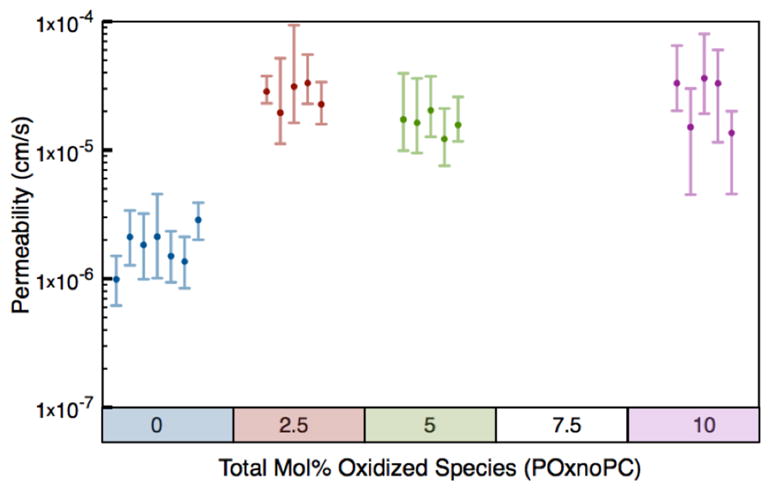
Measured permeability vs. percent oxidized species for four vesicle compositions. Each data point represents the calculated value and uncertainty for a single vesicle. Note that there appear to be two regimes of permeability: a slow regime for no POxnoPC present, and a fast regime for low levels (2.5–10%) POxnoPC present. The difference between these two regimes is over one order of magnitude.
For compositions of 12.5–18% POxnoPC, the standard electroformation protocol produced a low yield of high-quality unilamellar vesicles. Most vesicles displayed characteristics such as tubule formation, irregular shape, or decreased overall size. Representative images of vesicle formation for each composition are shown in Figure 5.
Figure 5.
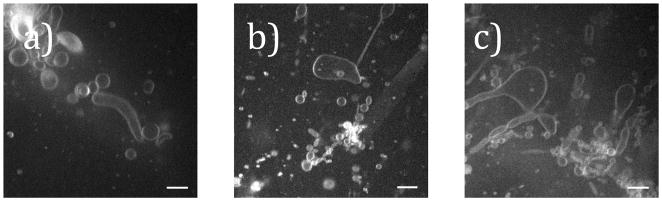
SDCM images showing vesicle formation for a) 12.5% POxnoPC, b) 15% POxnoPC, and c) 18% POxnoPC. For each composition, in addition to spherical vesicles, the lipids appear to form tubules and nonspherical structures. Spherical vesicles are typically quite small (<10 μm in diameter). Scale bars are 10 μm.
These vesicles all displayed extremely rapid transport properties inconsistent with passive diffusive transport across the bilayer. For all compositions in this range, both 40 kDa and 2000 kDa fluorescein-dextran molecules were able to cross the membrane. At POxnoPC compositions less than 12%, the membrane was impermeable to either dextran species. These results indicate that macromolecule-admitting pores are formed in the membrane. Since the 2000 kDa fluorescein-dextran was able to travel through these pores, we can estimate the pore size from the hydrodynamic diameter of the fluorescein-dextran. Previous studies have established the diameter of 2000 kDa fluorescein-dextran as 545 Å,30 so we can estimate that pore diameter must be greater than this value. Figure 6 shows images of GUVs in fluorescein-dextran solution at various compositions. Dextran permeability is apparent at the higher concentrations of oxidized species.
Figure 6.

SDCM images showing pore formation for vesicles with 12.5–18% POxnoPC. The 10% POxnoPC images are shown as a reference for vesicles without pore formation, as neither species of fluorescein-dextran could enter the vesicle. For higher concentrations of oxidized species, both the 40 kDa and the 2000 kDa fluorescein-dextran was able to enter the vesicle. As both species are too large to enter the vesicle through passive transport pathways, this indicates that nanoscale pores are present in the membrane for these concentrations of oxidized lipid. Scale bar is 20 μm, and all images are the same resolution.
Discussion
The replacement of an unsaturated lipid in a bilayer with its oxidization product increases the permeability of the bilayer to a test species. As the concentration of this oxidized product increases, it is possible to observe three distinct permeability regimes. The first regime consists of vesicles containing no POxnoPC where transport is slow. The second regime is for low to mid levels of oxidation (2.5–10% POxnoPC), where transport is about one order of magnitude faster than the slow regime. In this regime, the passive transport process can still be measured and is consistent with permeation-diffusion across the membrane.31 The third regime consists of vesicles containing high amounts of oxidation (12.5–18% POxnoPC). These membranes show characteristics of pore formation, allowing molecules as large as 2000 kDa fluorescein-dextran to cross the membrane. This is lower than the 20% limit of POxnoPC in a POPC membrane at which defects have been previously observed by Volinsky and coworkers.18 The discrepancy is likely explained by different membrane compositions: the same study confirms a significantly lower poration limit for a different oxidation product of POPC.18 A second study demonstrated that destabilizing pore formation in membranes consisting of DPPC and oxidized linoleoyl-palmitoyl-lecithin did not occur below 50% oxidized species.17 Taken together, these results indicate that both the membrane composition and the identity of the oxidized species determine how much oxidation causes membrane destabilization.
A second important result is that a small amount of oxidation (2.5% POxnoPC) can cause a drastic increase membrane permeability. This increase, corresponding to one order of magnitude in permeability, represents a significant compromise of the barrier function of the lipid bilayer. This would indicate that even low levels of oxidation can have significant impact on membrane function. However, notably, there was no discernible difference between the measured permeability between 2.5% and 10% oxidation, indicating that low levels of oxidation are as damaging as significantly higher levels to the barrier properties of the membrane. Until pore formation began to occur, additional oxidation of the vesicles did not continue to increase the membrane permeability.
This result is surprising, especially given early work on the oxidation/permeability relationship. In 1980, Mandal and Chatterjee examined the effect of ultraviolet radiation on the oxidation process and permeability of liposomes.32 Vesicle leakage of chromate anions was measured during the irradiation process, demonstrating a linear increase in leakage with the amount of oxidation. The amount of oxidation per liposome was measured via optical absorbance of conjugated dienes. While this technique is a simple method for measuring a single oxidation species, it has been suggested that this species accounts for less than 5% of the total oxidation products.33 Both the importance of composition on oxidation effects and the presence of other potential oxidation products in the liposomes could account for the differences in the reported trends between permeability and lipid oxidation.
The compositions in the pore-formation regime are also notable. While these membranes showed pore formation, the membranes themselves were stable over several hours. Previous studies have shown that oxidation can cause rapidly opening and closing pores in phospholipid membranes.3 While it is not clear if the pores formed in the third regime are transient or stable, the existence of pores is consistent with previous studies.34
One particular concern in obtaining GUVs with precise levels of oxidation is the potential for lipid oxidation during electroformation. Although electroformation is known to cause both oxidation and variations in concentration, the presence of α-tocopherol (as used in this study) has been consistently shown to prevent oxidation.35 The difference in composition between vesicles formed during the electroformation process has been studied previously.36 By examining the difference in fluorescence intensity of the membrane, it was shown that the overall composition varied by less than 2 mol% between vesicles in one electroformation batch.
Conclusions
Our results contribute additional understanding to the field of changes in bilayer properties during phospholipid oxidation. Previous work has examined the effect of lipid oxidation on numerous membrane properties. Shape changes such as the formation of membrane buds and tubules have been examined extensively.1 These shape changes are attributed to an initial increase, followed by a decrease, in membrane curvature with the oxidation process.37 The variation in curvature is also associated with an increase in membrane surface area.2 Additional work has shown decreases in membrane tension,38 fluidity,4 and increases in lipid flip-flop rate.18 Phase separation is promoted by lipid oxidation in both liquid ordered – liquid disordered systems,5, 6, 14 as well as membranes containing a liquid-extended phase.39 Some studies have shown complete membrane disintegration at high levels of lipid oxidation.38 Despite significant research into the impact of oxidation on membrane properties, the effect of membrane damage from oxidation on permeability has not been characterized in detail. Previous studies of the impact of lipid oxidation on membrane characteristics have shown in general that decreasing bilayer thickness12 and increasing lipid mobility40—both demonstrated results of oxidation—would lead to increased permeability. While we observed no phase separation in any of the vesicles examined, it is also possible that phase separation at a scale below the resolution of optical microscopy could lead to changes in membrane permeability. Here we show conclusive evidence that permeability does increase with oxidation, leading to three distinct regimes of permeability for zero, low, and high levels of lipid oxidation. The low levels of oxidation in this study are particularly of interest, as concentrations as low as 1.3×10⁻⁴ % of oxidized to total phospholipid species have been associated with the formation of atherosclerotic lesions in humans.41 Further experimentation of low levels of phospholipid oxidation is necessary to fully understand the role of phospholipid oxidation in cell degradation and death.
Supplementary Material
Table 1.
Vesicle compositions studied.
| Mol% DPPC | Mol% PLinPC | Mol% POxnoPC | Mol% Chol |
|---|---|---|---|
| 42.5 | 42.5 | 0 | 15 |
| 42.5 | 40 | 2.5 | 15 |
| 42.5 | 37.5 | 5 | 15 |
| 42.5 | 32.5 | 10 | 15 |
| 42.5 | 30 | 12.5 | 15 |
| 42.5 | 27.5 | 15 | 15 |
| 42.5 | 24.5 | 18 | 15 |
Acknowledgments
The authors would like to thank Su Li for her help establishing the transport experiment protocol. We would also like to thank Dr. Rich Roberts, Dr. Terry Takahashi, and Farzad Jalali-Yazdi for their assistance with HPLC. This work was supported by the Office of Naval Research (Young Investigator Award N00014-12-1-0620) and the National Science Foundation (Award CBET-1067021).
Footnotes
Supplementary Information is available for further discussion of techniques including the reaction of PEG12-NBD (Figure S1), the estimation of pinhole crosstalk contribution variation with concentration (Figures S2–S6), and the finite difference model used for data analysis (Figures S7–S9).
References
- 1.Heuvingh J, Bonneau S. Biophys J. 2009;97:2904–2912. doi: 10.1016/j.bpj.2009.08.056. [DOI] [PMC free article] [PubMed] [Google Scholar]
- 2.Riske KA, Sudbrack TP, Archilha NL, Uchoa AF, Schroder AP, Marques CM, Baptista MS, Itri R. Biophys J. 2009;97:1362–1370. doi: 10.1016/j.bpj.2009.06.023. [DOI] [PMC free article] [PubMed] [Google Scholar]
- 3.Sankhagowit S, Biswas R, Wu S-H, Riche CT, Povinelli ML, Malmstadt N. Submitted for publication [Google Scholar]
- 4.Borst JW, Visser NV, Kouptsova O, Visser AJ. Biochim Biophys Acta, Mol Cell Biol Lipids. 2000;1487:61–73. doi: 10.1016/s1388-1981(00)00084-6. [DOI] [PubMed] [Google Scholar]
- 5.Volinsky R, Paananen R, Kinnunen PK. Biophys J. 2012;103:247–254. doi: 10.1016/j.bpj.2012.06.017. [DOI] [PMC free article] [PubMed] [Google Scholar]
- 6.Jacob RF, Mason RP. J Biol Chem. 2005;280:39380–39387. doi: 10.1074/jbc.M507587200. [DOI] [PubMed] [Google Scholar]
- 7.Ross R. Nature. 1993;362:801–809. doi: 10.1038/362801a0. [DOI] [PubMed] [Google Scholar]
- 8.Cadenas E, Davies KJ. Free Radical Biol Med. 2000;29:222–230. doi: 10.1016/s0891-5849(00)00317-8. [DOI] [PubMed] [Google Scholar]
- 9.Veber DF, Johnson SR, Cheng HY, Smith BR, Ward KW, Kopple KD. J Med Chem. 2002;45:2615–2623. doi: 10.1021/jm020017n. [DOI] [PubMed] [Google Scholar]
- 10.Foulkes E. Proc Soc Exp Biol Med. 2000;223:234–240. doi: 10.1046/j.1525-1373.2000.22334.x. [DOI] [PubMed] [Google Scholar]
- 11.Li S, Hu PC, Malmstadt N. Biophys J. 2011;101:700–708. doi: 10.1016/j.bpj.2011.06.044. [DOI] [PMC free article] [PubMed] [Google Scholar]
- 12.Wong-Ekkabut J, Xu Z, Triampo W, Tang I, Peter Tieleman D, Monticelli L. Biophys J. 2007;93:4225–4236. doi: 10.1529/biophysj.107.112565. [DOI] [PMC free article] [PubMed] [Google Scholar]
- 13.Reis A, Spickett CM. Biochim Biophys Acta, Biomembr. 2012;1818:2374–2387. doi: 10.1016/j.bbamem.2012.02.002. [DOI] [PubMed] [Google Scholar]
- 14.Haluska CK, Baptista MS, Fernandes AU, Schroder AP, Marques CM, Itri R. Biochim Biophys Acta, Biomembr. 2012;1818:666–672. doi: 10.1016/j.bbamem.2011.11.025. [DOI] [PubMed] [Google Scholar]
- 15.Droge W. Physiol Rev. 2002;82:47–95. doi: 10.1152/physrev.00018.2001. [DOI] [PubMed] [Google Scholar]
- 16.Lambeth JD. Curr Opin Hematol. 2002;9:11–17. doi: 10.1097/00062752-200201000-00003. [DOI] [PubMed] [Google Scholar]
- 17.Megli FM, Russo L, Sabatini K. FEBS Lett. 2005;579:4577–4584. doi: 10.1016/j.febslet.2005.07.022. [DOI] [PubMed] [Google Scholar]
- 18.Volinsky R, Cwiklik L, Jurkiewicz P, Hof M, Jungwirth P, Kinnunen PK. Biophys J. 2011;101:1376–1384. doi: 10.1016/j.bpj.2011.07.051. [DOI] [PMC free article] [PubMed] [Google Scholar]
- 19.Tieleman DP. Clinical and experimental pharmacology and physiology. 2006;33:893–903. doi: 10.1111/j.1440-1681.2006.04461.x. [DOI] [PubMed] [Google Scholar]
- 20.Li S, Hu P, Malmstadt N. Anal Chem. 2010;82:7766–7771. doi: 10.1021/ac1016826. [DOI] [PMC free article] [PubMed] [Google Scholar]
- 21.Seo PR, Teksin ZS, Kao JP, Polli JE. Eur J Pharm Sci. 2006;29:259–268. doi: 10.1016/j.ejps.2006.04.012. [DOI] [PubMed] [Google Scholar]
- 22.Kersten GF, Crommelin DJ. Biochim Biophys Acta, Rev Biomembr. 1995;1241:117–138. doi: 10.1016/0304-4157(95)00002-9. [DOI] [PubMed] [Google Scholar]
- 23.Gregoriadis G, Leathwood P, Ryman BE. FEBS Lett. 1971;14:95–99. doi: 10.1016/0014-5793(71)80109-6. [DOI] [PubMed] [Google Scholar]
- 24.Angelova MI, Dimitrov DS. Faraday Discuss Chem Soc. 1986;81:303–311. [Google Scholar]
- 25.Angelova M, Soleau S, Meleard P, Faucon F, Bothorel P. Prog Colloid Polym Sci. 1992;89:127–131. [Google Scholar]
- 26.Buettner GR. Arch Biochem Biophys. 1993;300:535–543. doi: 10.1006/abbi.1993.1074. [DOI] [PubMed] [Google Scholar]
- 27.Zocher F, van der Spoel D, Pohl P, Hub JS. Biophysical Journal. 2013;105:2760–2770. doi: 10.1016/j.bpj.2013.11.003. [DOI] [PMC free article] [PubMed] [Google Scholar]
- 28.Sandison DR, Webb WW. Appl Opt. 1994;33:603–615. doi: 10.1364/AO.33.000603. [DOI] [PubMed] [Google Scholar]
- 29.Somersalo E, Occhipinti R, Boron WF, Calvetti D. J Theor Biol. 2012;309:185–203. doi: 10.1016/j.jtbi.2012.06.016. [DOI] [PMC free article] [PubMed] [Google Scholar]
- 30.Venturoli D, Rippe B. Am J Physiol: Renal Physiol. 2005;288:F605–F613. doi: 10.1152/ajprenal.00171.2004. [DOI] [PubMed] [Google Scholar]
- 31.Seader JD, Henley EJ, Roper DK. Separation Process Principles. Wiley; New York: 2010. [Google Scholar]
- 32.Mandal T, Chatterjee S. Radiat Res. 1980;83:290–302. [PubMed] [Google Scholar]
- 33.Janero DR. Free Radical Biol Med. 1990;9:515–540. doi: 10.1016/0891-5849(90)90131-2. [DOI] [PubMed] [Google Scholar]
- 34.Mertins O, Bacellar IO, Thalmann F, Marques CM, Baptista MS, Itri R. Biophys J. 2014;106:162–171. doi: 10.1016/j.bpj.2013.11.4457. [DOI] [PMC free article] [PubMed] [Google Scholar]
- 35.Chatterjee S, Agarwal S. Free Radical Biol Med. 1988;4:51–72. doi: 10.1016/0891-5849(88)90011-1. [DOI] [PubMed] [Google Scholar]
- 36.Veatch S, Polozov I, Gawrisch K, Keller S. Biophys J. 2004;86:2910–2922. doi: 10.1016/S0006-3495(04)74342-8. [DOI] [PMC free article] [PubMed] [Google Scholar]
- 37.Kerdous R, Heuvingh J, Bonneau S. Biochim Biophys Acta, Biomembr. 2011;1808:2965–2972. doi: 10.1016/j.bbamem.2011.08.002. [DOI] [PubMed] [Google Scholar]
- 38.Caetano W, Haddad PS, Itri R, Severino D, Vieira VC, Baptista MS, Schroder AP, Marques CM. Langmuir. 2007;23:1307–1314. doi: 10.1021/la061510v. [DOI] [PubMed] [Google Scholar]
- 39.Sabatini K, Mattila JP, Megli FM, Kinnunen PK. Biophys J. 2006;90:4488–4499. doi: 10.1529/biophysj.105.080176. [DOI] [PMC free article] [PubMed] [Google Scholar]
- 40.Beranova L, Cwiklik L, Jurkiewicz P, Hof M, Jungwirth P. Langmuir. 2010;26:6140–6144. doi: 10.1021/la100657a. [DOI] [PubMed] [Google Scholar]
- 41.Pratico D, Iuliano L, Mauriello A, Spagnoli L, Lawson JA, Rokach J, Maclouf J, Violi F, FitzGerald G. J Clin Invest. 1997;100:2028. doi: 10.1172/JCI119735. [DOI] [PMC free article] [PubMed] [Google Scholar]
Associated Data
This section collects any data citations, data availability statements, or supplementary materials included in this article.