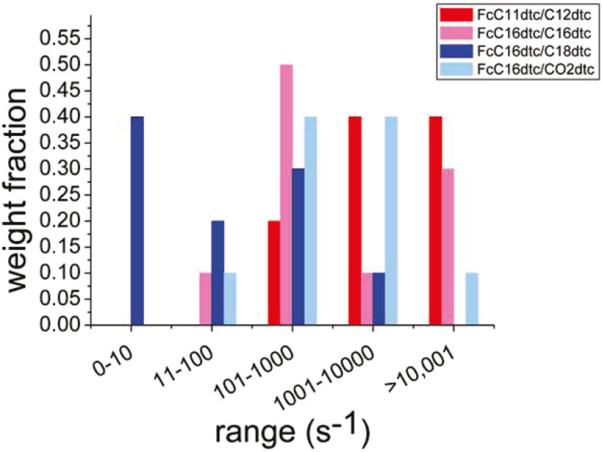
Figure 7.

Histogram comparing the average distributions of rates for the four systems as determined using the ACV method. The distribution for the short-chain FcC11dtc/C12dtc (red) is clearly weighted toward higher rates than the distribution for the long-chain FcC16dtc/C18dtc (blue) as expected on the basis of the alkane chain length.
